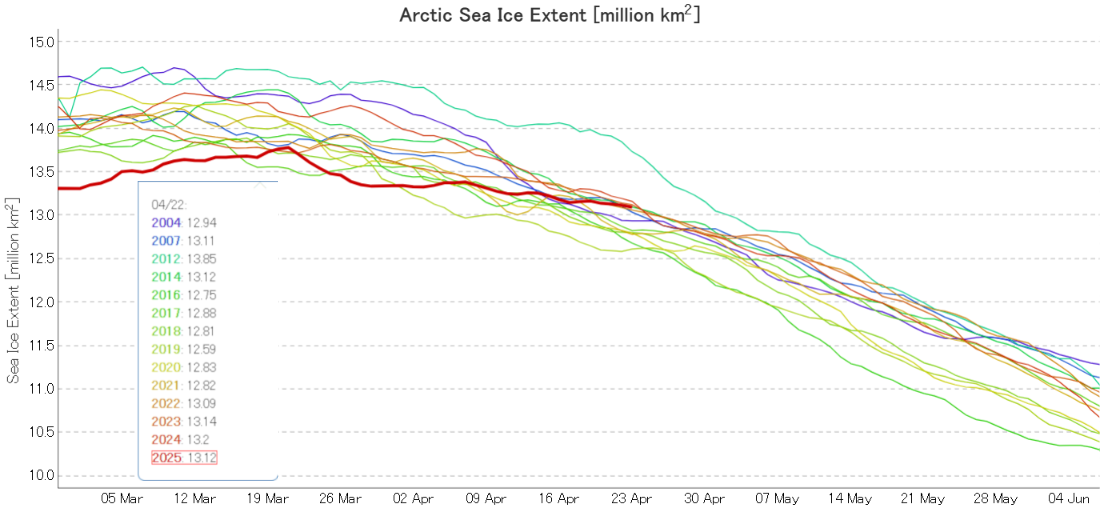
JAXA/ViSHOP extent finished the month of March “lowest for the date” once again:
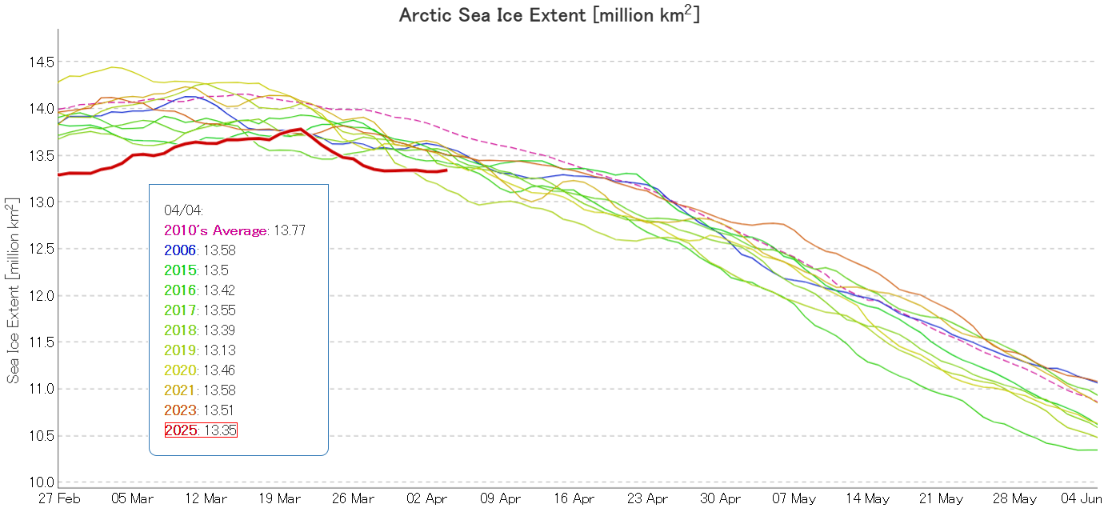
However, since then the graph has been “flatlining” and extent is now above 2019 and rapidly approaching the rest of the recent pack.
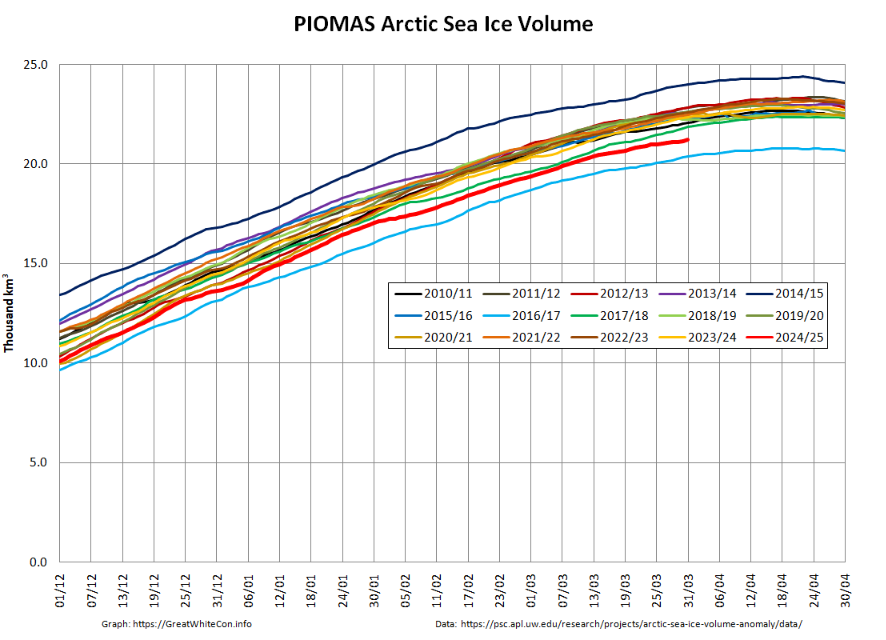
At the end of March PIOMAS Arctic sea ice volume had increased to 21.21 thousand km³, still 2nd lowest for the date in the PIOMAS record:
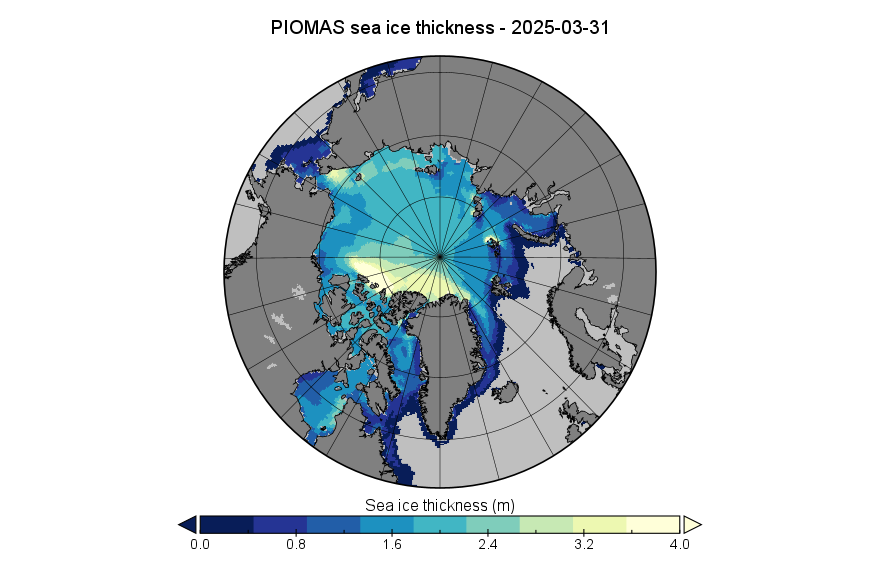
Here is the corresponding PIOMAS sea ice thickness map for March 31st 2025:
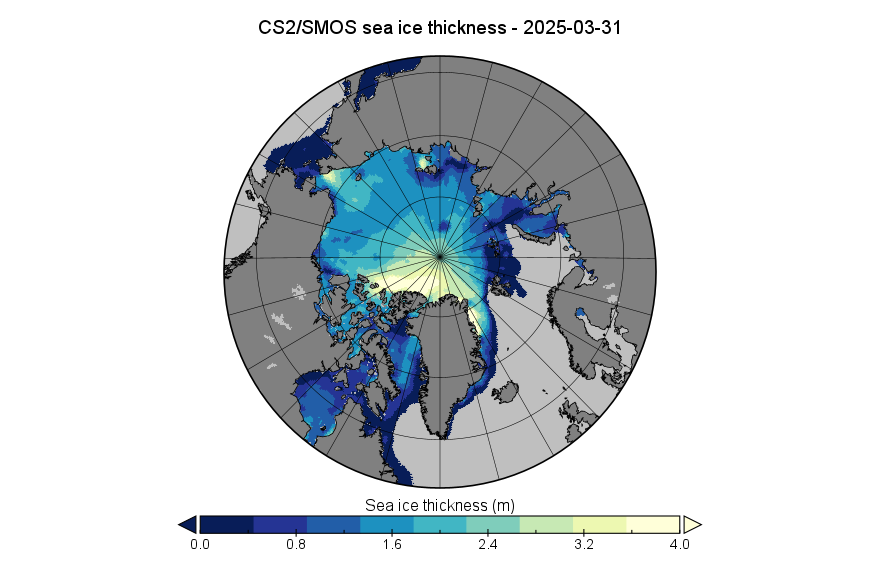
For comparison purposes, here is the “near real time” CryoSat-2/SMOS merged thickness data from the Alfred Wegener Institute:
Here too is the version 3.0 thickness map from AWI, incorporating additional Sentinel 3 data:
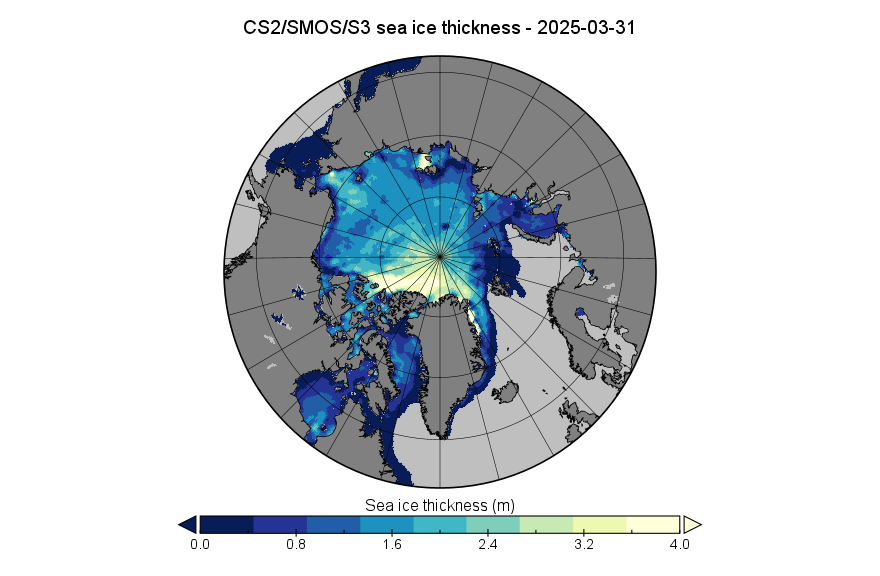
All three maps show an area of thick ice along the Siberian coast of the Chukchi Sea again this year. The CryoSat-2 maps also show thick ice between the New Siberian Islands and the coast.
The PIOMAS map also shows an area of thick ice extending past the Canadian Arctic Archipelago into the Beaufort Sea. The Beaufort arm is conspicuous by its absence from the CryoSat-2 maps.
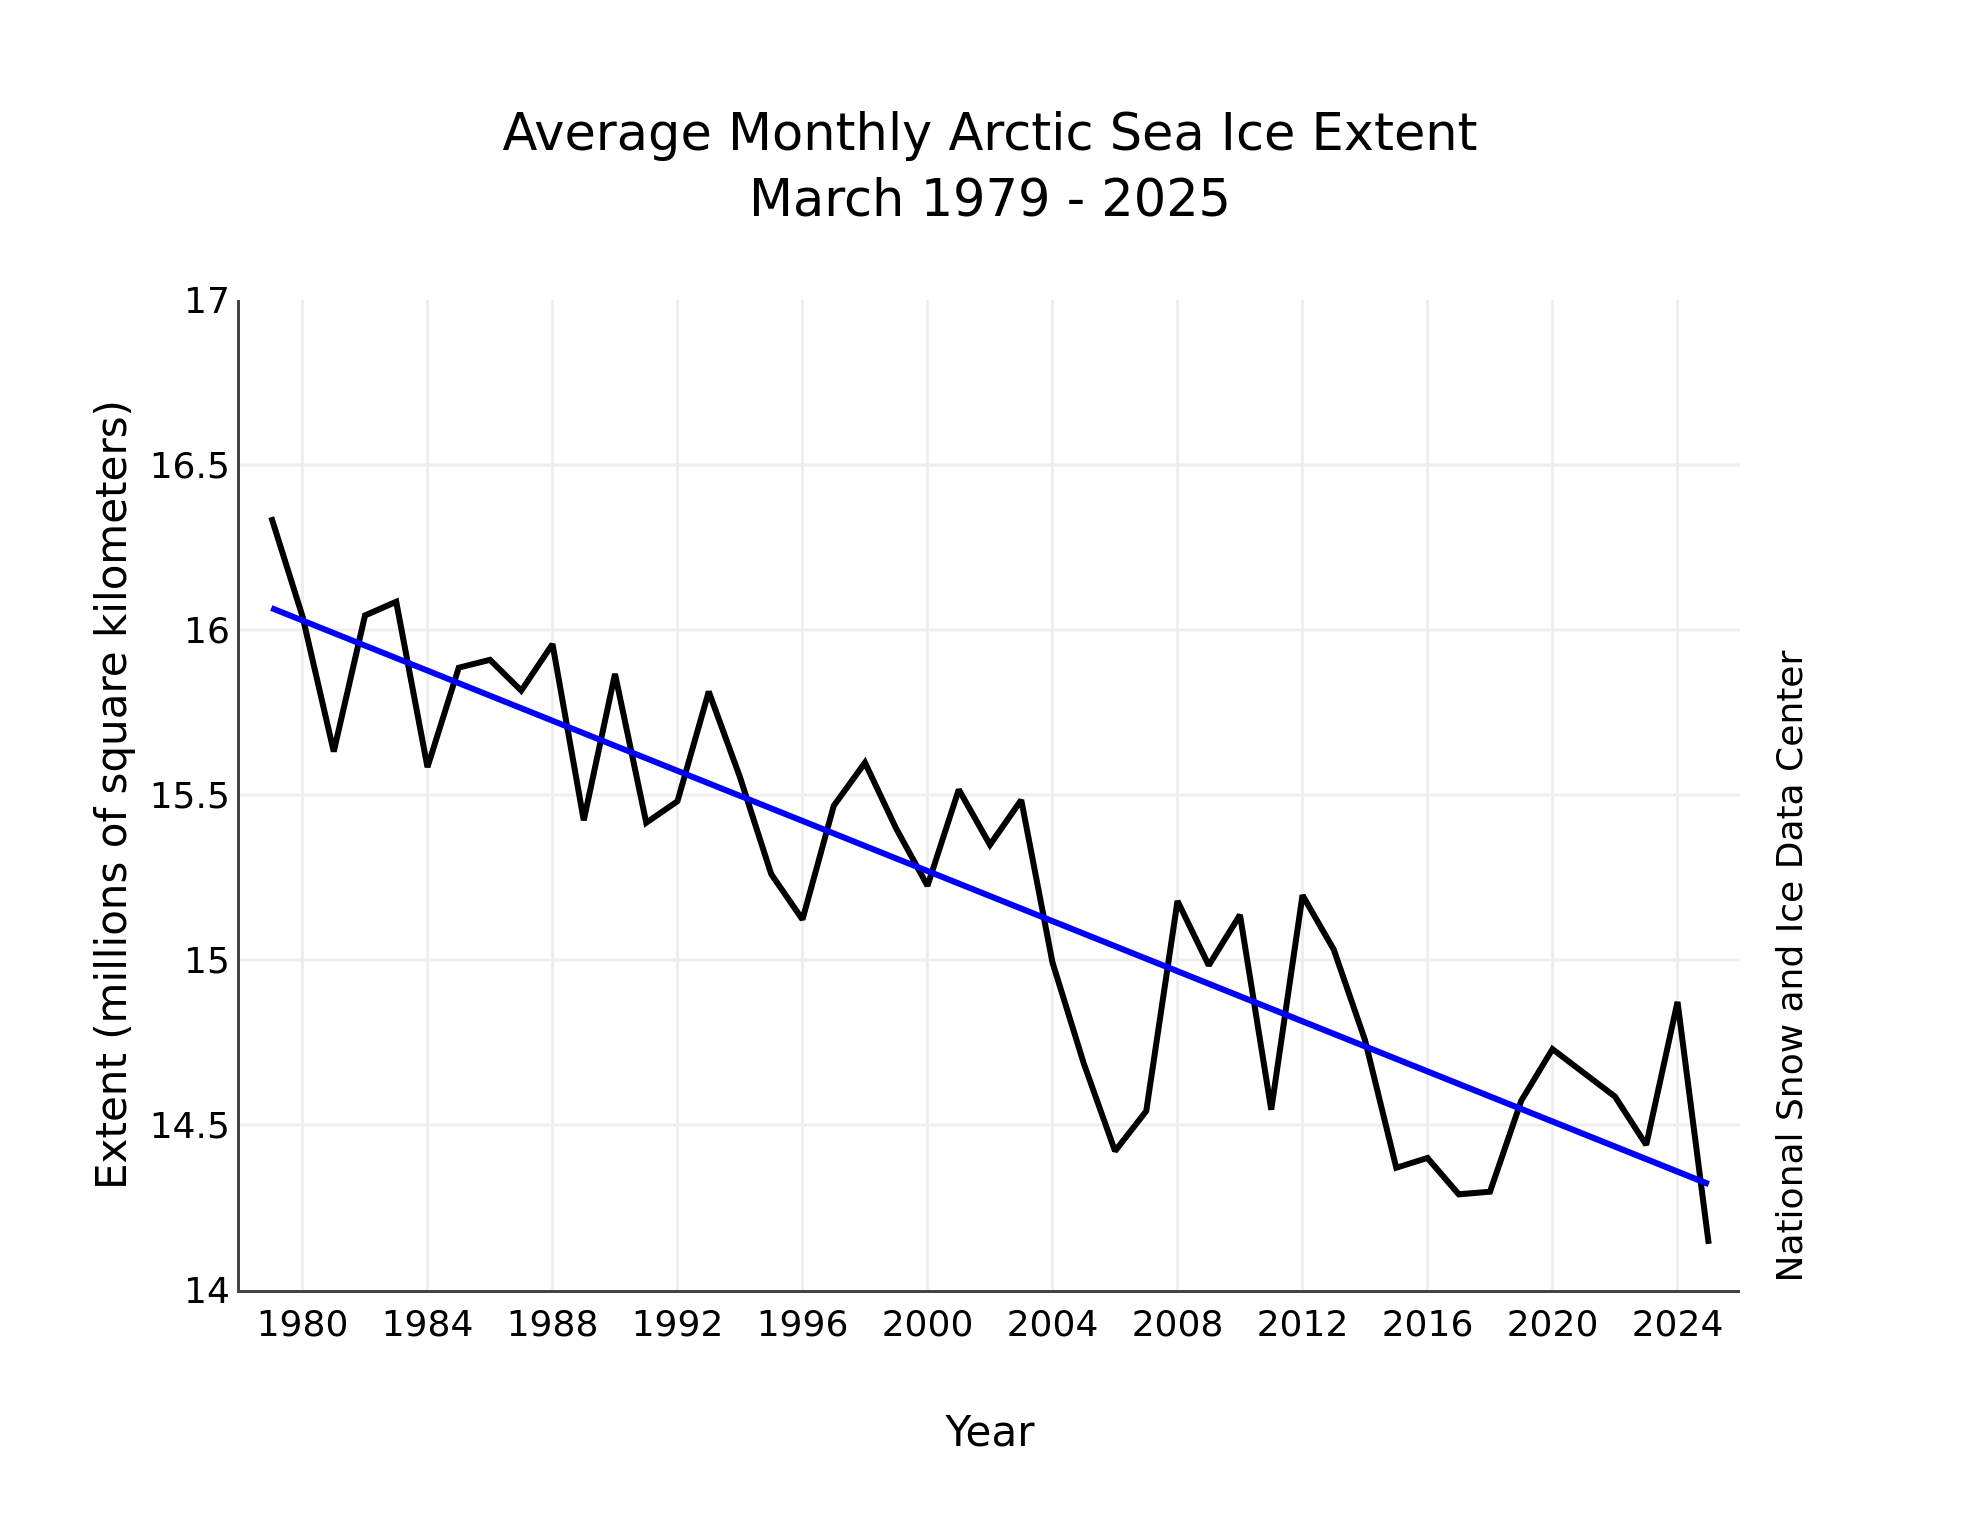
[Update – April 7th]According to the March edition of the National Snow and Ice Data Center’s “Sea Ice Today” analysis:
March Arctic sea ice extent averaged 14.14 million square kilometers, the lowest in the 47-year satellite record and 150,000 square kilometers below the previous record low March set in 2017. After a stall in ice growth at the end of February that persisted into early March, ice extent increased at a near-average pace until reaching a record low annual maximum extent of 14.33 million square kilometers, on March 22. During this ice growth period, the ice edge expanded southwards in the Bering Sea, the Sea of Okhotsk, the Barents Sea, and the northern part of the East Greenland Sea. The ice edge also expanded along the southern edge of the Labrador Sea, while retreating slightly northwards in Davis Strait and the southern part of the East Greenland Sea:
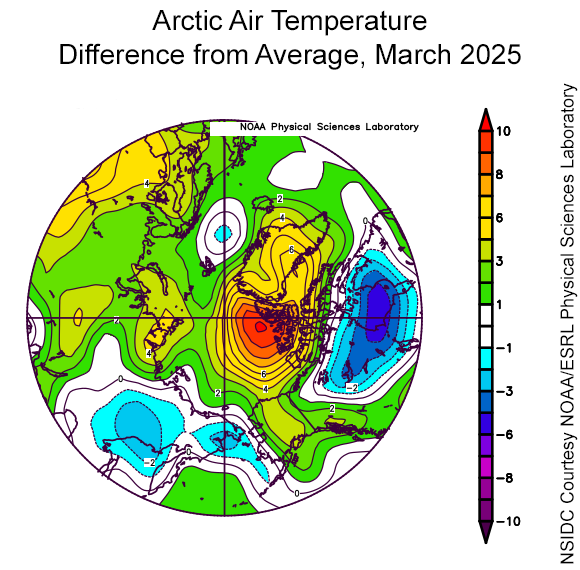
Temperatures at the 925 millibar level (approximately 2,500 feet above the surface) were above the 1981 to 2010 average around much of the Arctic region, with the exception of below-average temperatures over Hudson Bay:
The sea level pressure in March characterized a typical Beaufort High north of Alaska, while low pressure settled over the Barents and Kara Seas, as well as the Bering Sea:
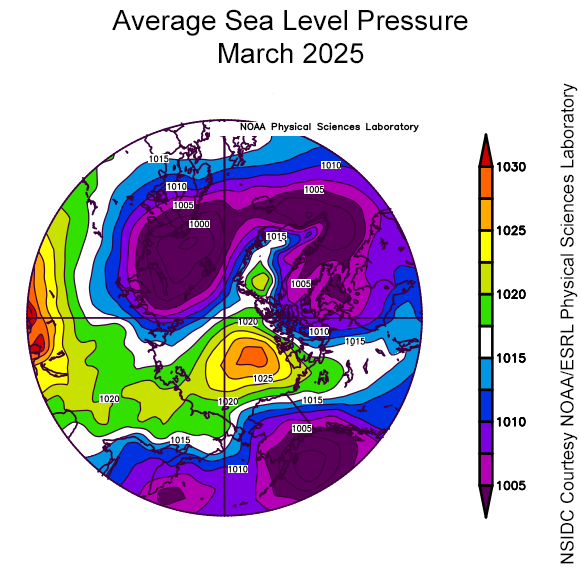
High pressure has continued over the Central Arctic throughout the first half of April, and is forecast to remain for the next 10 days at least:
The dipole with high pressure over Greenland and low pressure over Siberia has produced an overall drift of sea ice towards the Fram Strait.
[Update – April 24th]The current forecasts show no sign an end to the high pressure regime over the Central Arctic. The stable conditions have led to a continuation of the remarkably slow decline in sea ice extent so far this month:
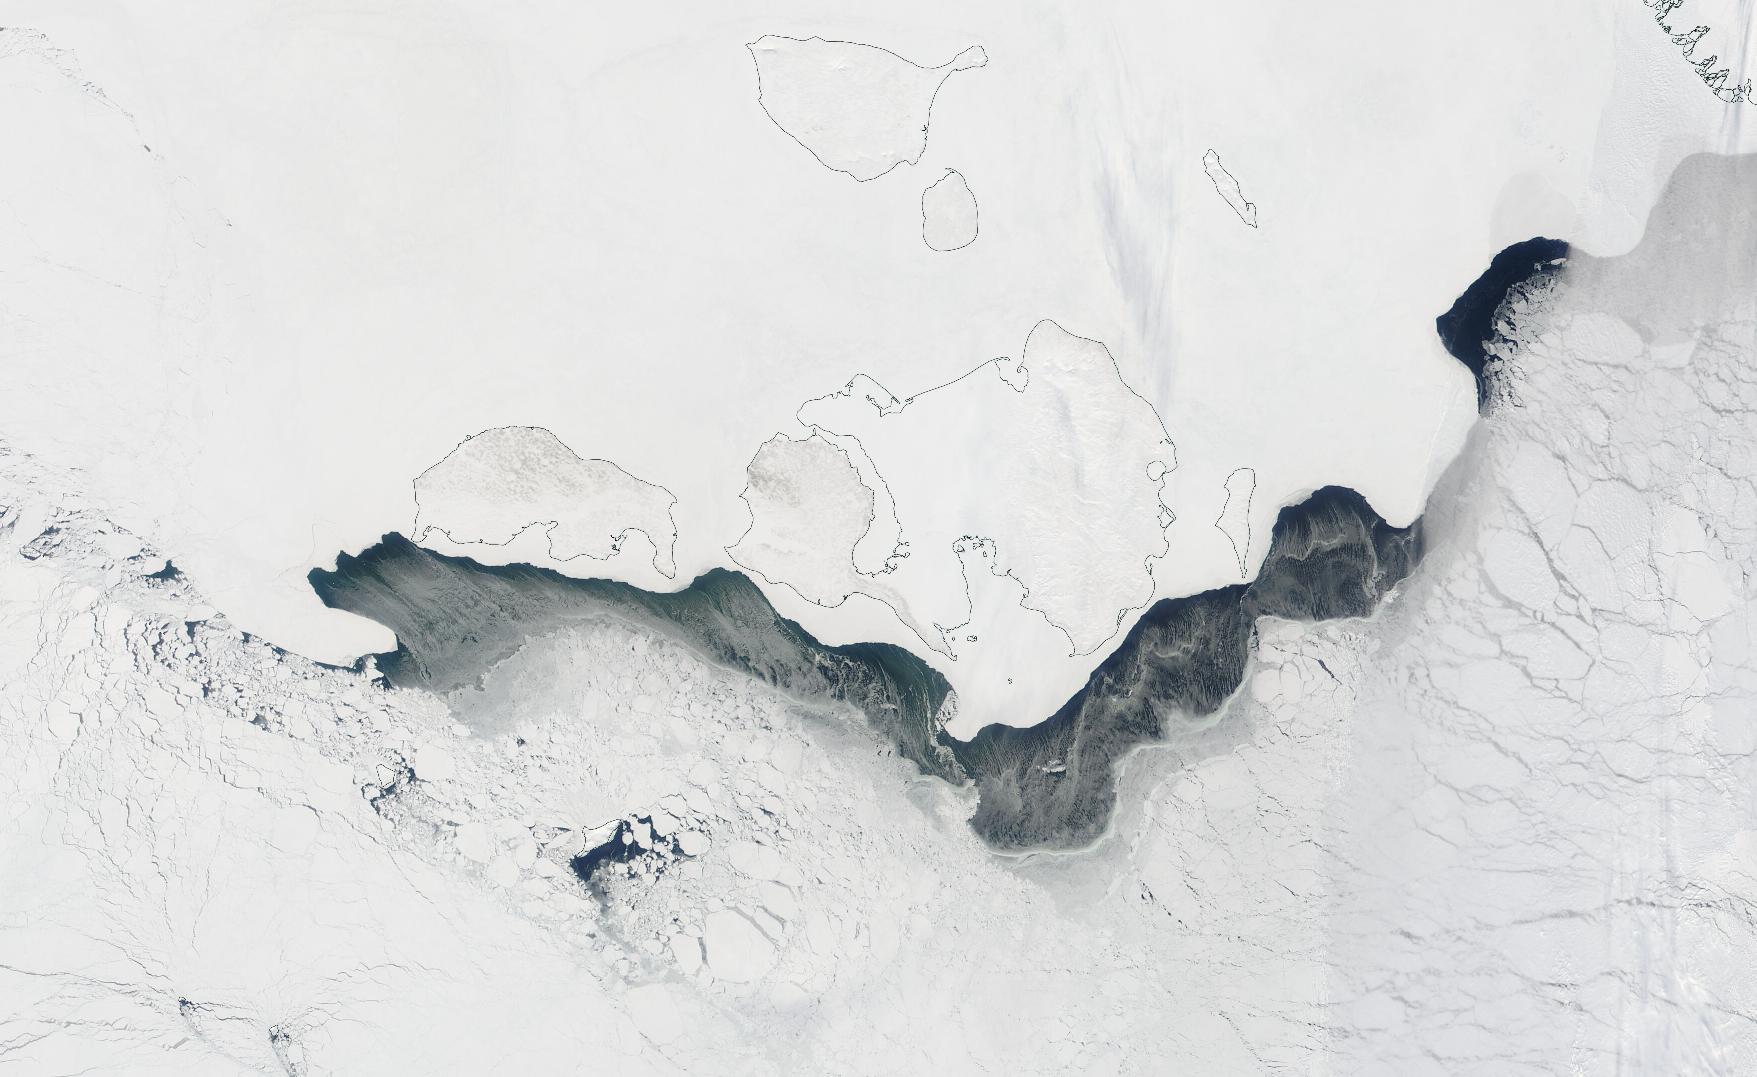
However, the anticyclonic winds have opened up a gap between the fast ice in the Laptev Sea and the mobile pack. The resulting open water has now begun to refreeze:
The discussion continues on the May open thread.
Scientists finally acknowledge that Arctic ice extent average has remained about the same since 2007
[Link to “skeptical” nonsense redacted – Mod]
But no way is Jim going to acknowledge this fact.
Hello again Peter,
For your information, this is the preprint which Chris Morrison recently misrepresented:
https://essopenarchive.org/doi/full/10.22541/essoar.174329135.56312606/v1
Here’s an extract from the associated “small print”:
and here are the “Key Points”:
Here’s the start of the abstract:
Here yet again is one of numerous examples of “Jim [and the NSIDC] acknowledg[ing] this fact.”
https://GreatWhiteCon.info/2022/10/rewriting-the-arctic/#comment-649721