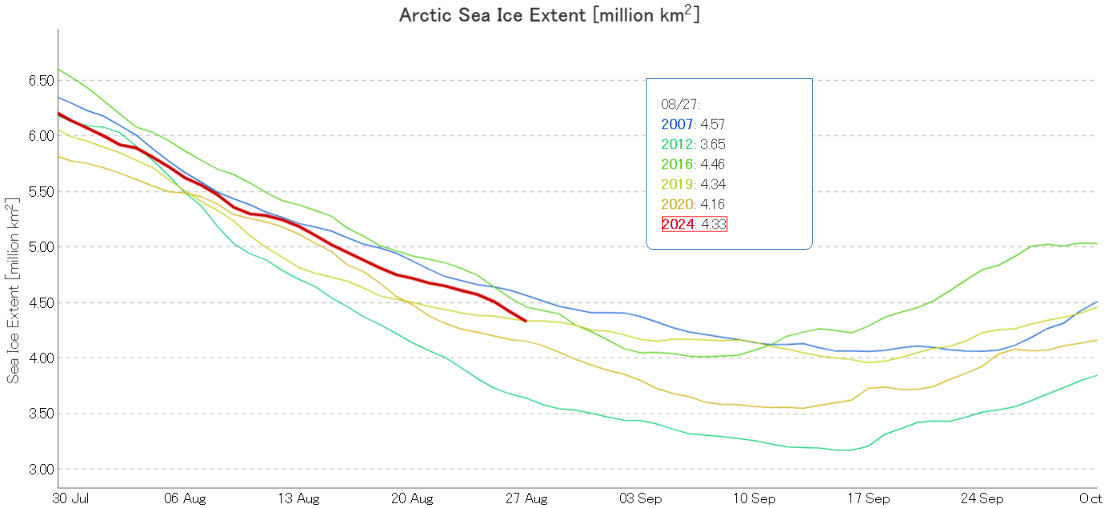
At the beginning of August JAXA/ViSHOP extent is 3rd lowest for the date in the satellite era:
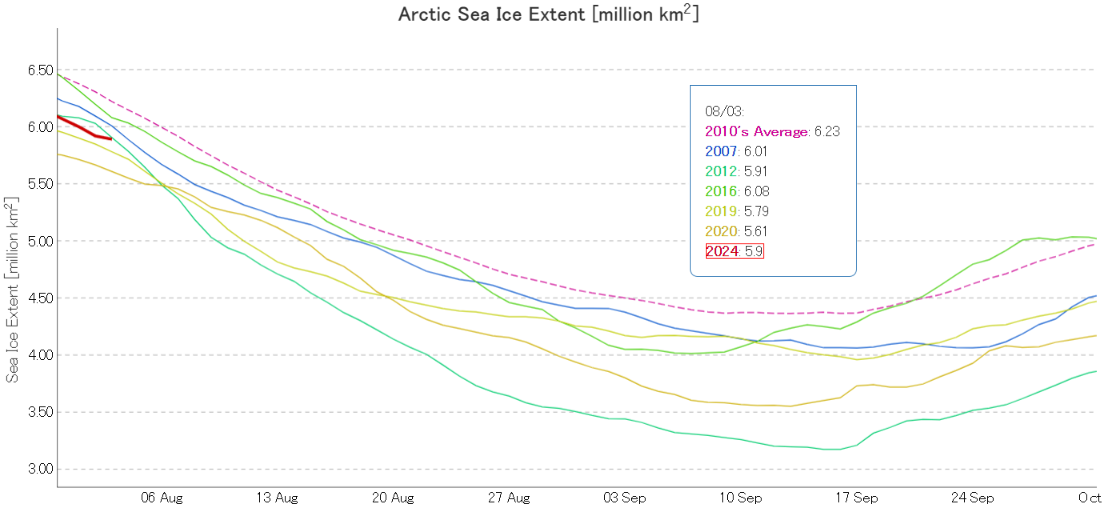
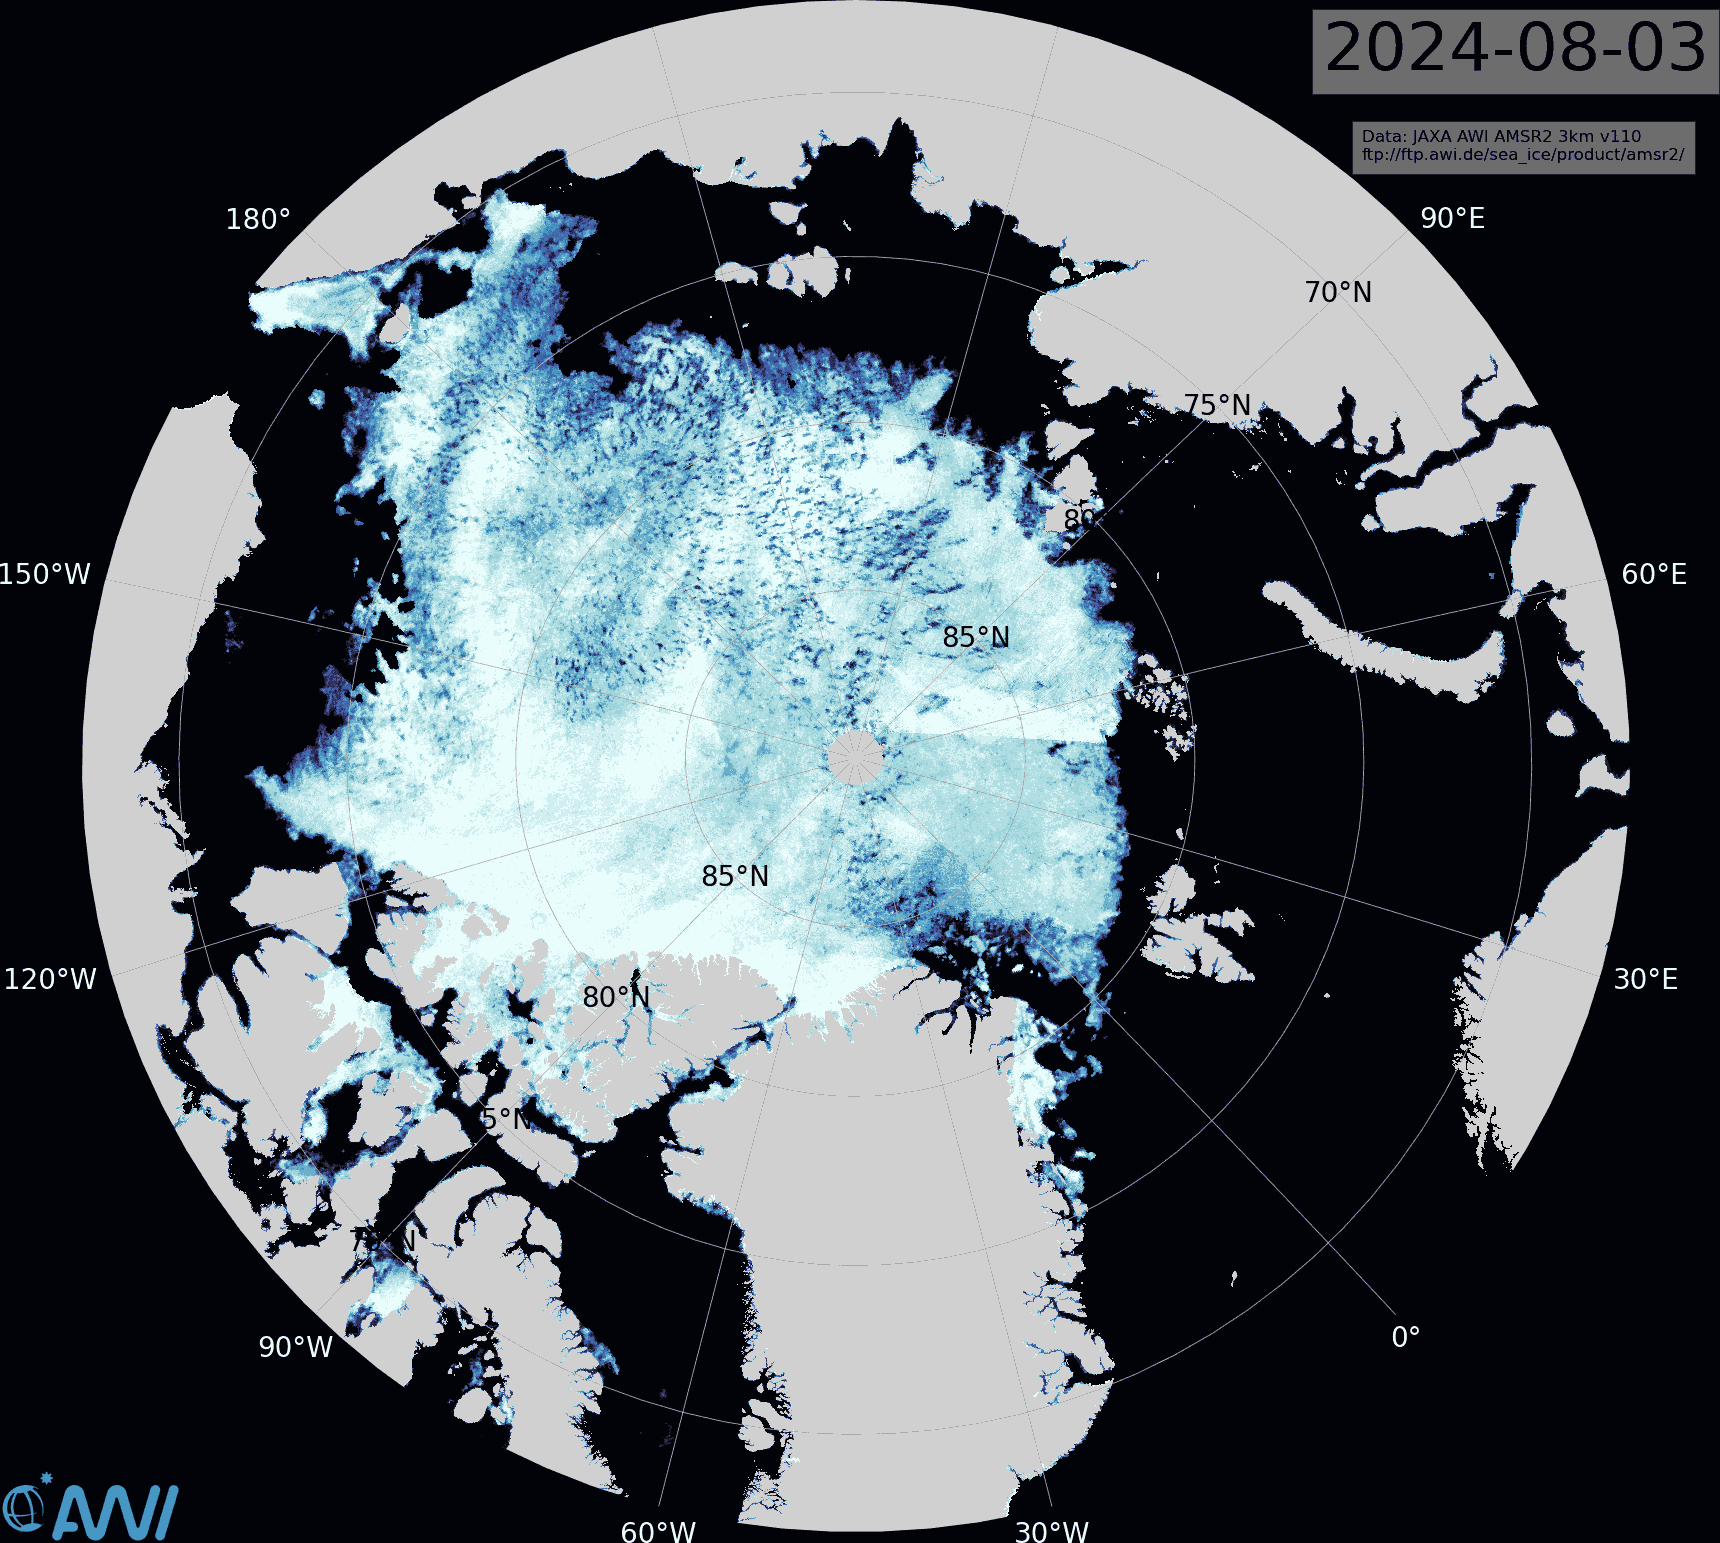
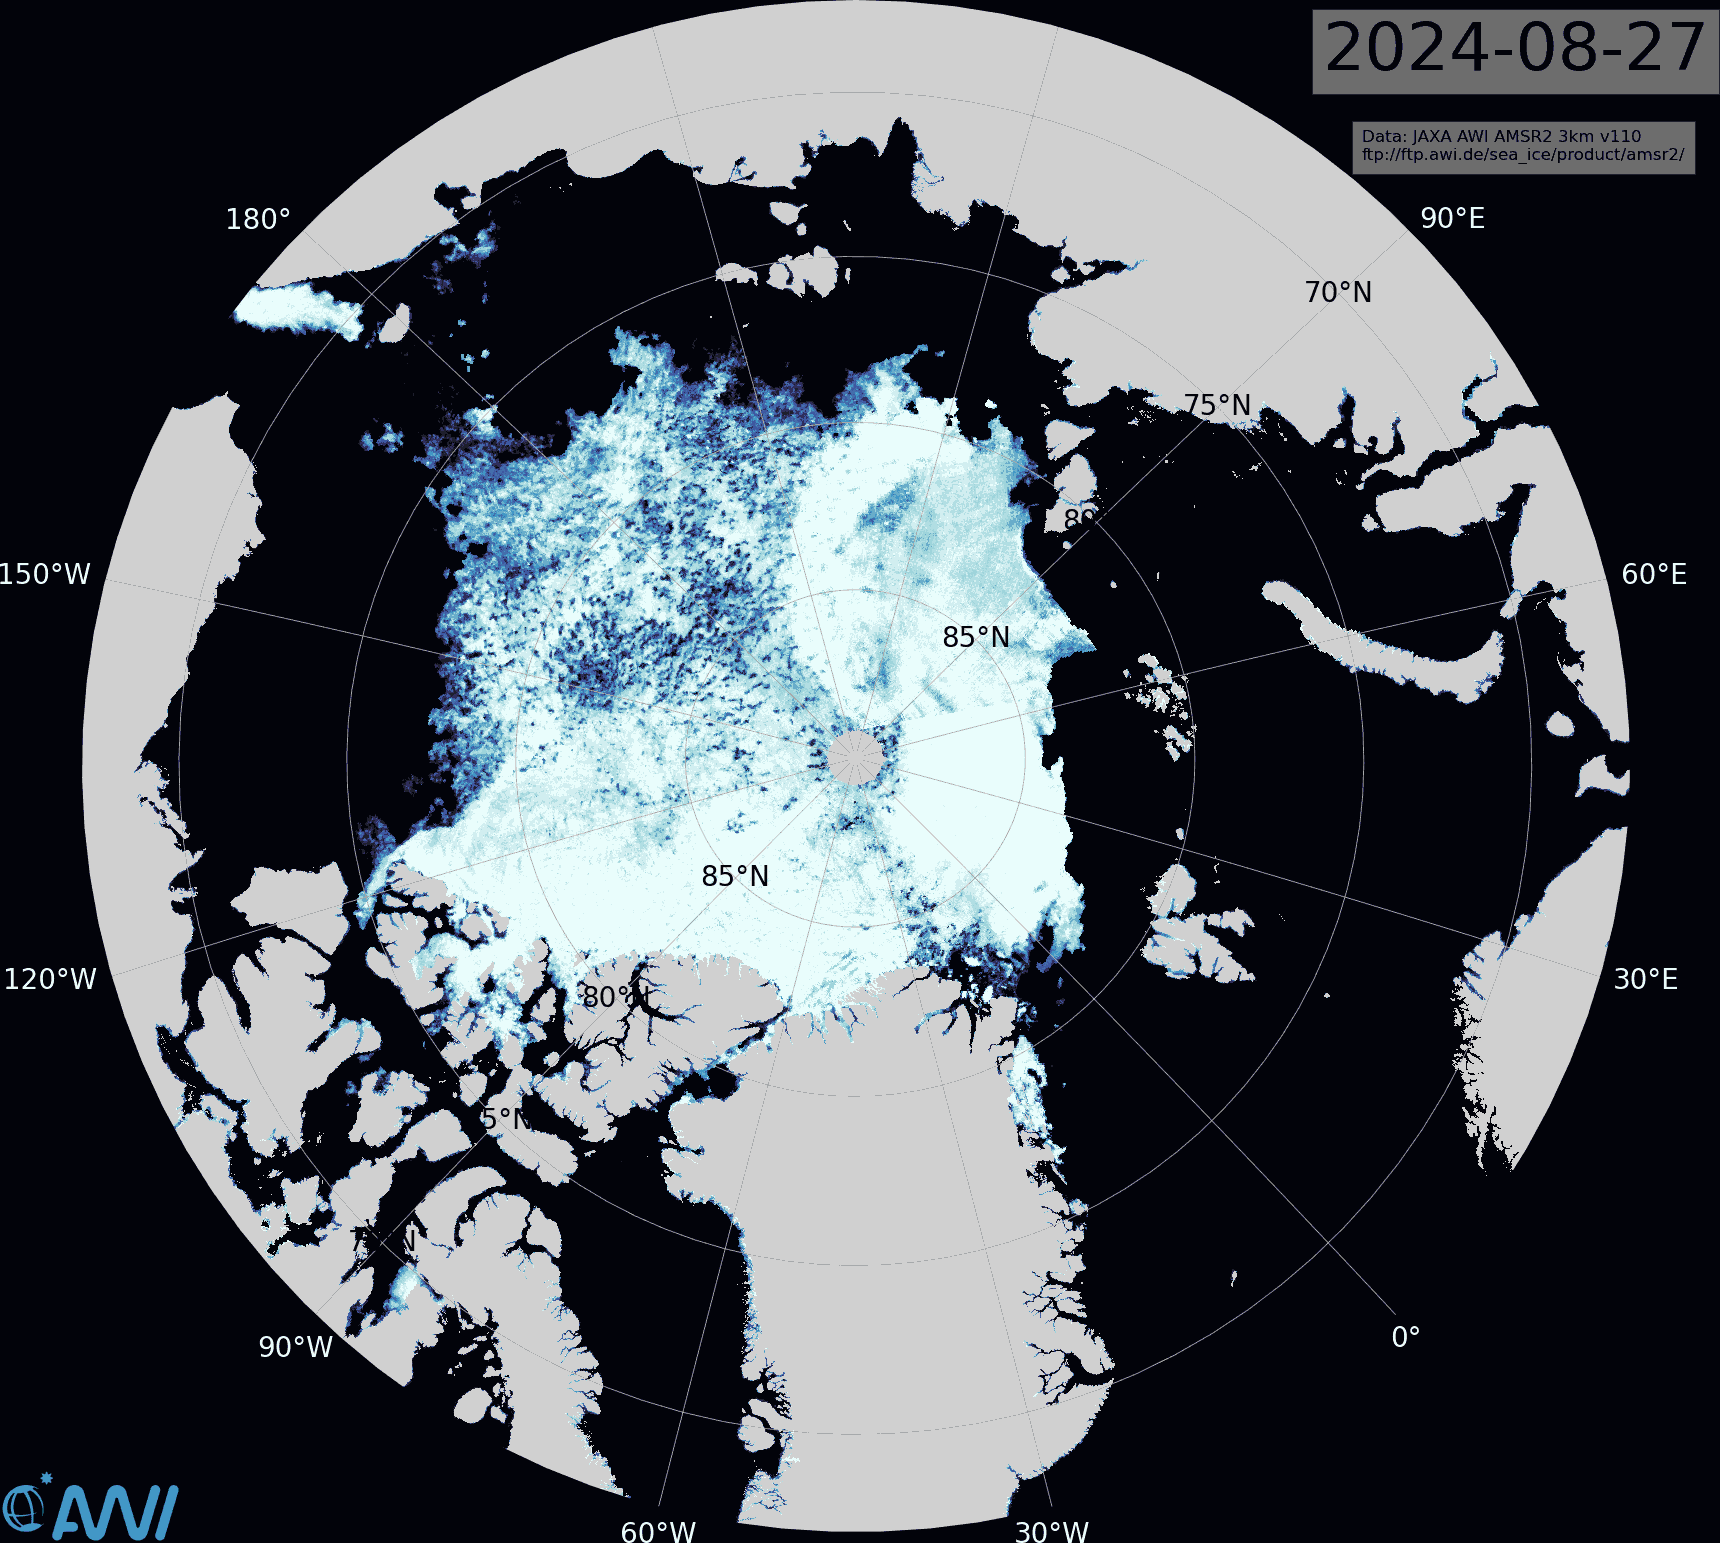
In 2012 extent had just started its unprecedented plunge towards the record September minimum, and 2024 seems certain to cross above the 2012 curve shortly. However, the latest AMSR2 sea ice concentration map from the Alfred Wegener Institute reveals areas of open water across the majority of the Central Arctic Basin:
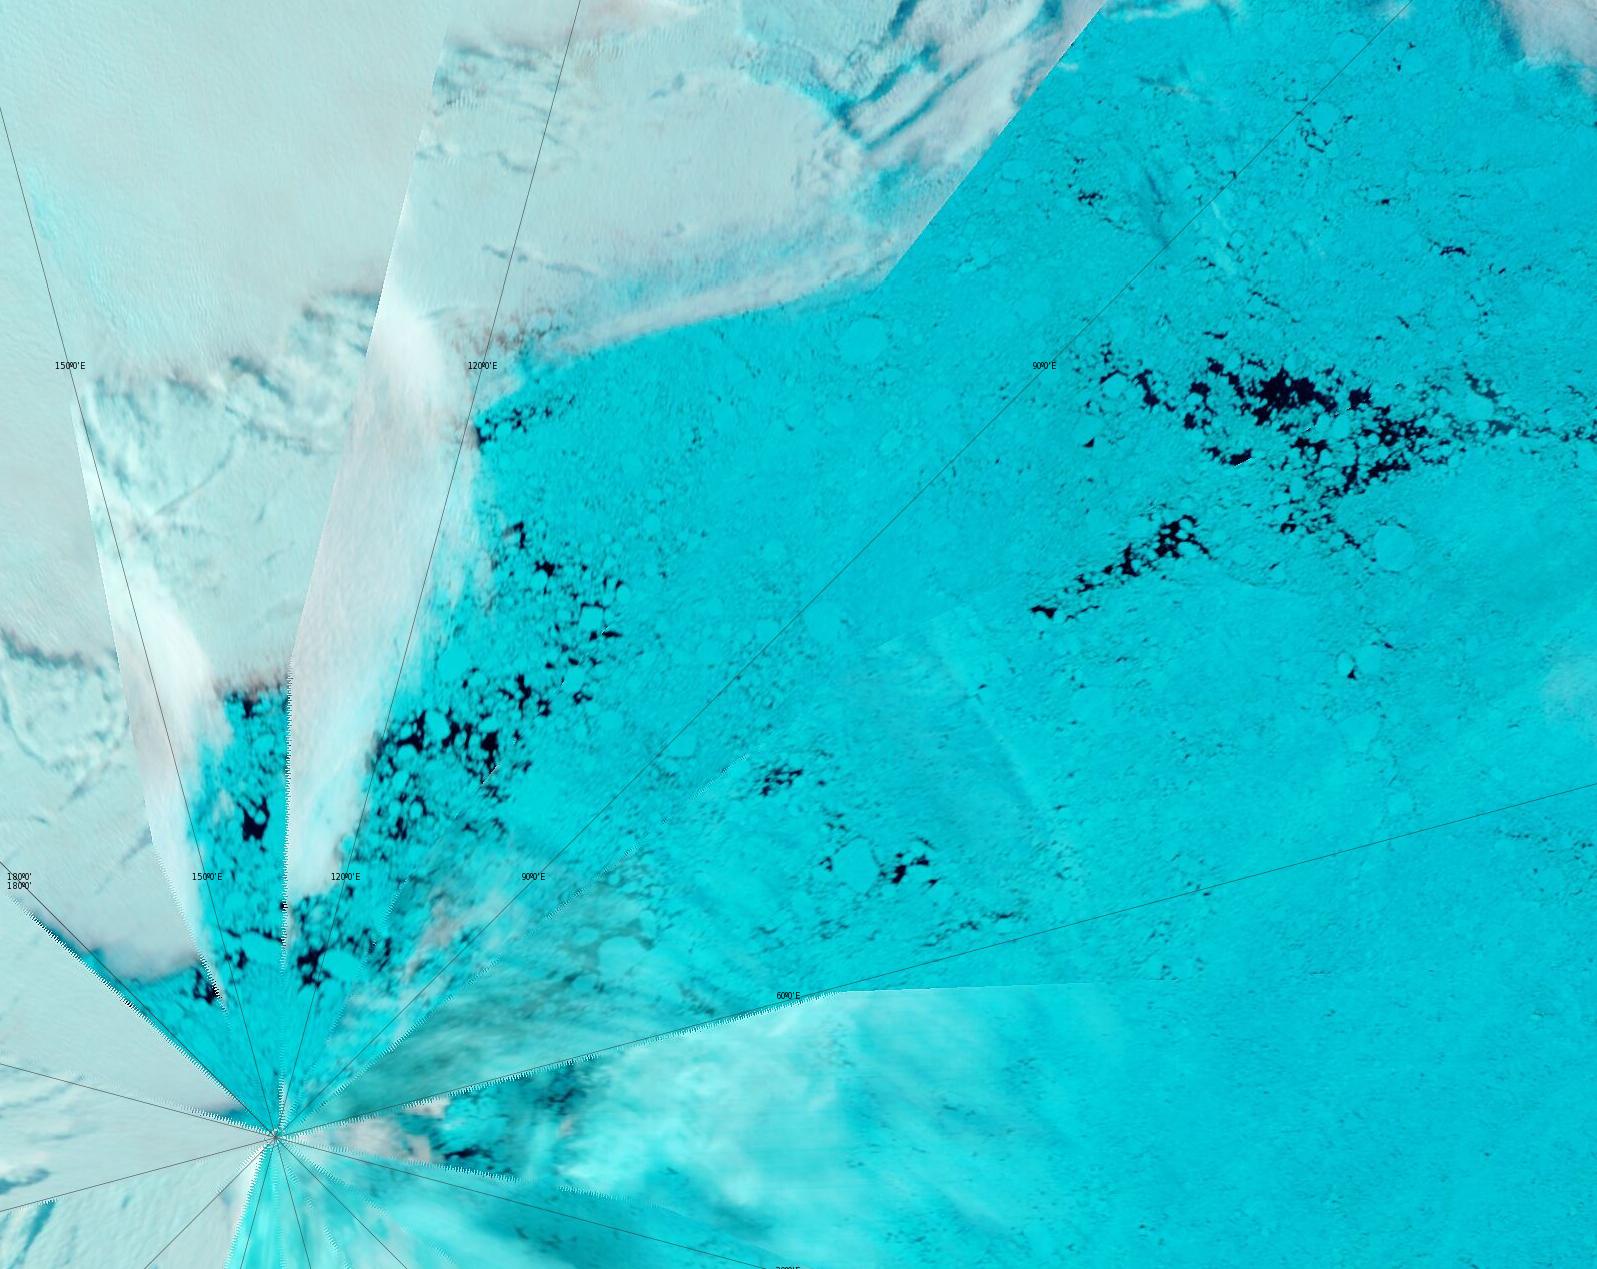
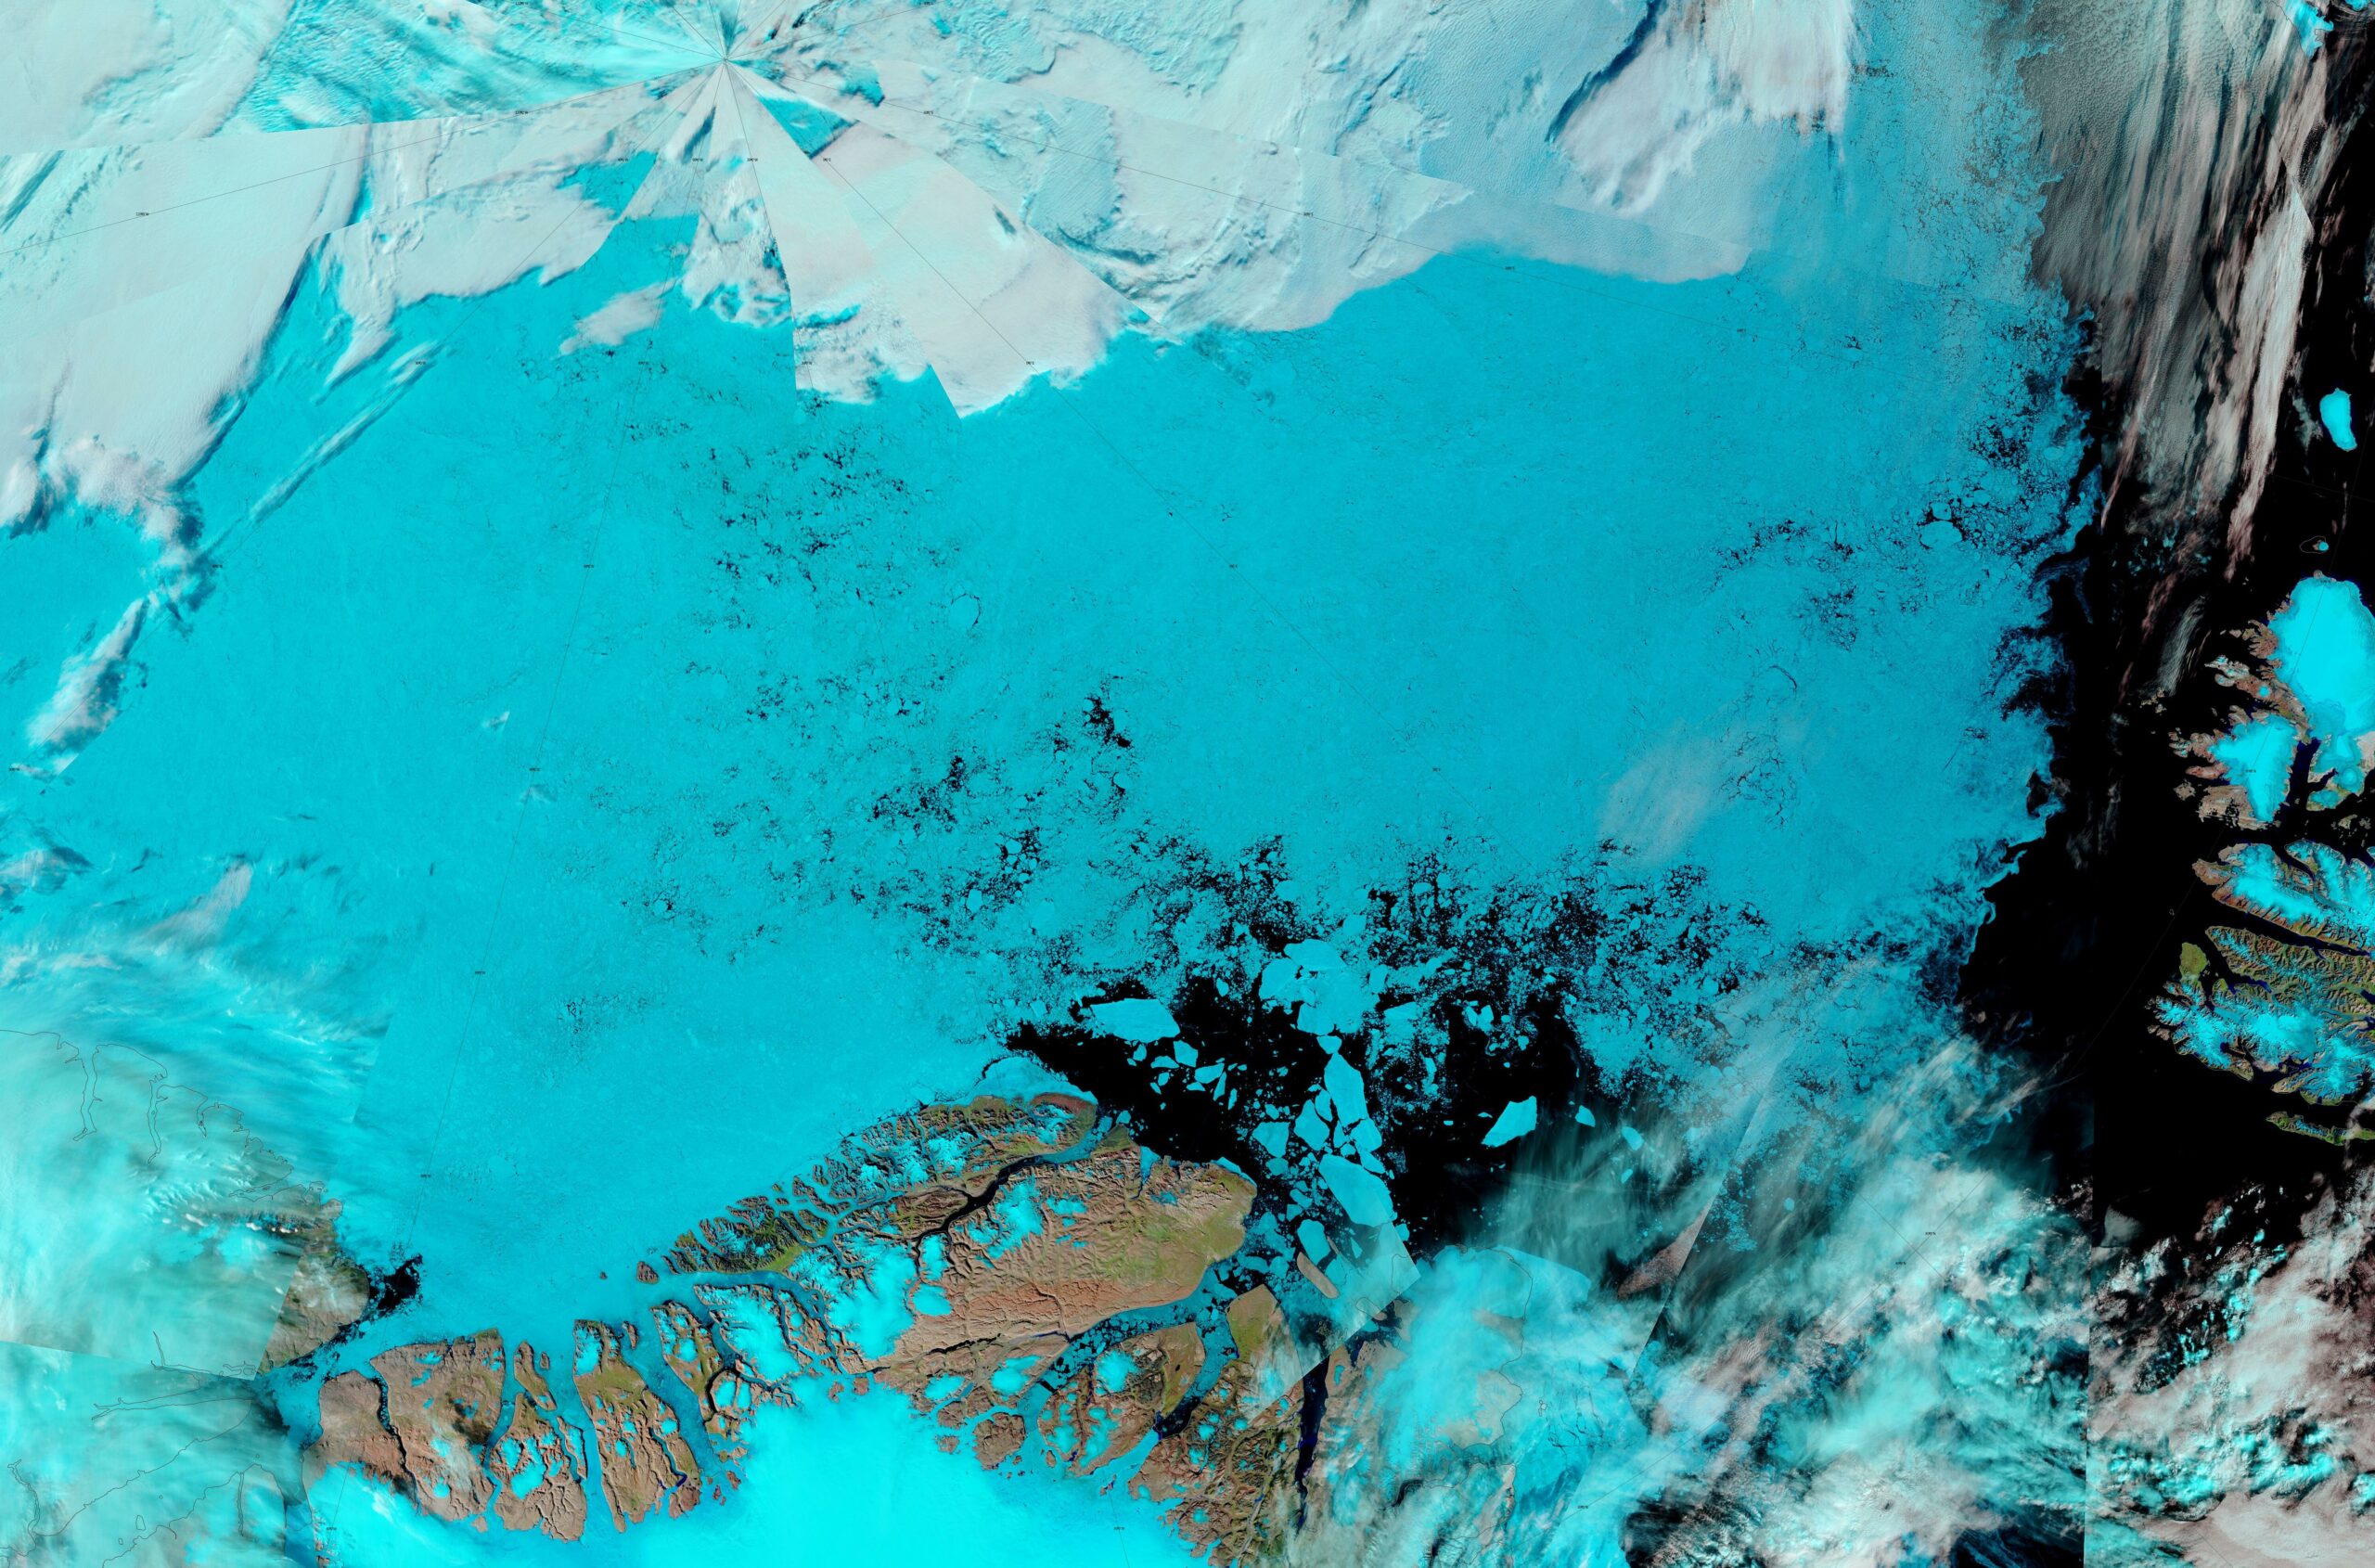
In particular the sea ice between the North Pole and northern Greenland is remarkably fragmented:
There is a currently a persistent low pressure area over the Central Arctic, but it’s nowhere near as deep as 2012’s “Great Arctic Cyclone“:
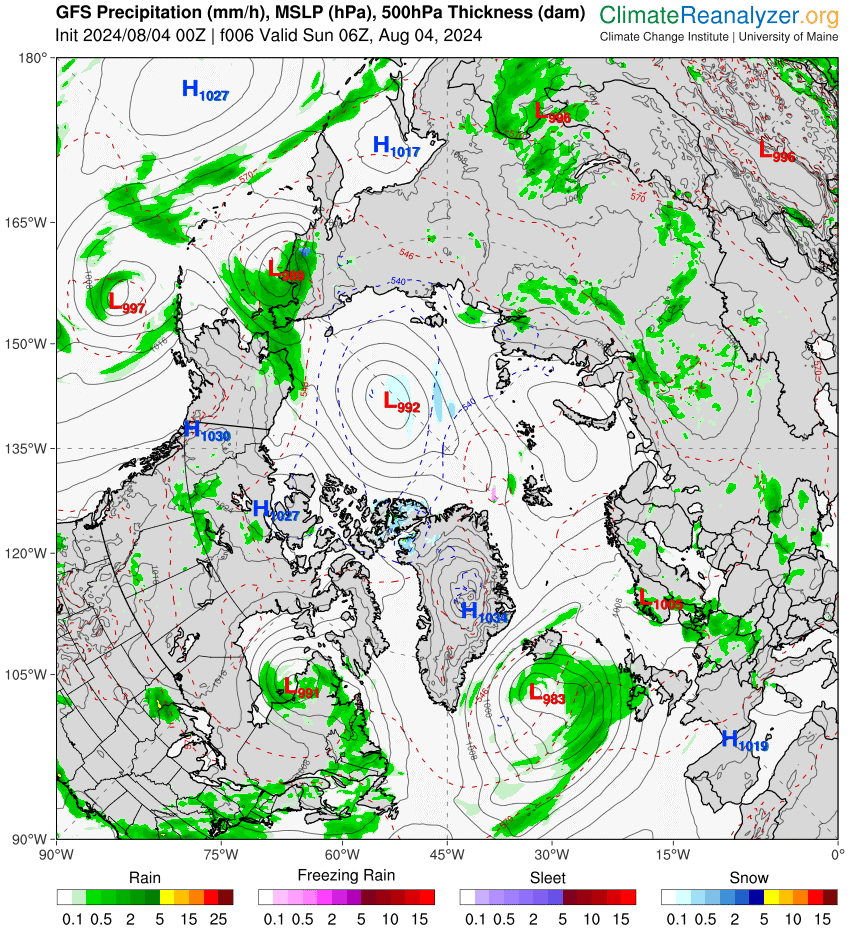
There is another low over the Bering Sea, which is bringing rain and hence heat to the Chukchi and Beaufort Seas, so there is plenty of potential for further rapid losses of sea ice. Will 2024 be able to keep up with the rate of decline in 2012?
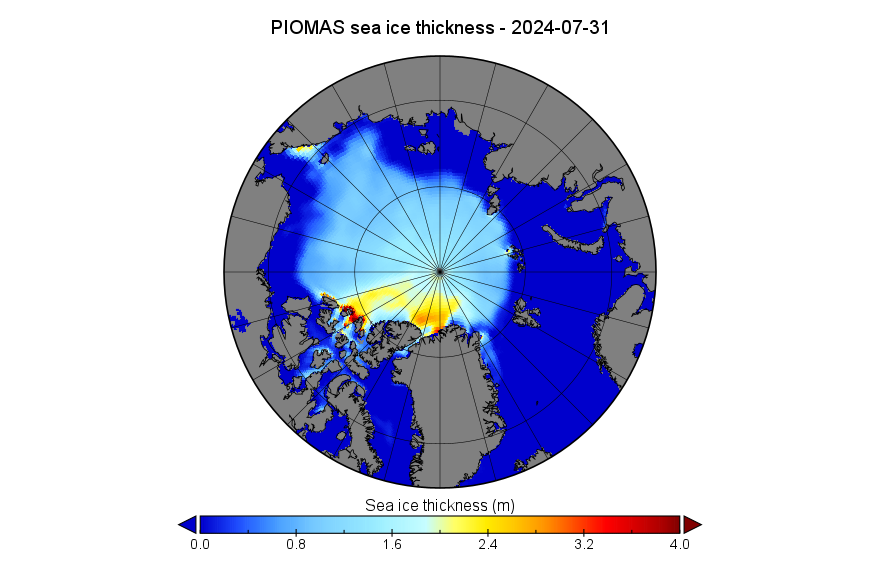
[Update – August 5th]The PIOMAS gridded thickness data for July 2024 has just been released. The thickness map still shows some ice over 2 meters thick along the Siberian coast of the Chukchi Sea. On the other side of the Arctic there are areas of thinner ice along the coast of Ellesmere Island and North East Greenland:
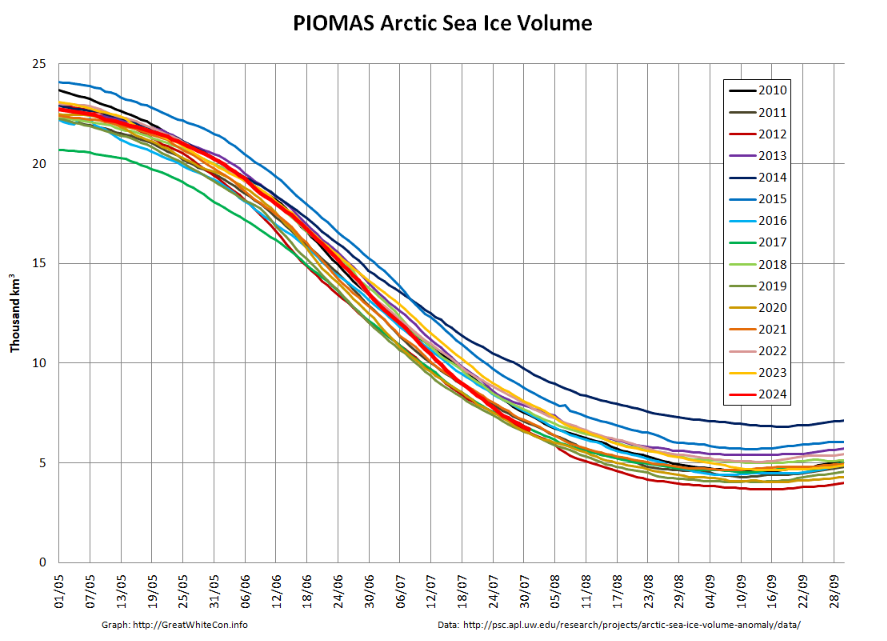
The associated volume graph reveals a modelled Arctic sea ice volume of 6.69 thousand km³ on July 31st, which is 5th lowest for the date:
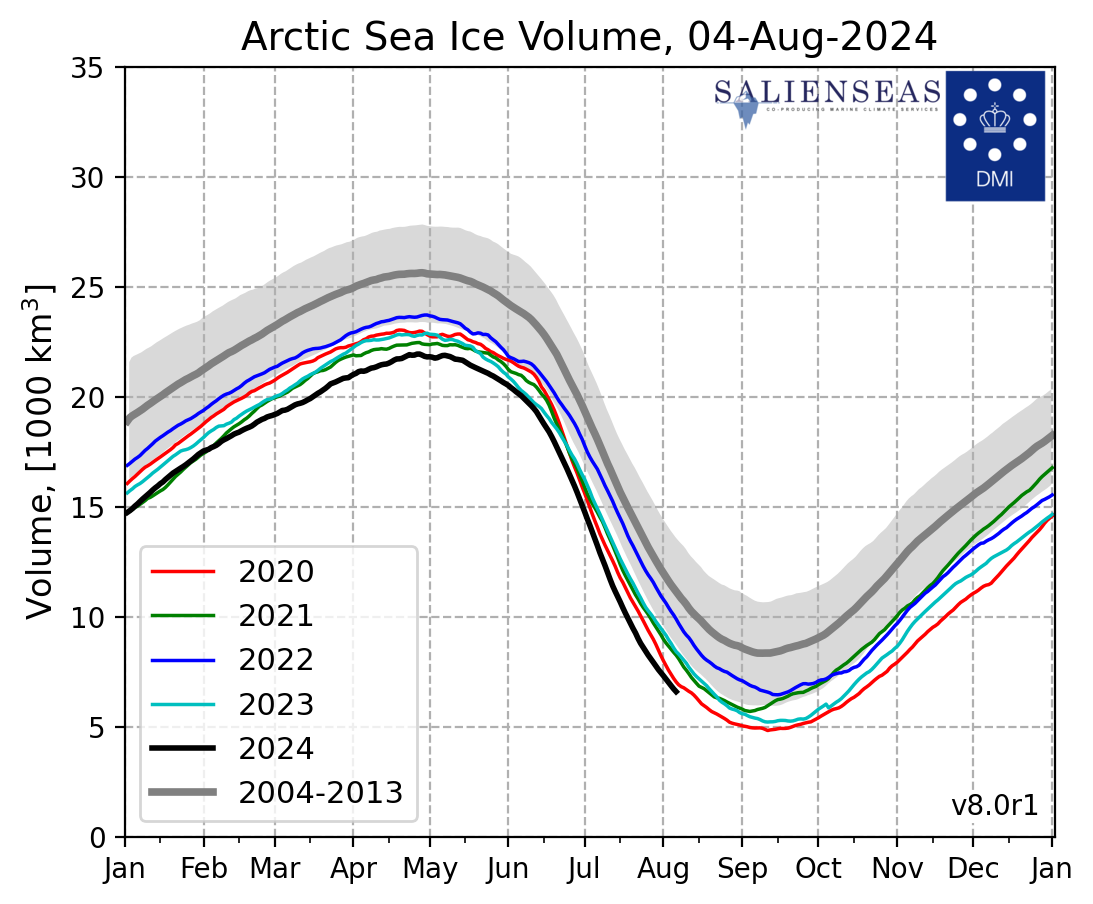
The DMI equivalent continues to show 2024 volume lower than all previous years:
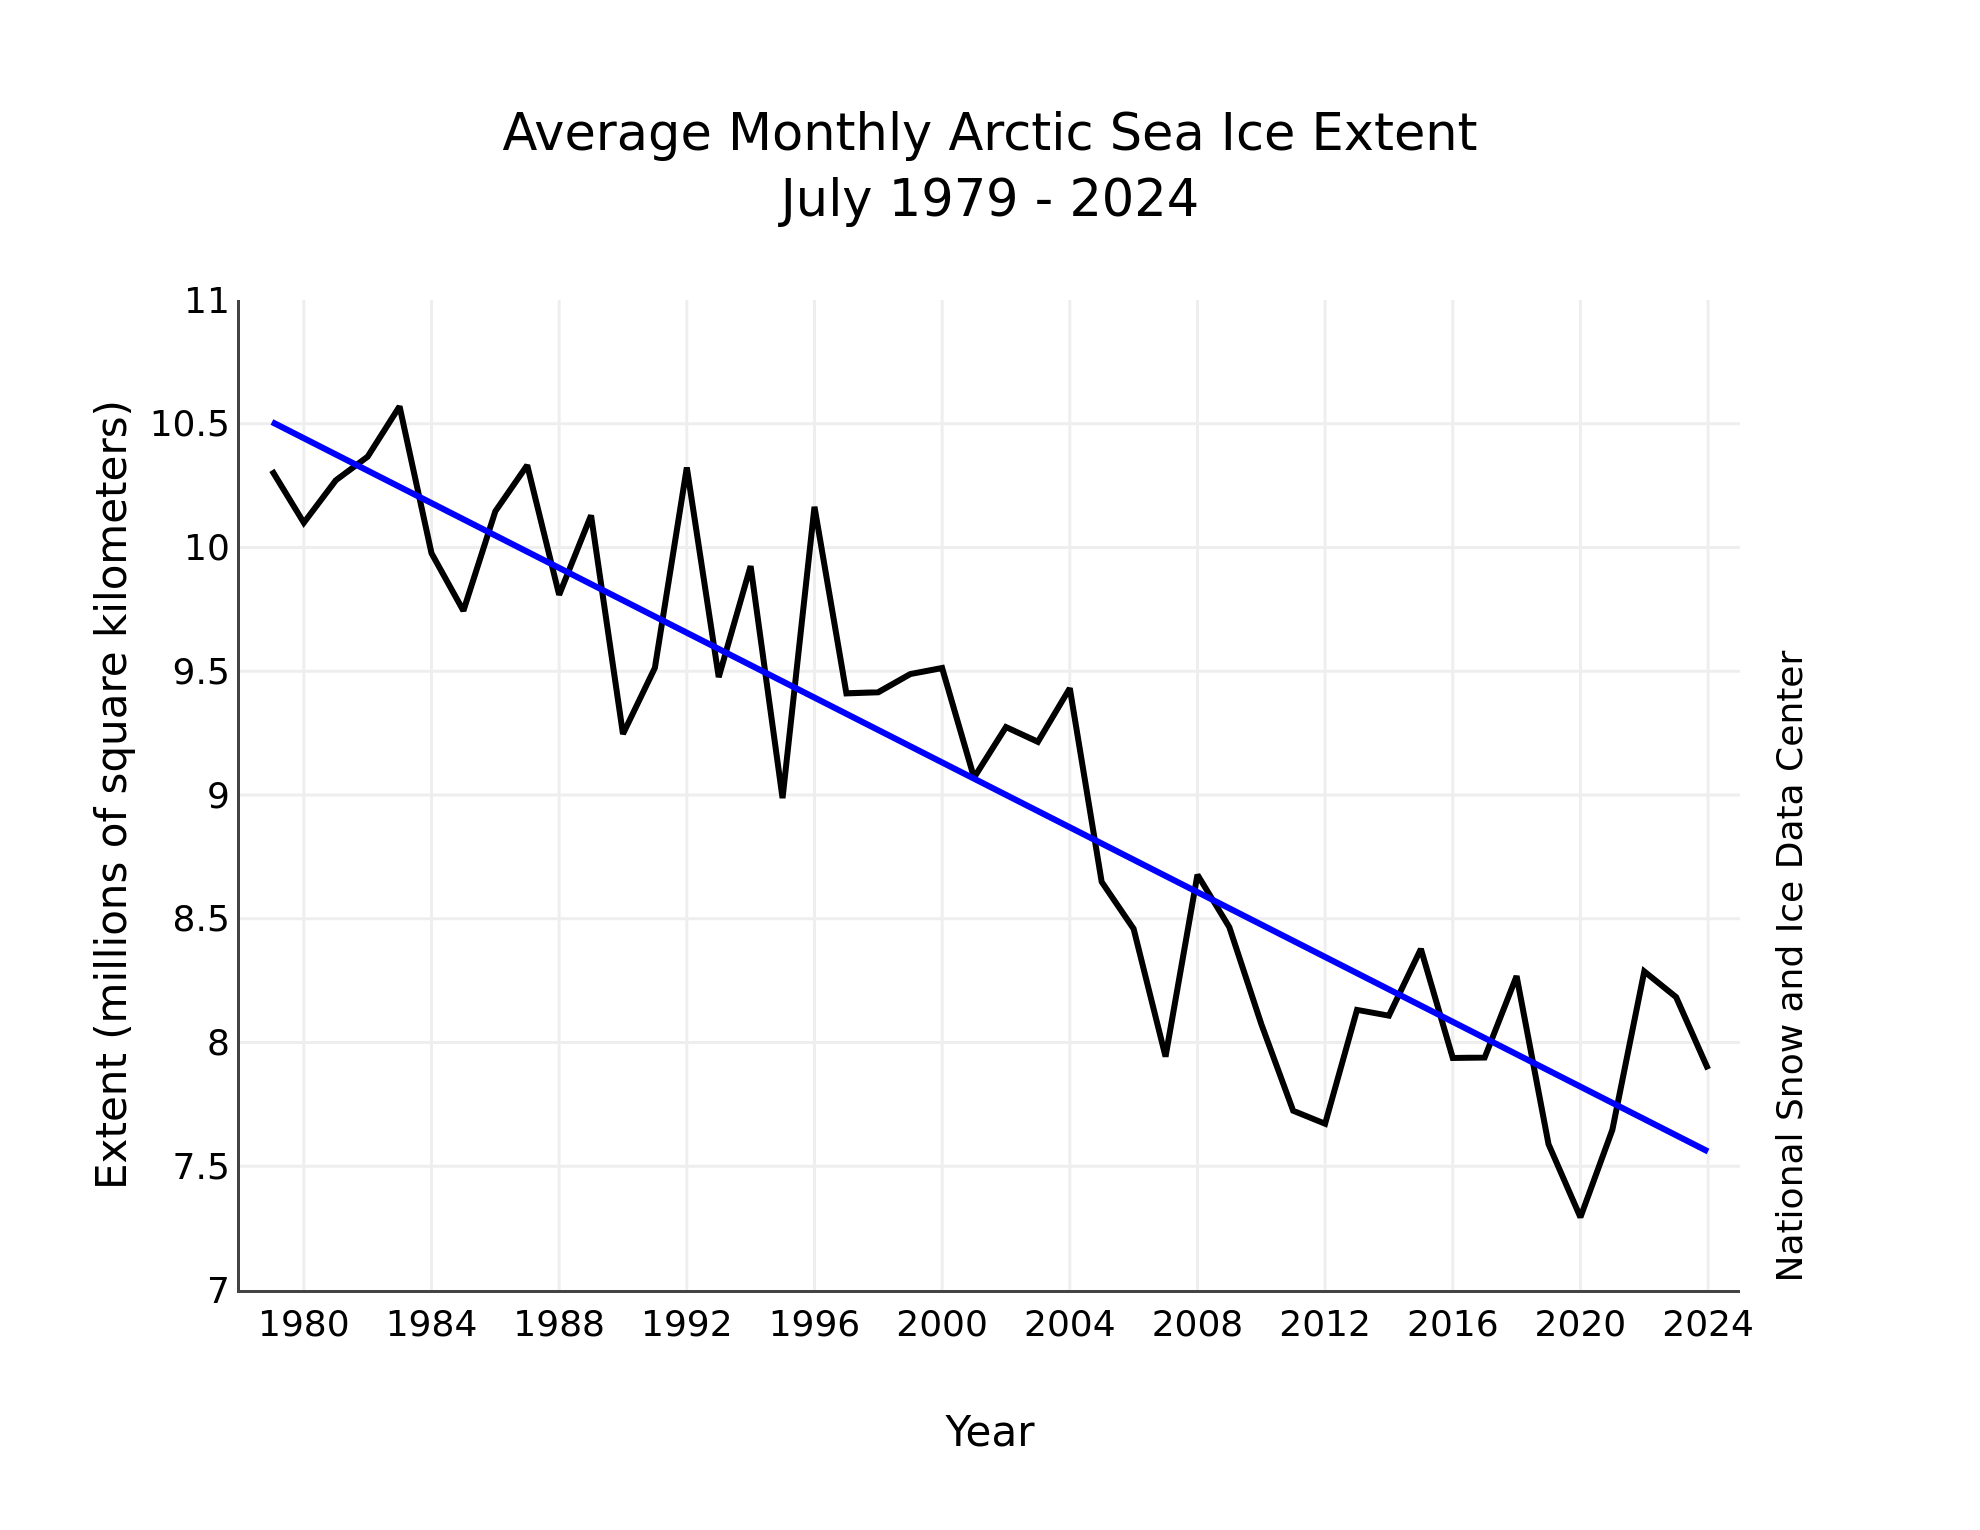
According to the July edition of the National Snow and Ice Data Center’s Arctic Sea Ice News:
Arctic sea ice extent averaged for July 2024 was 7.89 million square kilometers, the sixth lowest in the 46-year passive microwave satellite record. As of August 1, daily sea ice extent is third lowest behind 2019 and 2020, and just below 2012, the record low year…
Ice loss during the month was greatest in the Kara and East Siberian Seas, Baffin Bay, Hudson Bay, and the Canadian Archipelago. Extensive low-concentration areas of sea ice are found in the Beaufort and East Siberian Seas. A small patch of ice remains in western Hudson Bay, unusual for this time of year. There is still sea ice in both the northern and southern Northwest Passage routes according to passive microwave satellite data. On the Siberian side, the unusually packed area of sea ice south of Wrangel Island remains.:
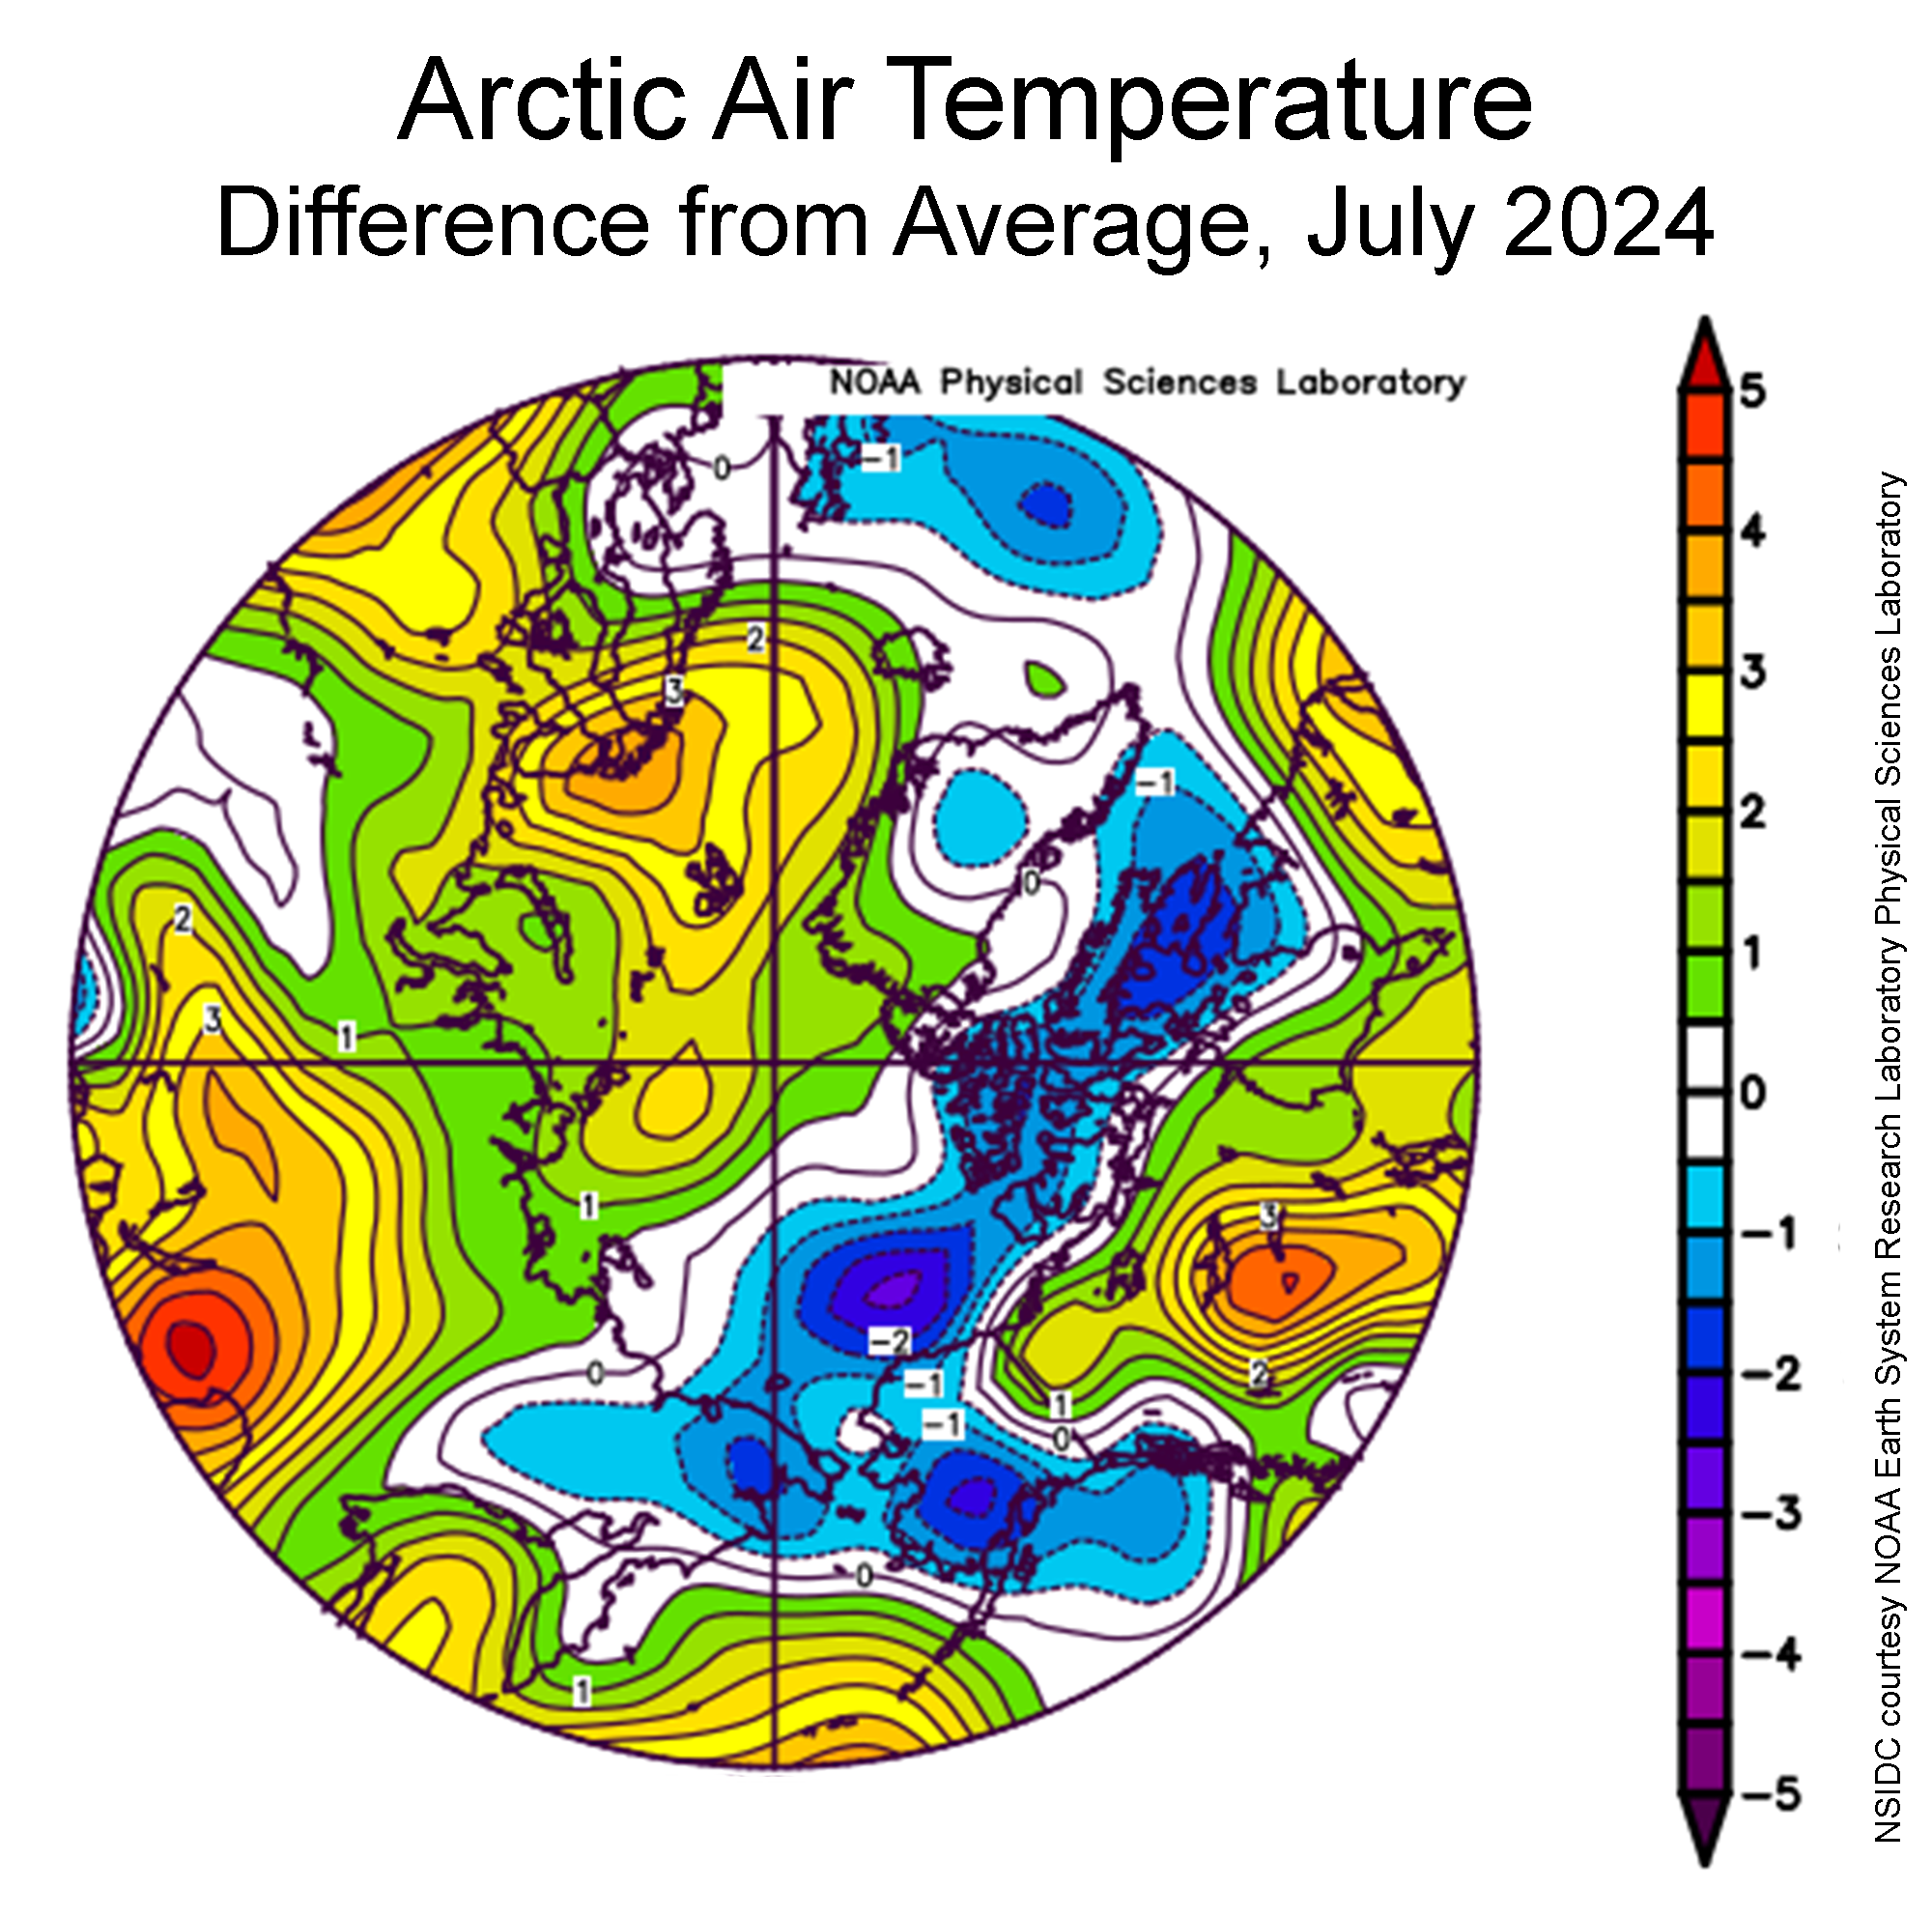
Air temperatures at the 925 hPa level (approximately 2,500 feet above the surface) were near average overall, with several areas slightly below average. Relatively warm conditions prevailed over the Barents Sea with temperatures 2 to 3 degrees Celsius above average. In the Kara Sea, temperatures were only 1 degree Celsius above average. Below average temperatures persisted in a wide swath extending from the East Siberian Sea, over the Beaufort Sea, and onto the Canadian Archipelago and northern Labrador with temperatures 2 degrees Celsius below average:
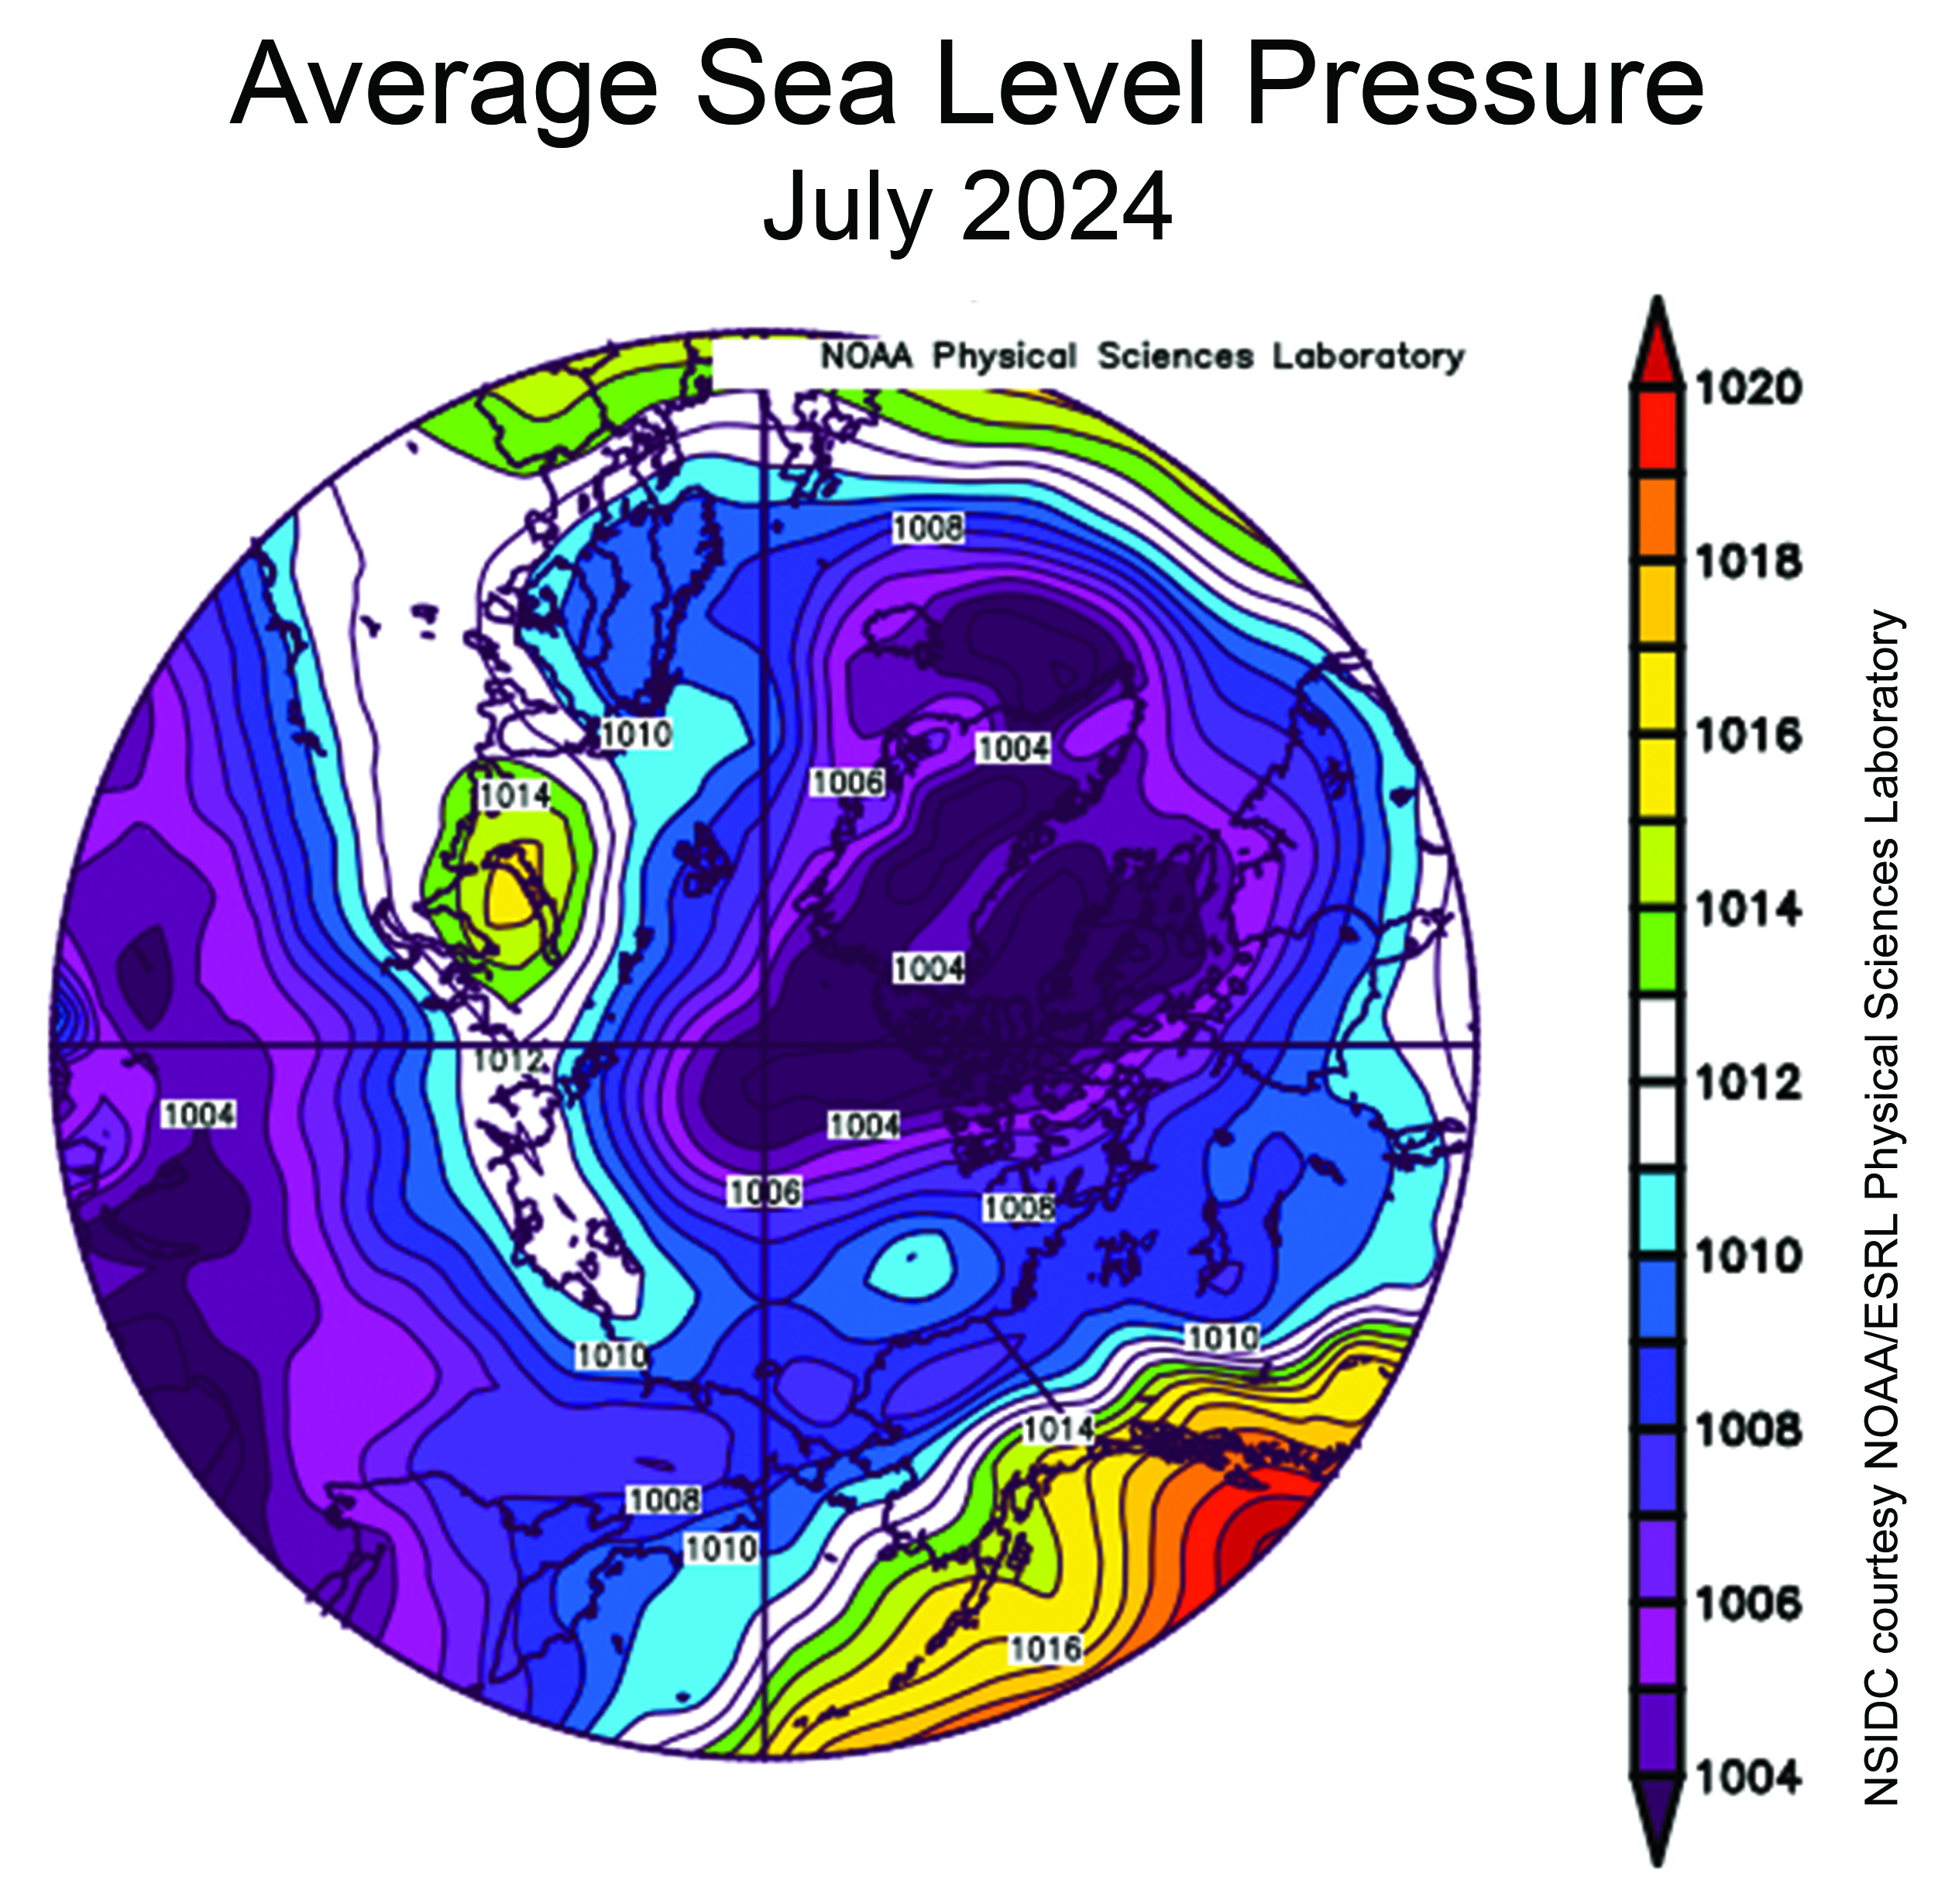
July featured a large area of low sea level pressure centered over Greenland and the Canadian Archipelago, but covering much of the Arctic Ocean:
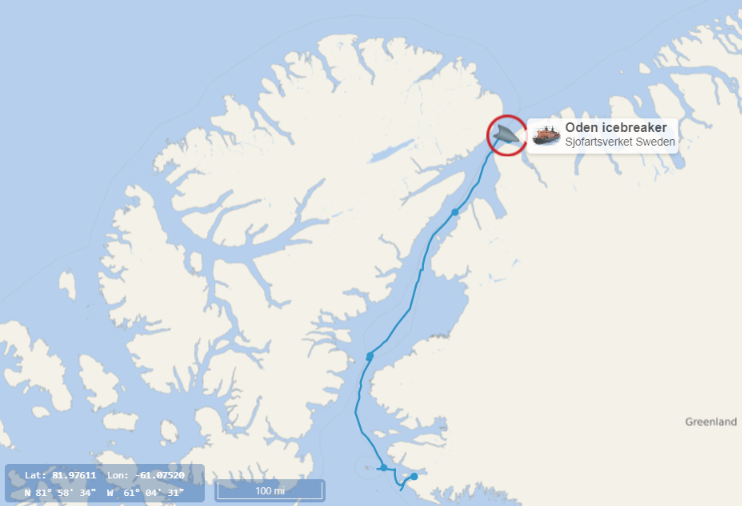
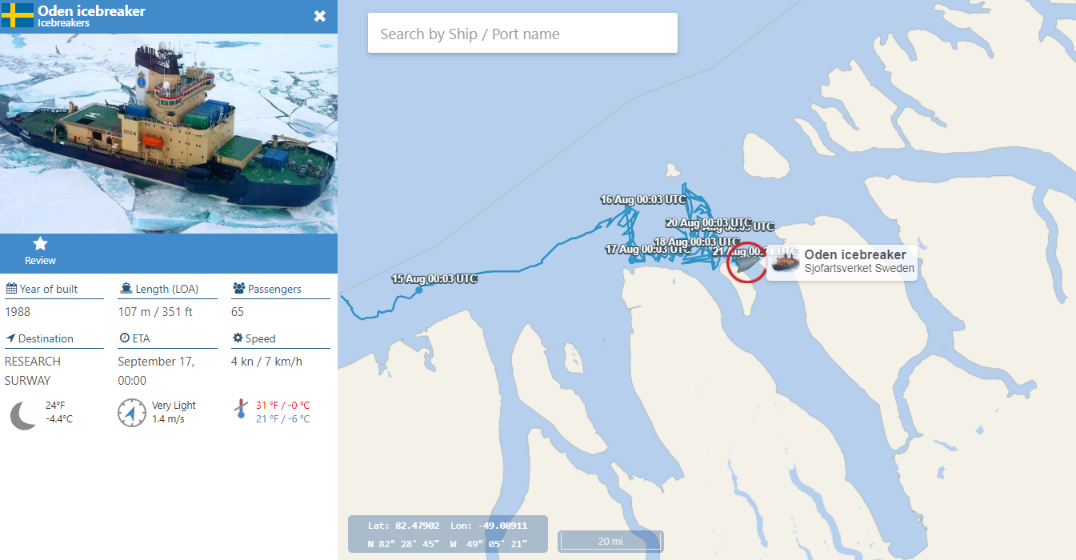
The Swedish icebreaker Oden is currently at the northern entrance to the Nares Strait, en route to Sherard Osborn and Victoria Fjords as part of the Swedish Polar Research Secretariat’s “North of Greenland” expedition:
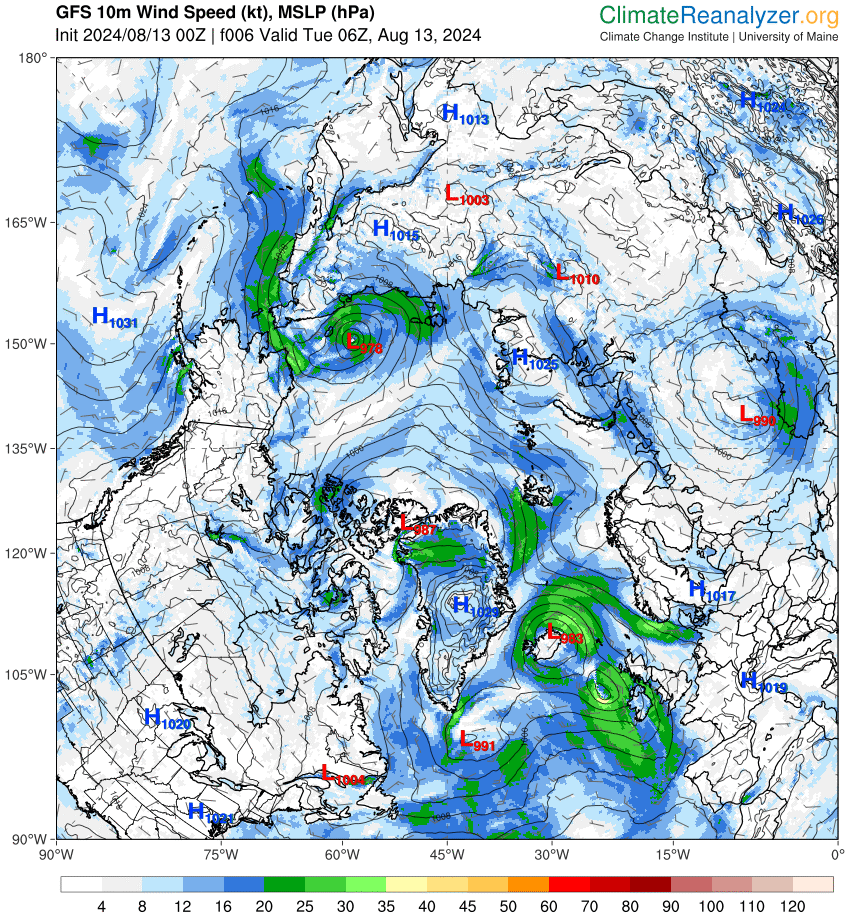
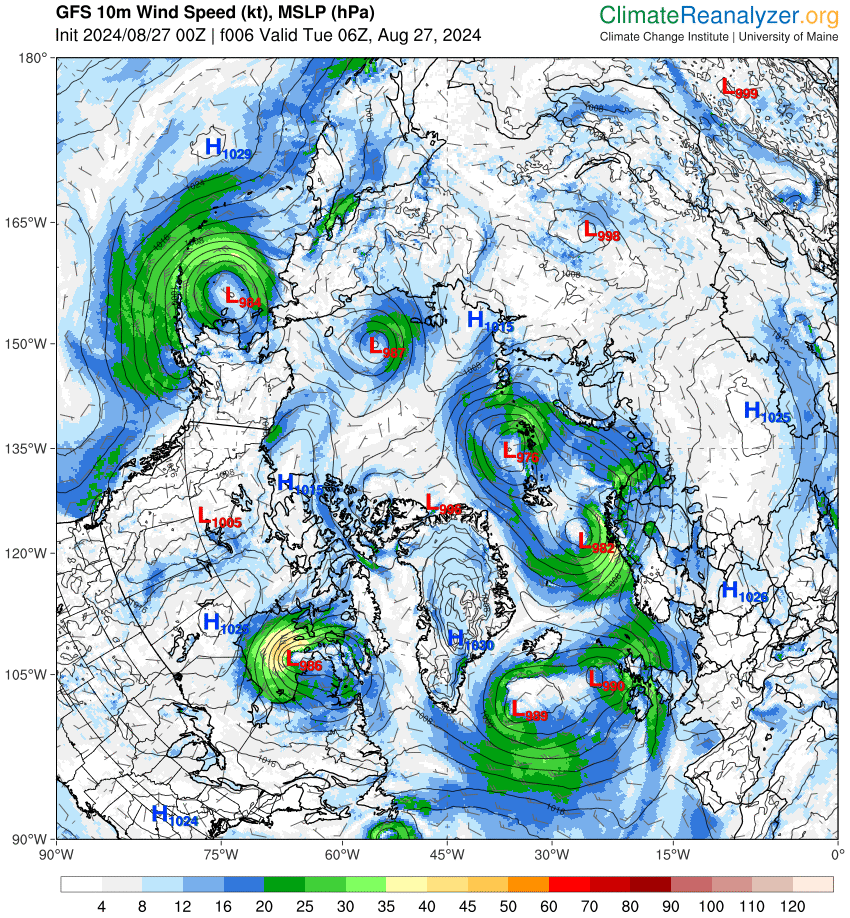
The current GFS forecast predicts that a cyclone with a central MSLP of 980 hPa will have formed over the Siberian side of the central Arctic by Tuesday morning. That will potentially stir up the persistent ice remaining in the Chukchi Sea:
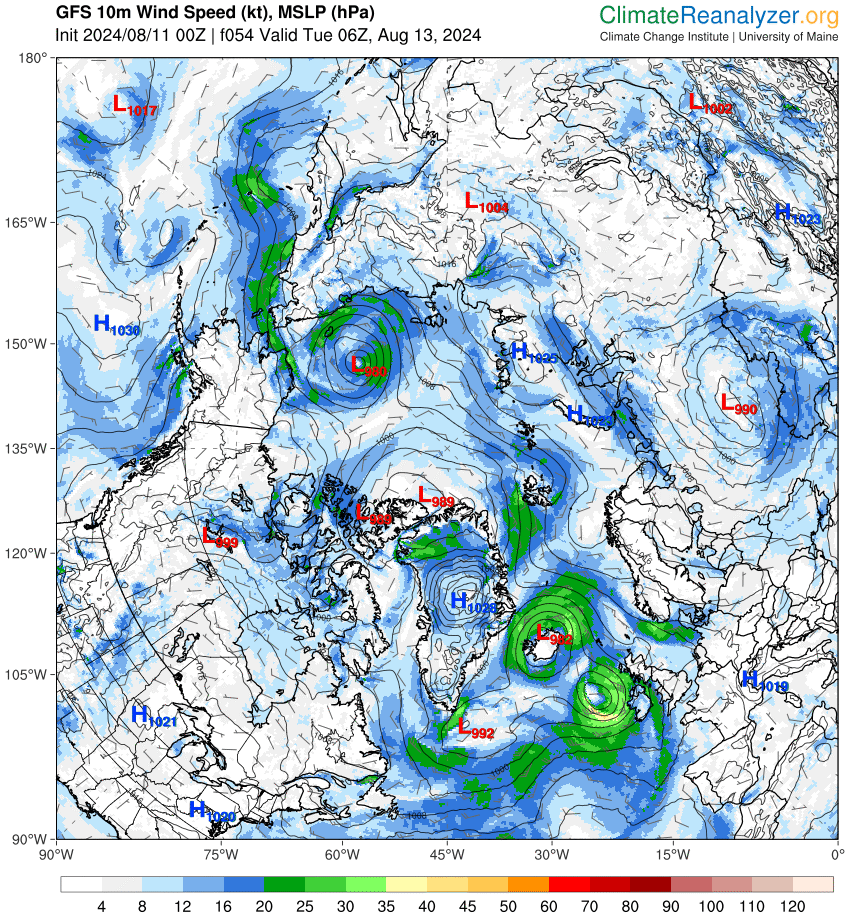
According to Environment Canada the storm’s central mean sea level pressure was down to 984 hPa at 06:00 UTC this morning:
However, GFS forecasts a sub 980 hPa MSLP:
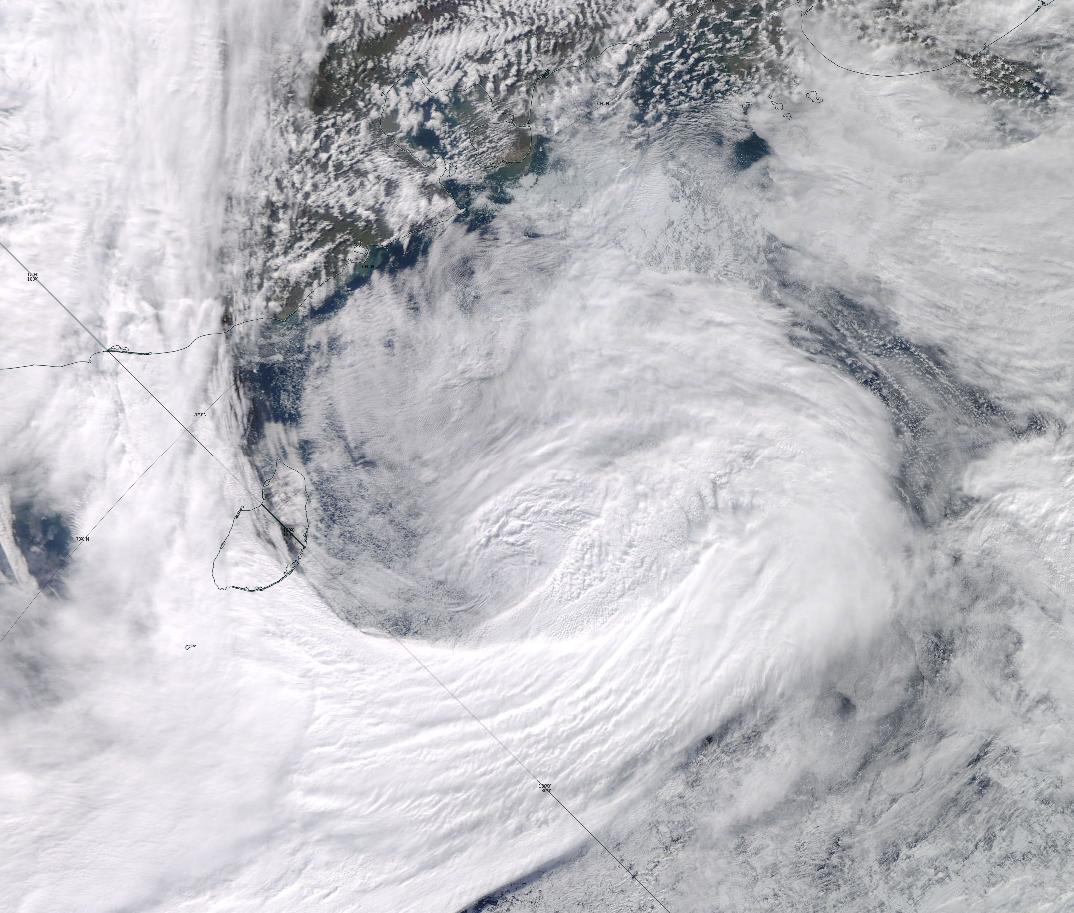
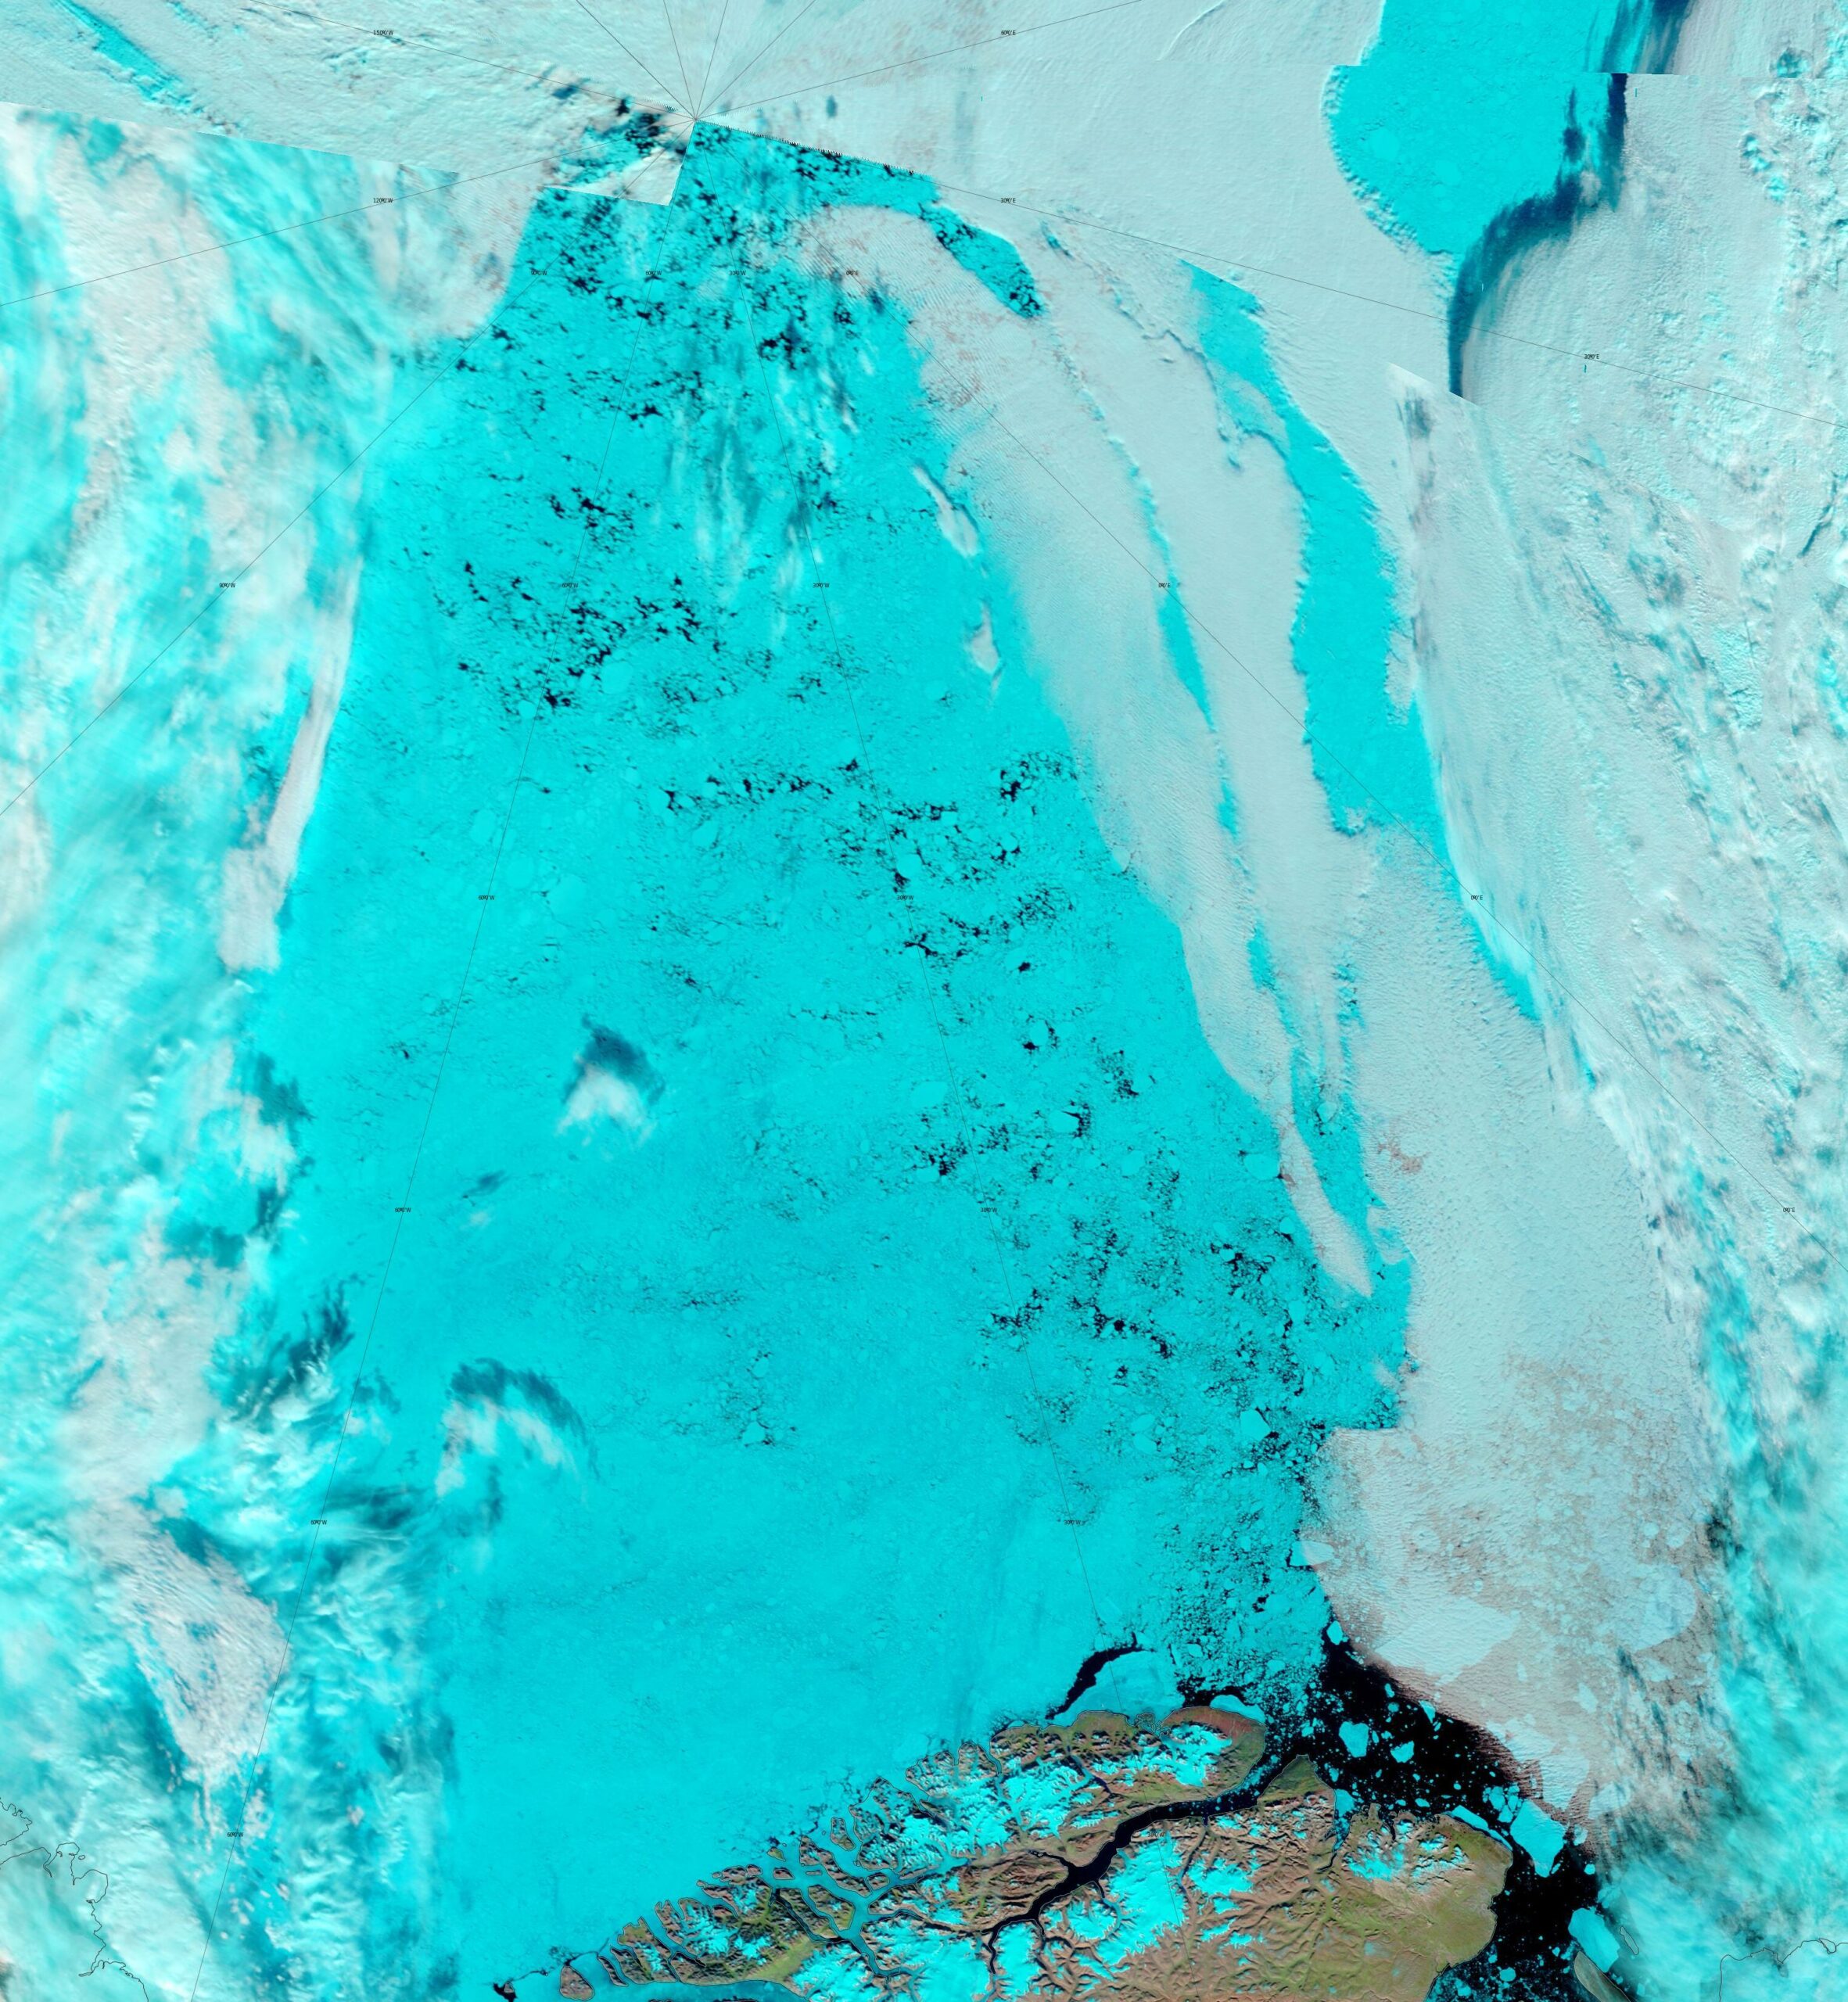
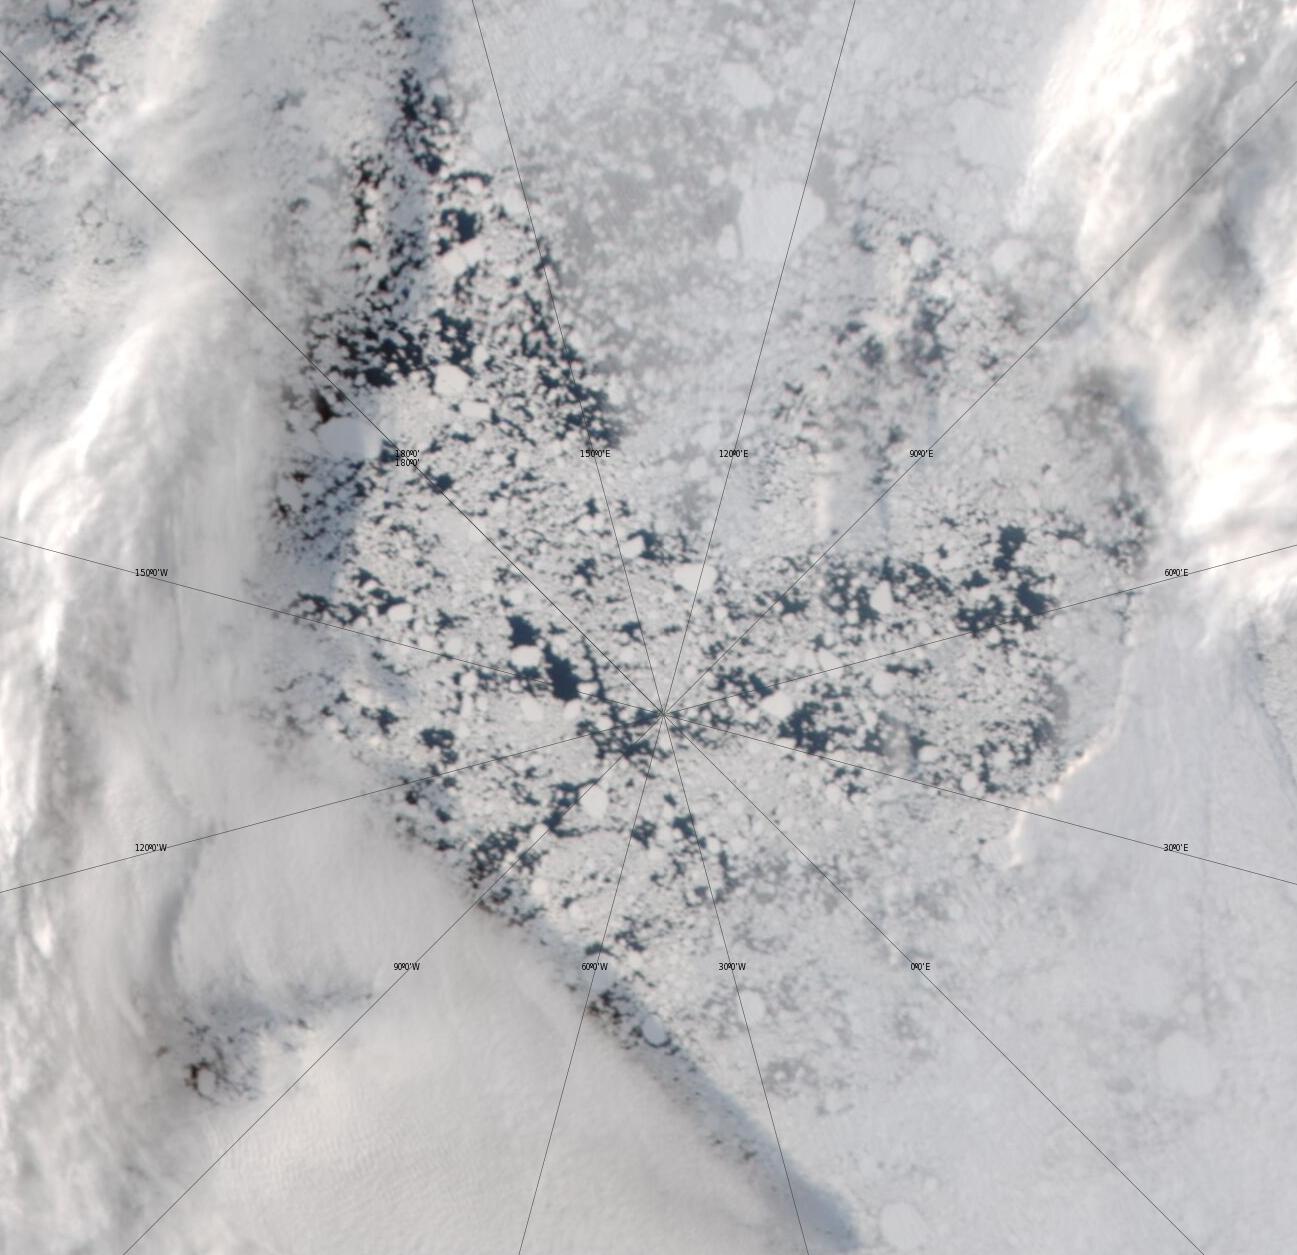
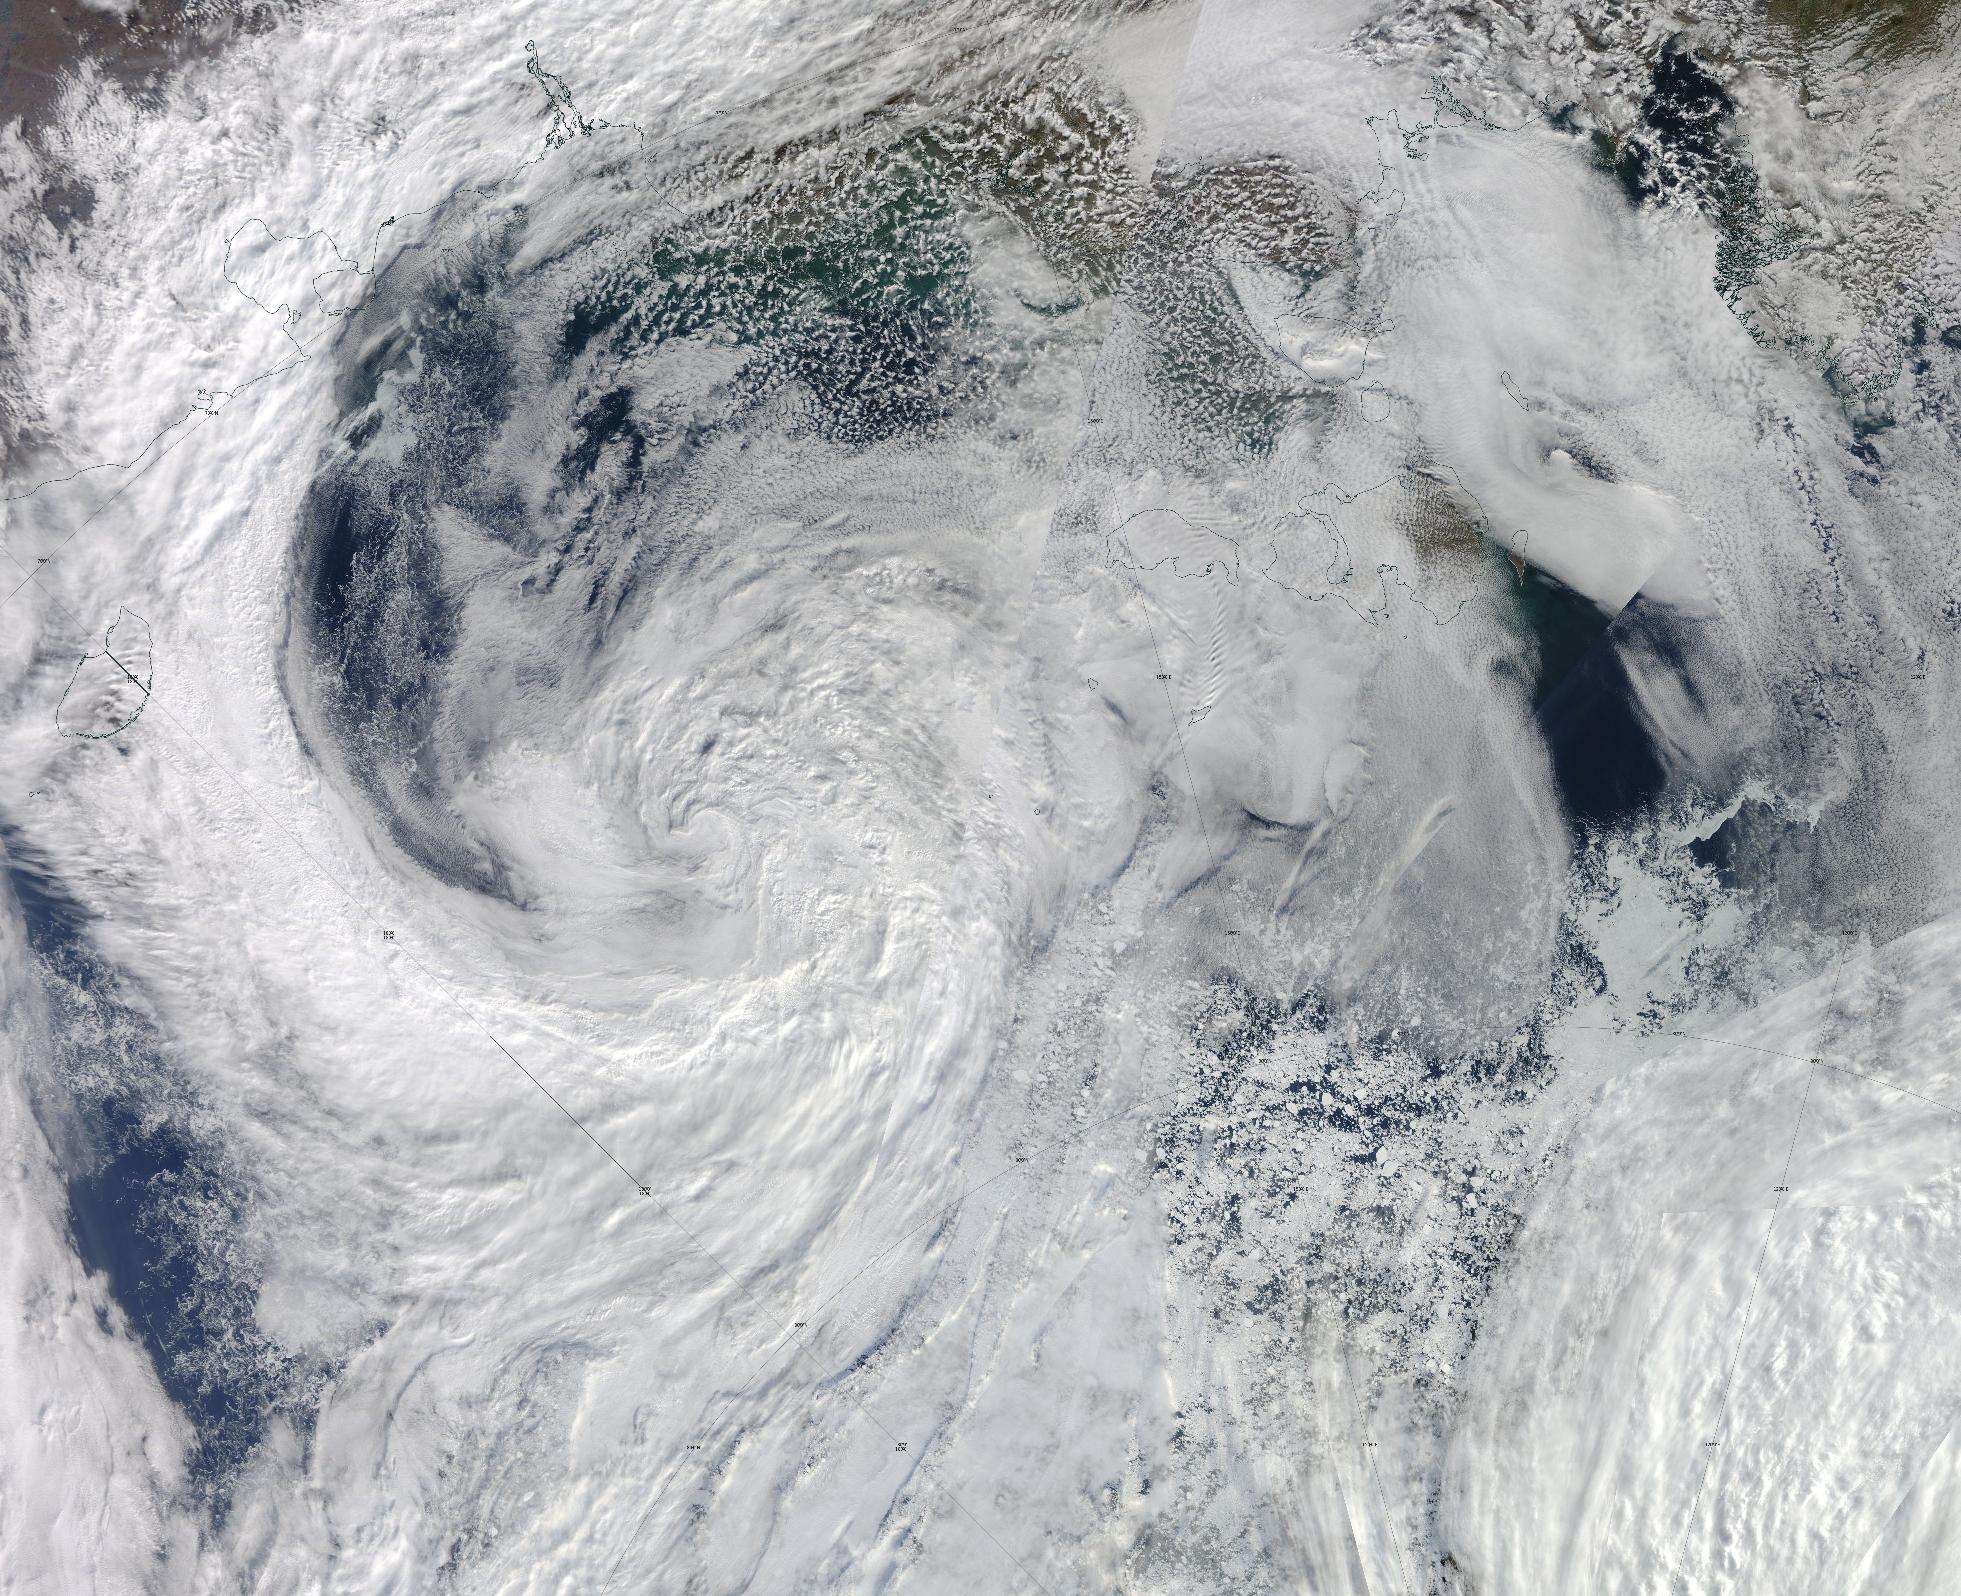
The clouds have parted to offer a glimpse of plenty of open water between the North Pold and Greenland:
According to Environment Canada the latest Arctic cyclone’s central mean sea level pressure reached 978 hPa at 12:00 UTC today:
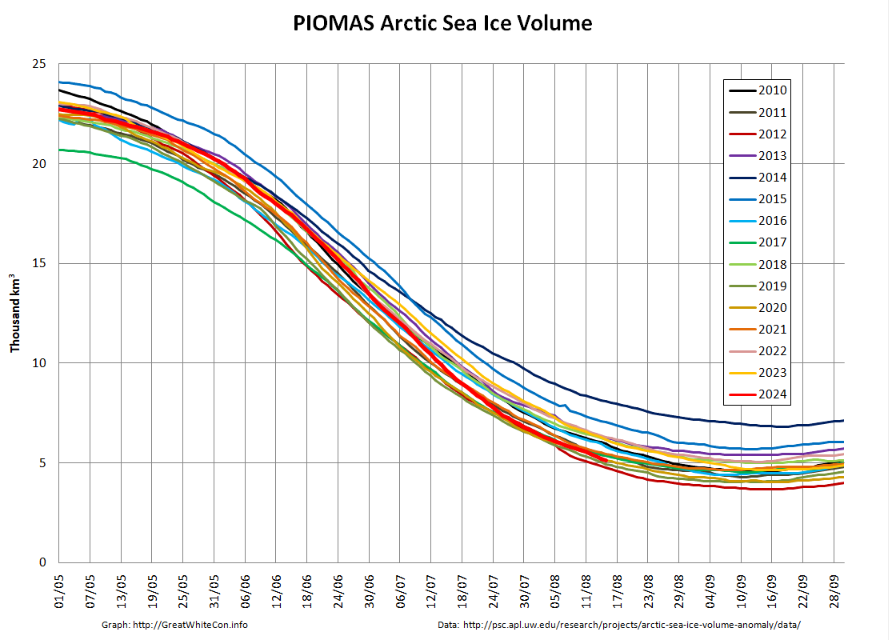
The PIOMAS mid August volume graph reveals a modelled Arctic sea ice volume of 5.12 thousand km³ on August 15th, which is 3rd lowest for the date:
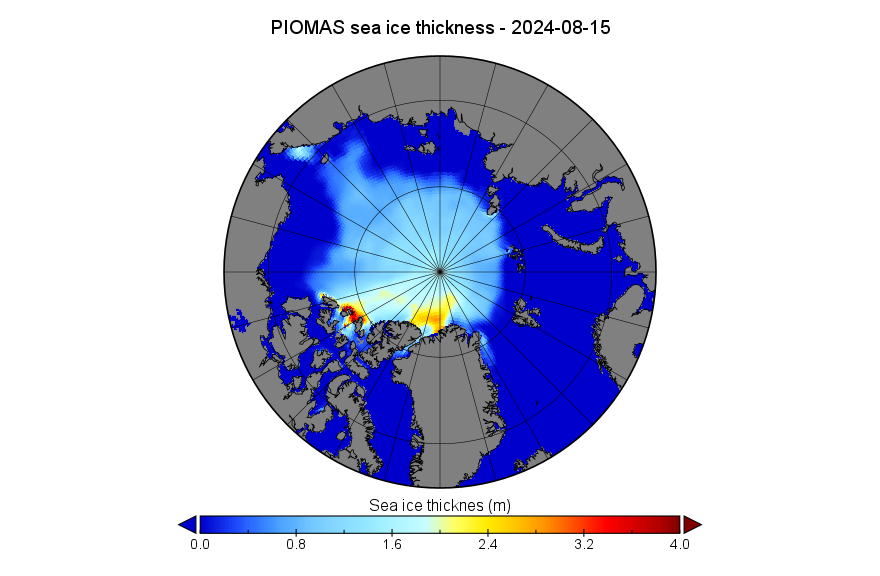
The PIOMAS gridded thickness map shows some 3-4 meter thick ice remaining north of the Canadian Arctic Archipelago:
However AMSR2 data reveals that the thick fast ice is now breaking up and drifting southwards through the archipelago:
Here’s a closer look at the break up of the sea ice around the North Pole:
Oden has entered Victoria Fjord:
En route they spotted a pod of around 50 narwhal near Ryder Fjord:
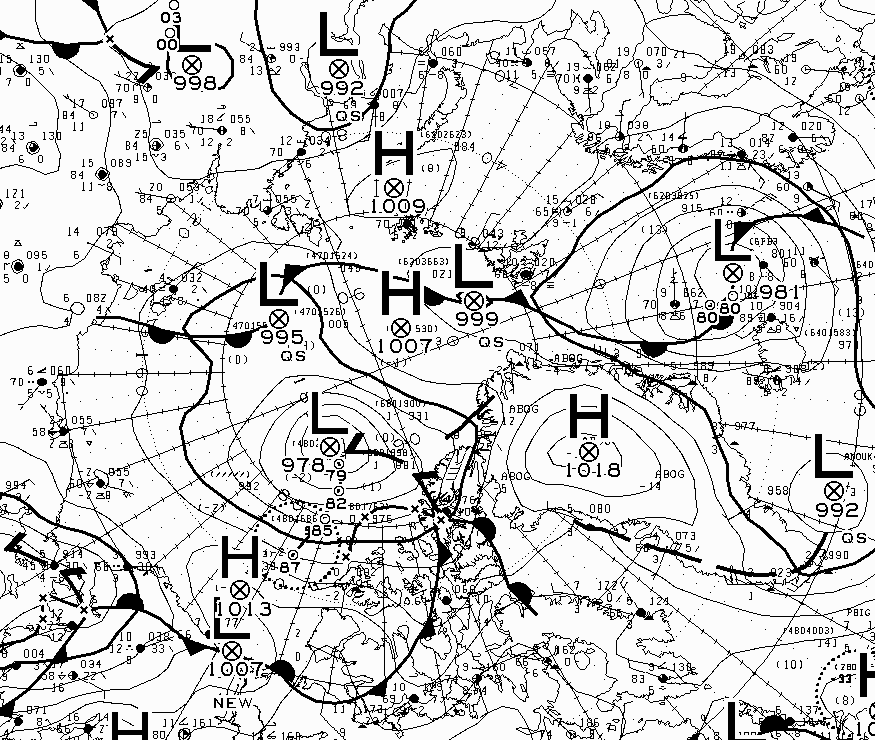
There are currently two storms in the central Arctic:
One with a MSLP of 976 hPa north of Franz Josef Land, and this one over the East Siberian Sea with an MSLP of 987 hPa:
Perhaps as a consequence of the series of cyclones, the arm of sea ice in the East Siberian Sea is rapidly disappearing:
As Tom points out below, JAXA extent is now 3rd lowest for the date in the satellite era:
The conversation continues on the September open thread.
There’s a fair bit of stormyness in the forecast, and a warm blast for the Atlantic side. The melting season might have one more card up it’s sleeve!
It might even have a few aces hidden away?
It’s like eerily quiet around all the forums!
Panic!..?
It’s hard to point out much exceptional about this year, except its still keeping up with some of the worst years for the Arctic.
For example we’ve just crossed below 5 million JAXA extent one day later than 2020, which was a very bad year.
Perhaps everyone has gone on a summer holiday?
oh, yeh: it’s winter here lol!(Just gone spring yay, actually! The seasons turn quick actually! 26C yesterday in Perth!))
Meanwhile in in the Antarctic this years sea ice extent is quickly approaching the extent seen in 1986 and may very well exceed it this year…..
I note with some interest that there is still ice in western Hudson’s Bay with maybe three weeks until the overall Arctic low point. Is there even a remote possibility that we’ll see multi-year ice there this season?
This bit you mean?
My assessment is “extremely remote”!
With roughly three weeks to go, Hudson’s Bay ice still hanging in, but barely. Given likely slow regrowth, I don’t thing there’s much hope of multi-year…
There’s almost no ice left in Hudson Bay now:
JAXA extent has just dipped below 2019 this morning!
“Plummeted below 2019” more like!