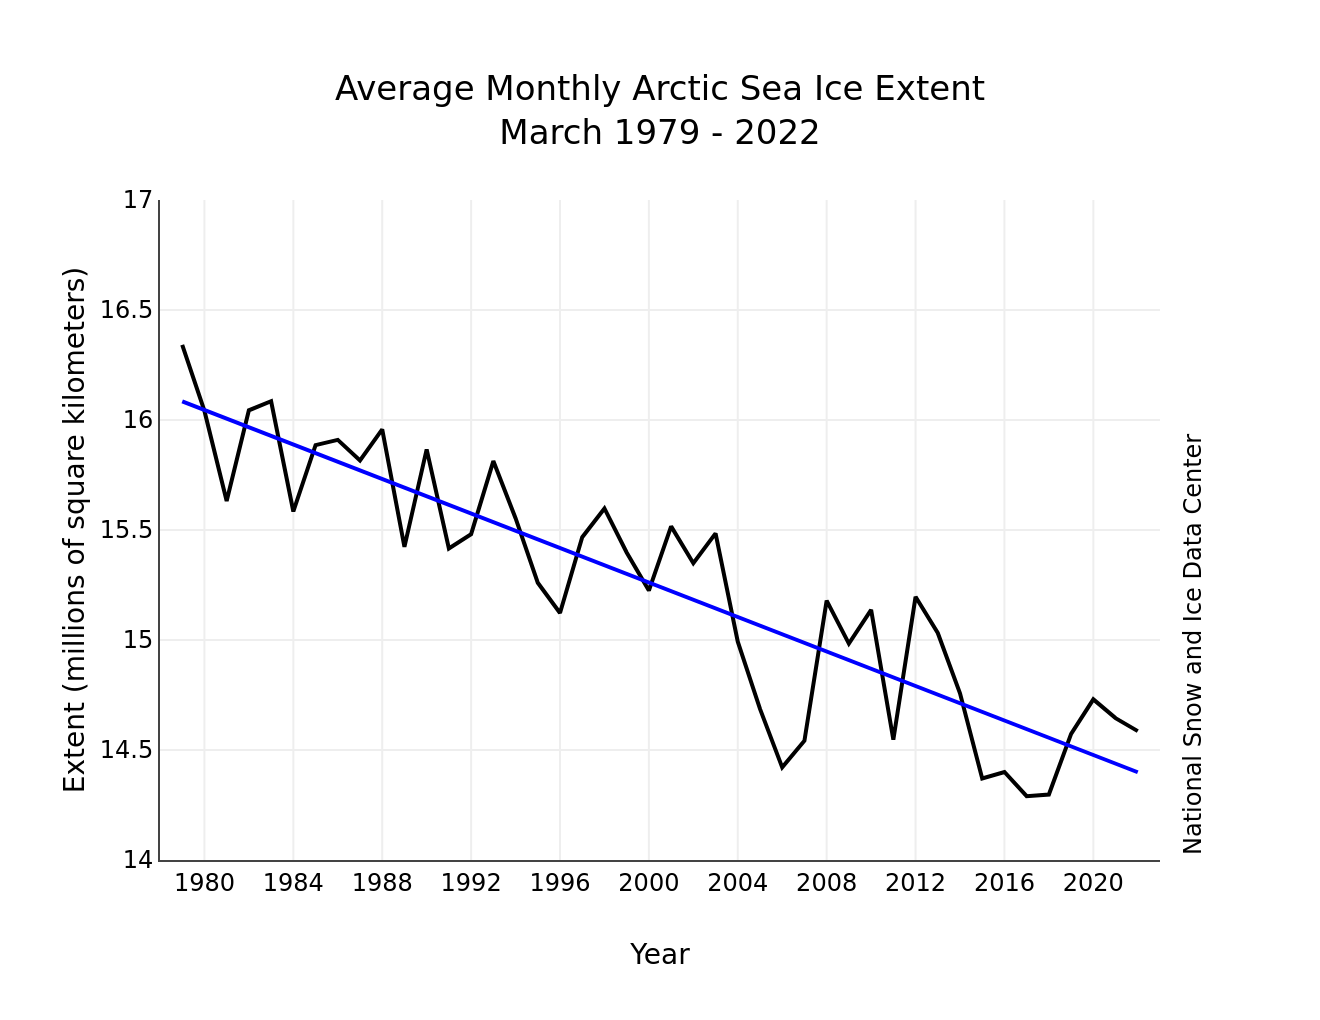
The April edition of the NSIDC’s Arctic Sea Ice News summarises March 2022 as follows:
Average Arctic sea ice extent for March 2022 was 14.59 million square kilometers (5.63 million square miles), ranking ninth lowest in the satellite record…
The total decline, after a series of small ups and downs, was only 250,000 square kilometers (96,500 square miles):
Counter to what might be expected given the very slow rate of sea ice loss over the month as a whole, air temperatures at the 925 millibar level (about 2,500 feet above the surface) were above average over all of the Arctic Ocean:
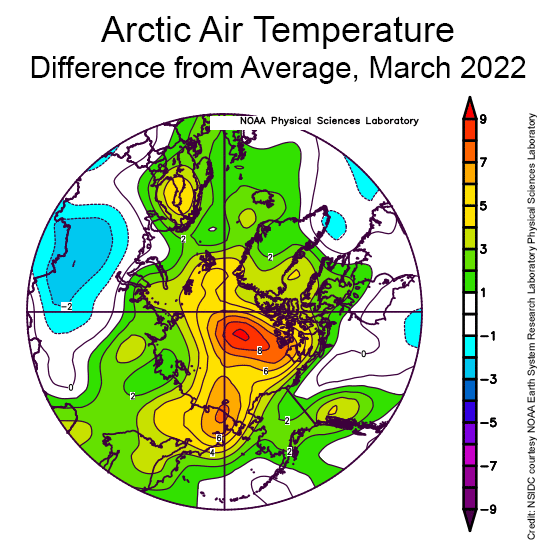
March temperatures were up to 9 degrees Celsius (16 degrees Fahrenheit) higher than average north of the Canadian Arctic Archipelago, up to 6 degrees Celsius (11 degrees Fahrenheit) above average in the East Siberian Sea, but up to 5 degrees Celsius (9 degrees Fahrenheit) above average over a wide area.
The key features of the sea level pressure pattern were high pressure (an anticyclone) over the central Arctic Ocean, a trough of low pressure extending into the Barents Sea, and an unusually high pressure over Northern Europe:
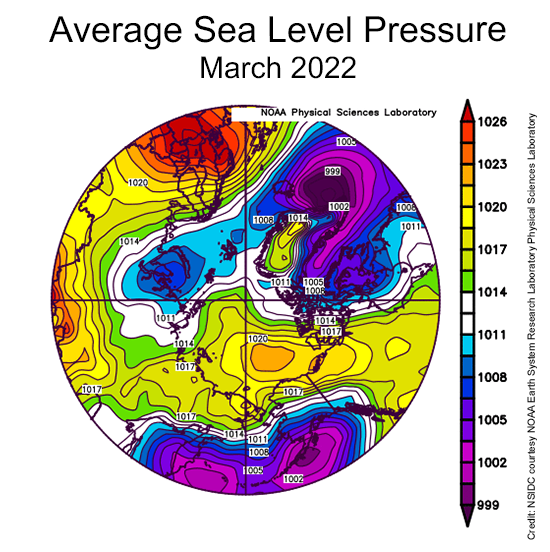
While having an anticyclone over the central Arctic Ocean is quite typical for this time of year, the combination of the high pressure over northern Europe and the pressure trough to the west led to a strong pressure gradient, leading to strong winds from south through the Norwegian and Barents Seas…
This can be tied to the extreme warm event over the Arctic Ocean seen in the middle of the month, associated with strong water vapor transport and the passage of several strong cyclones.
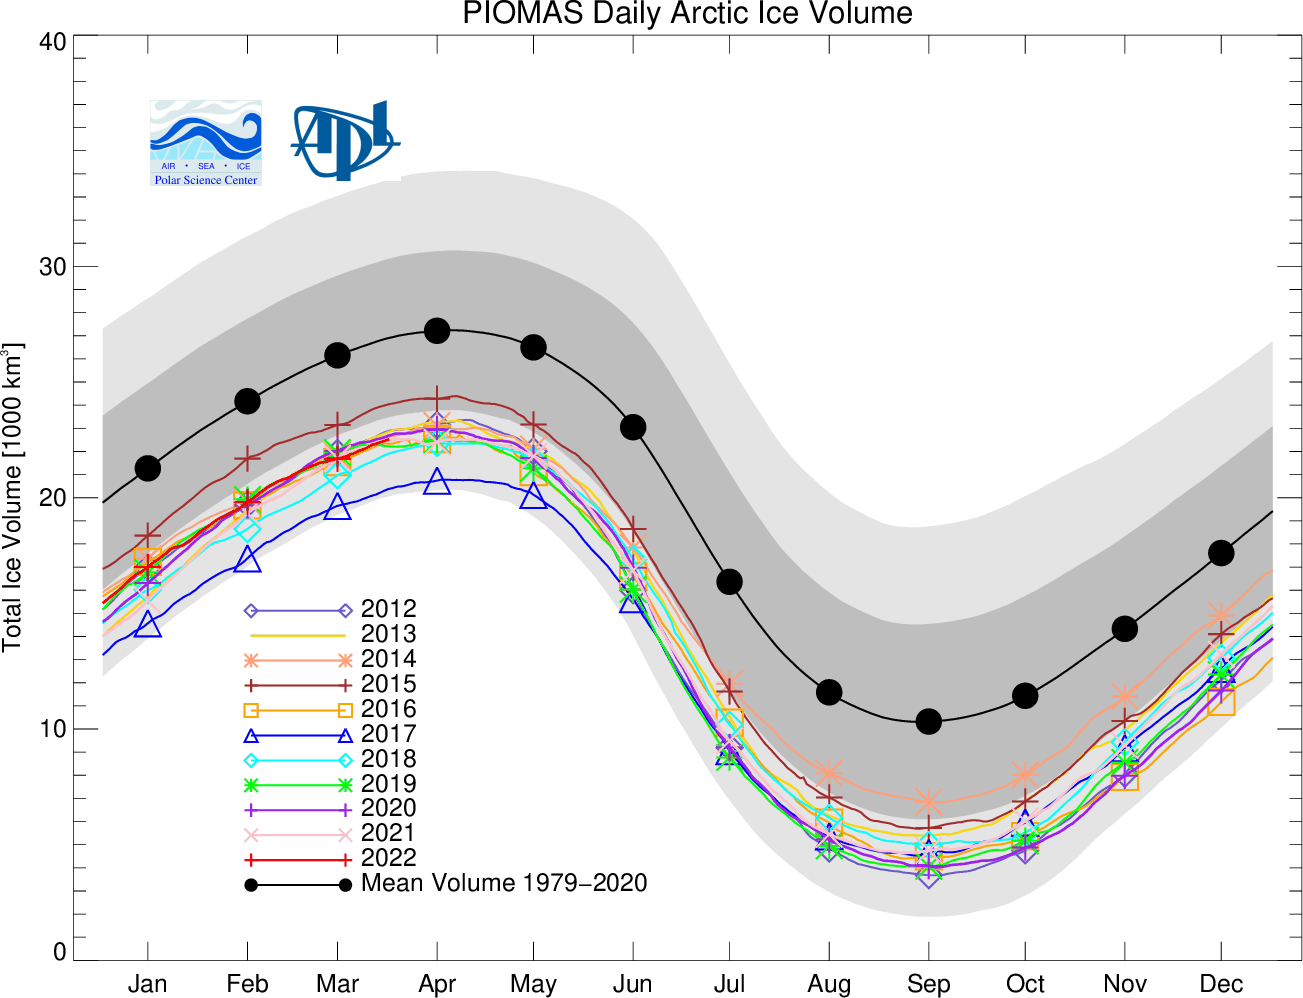
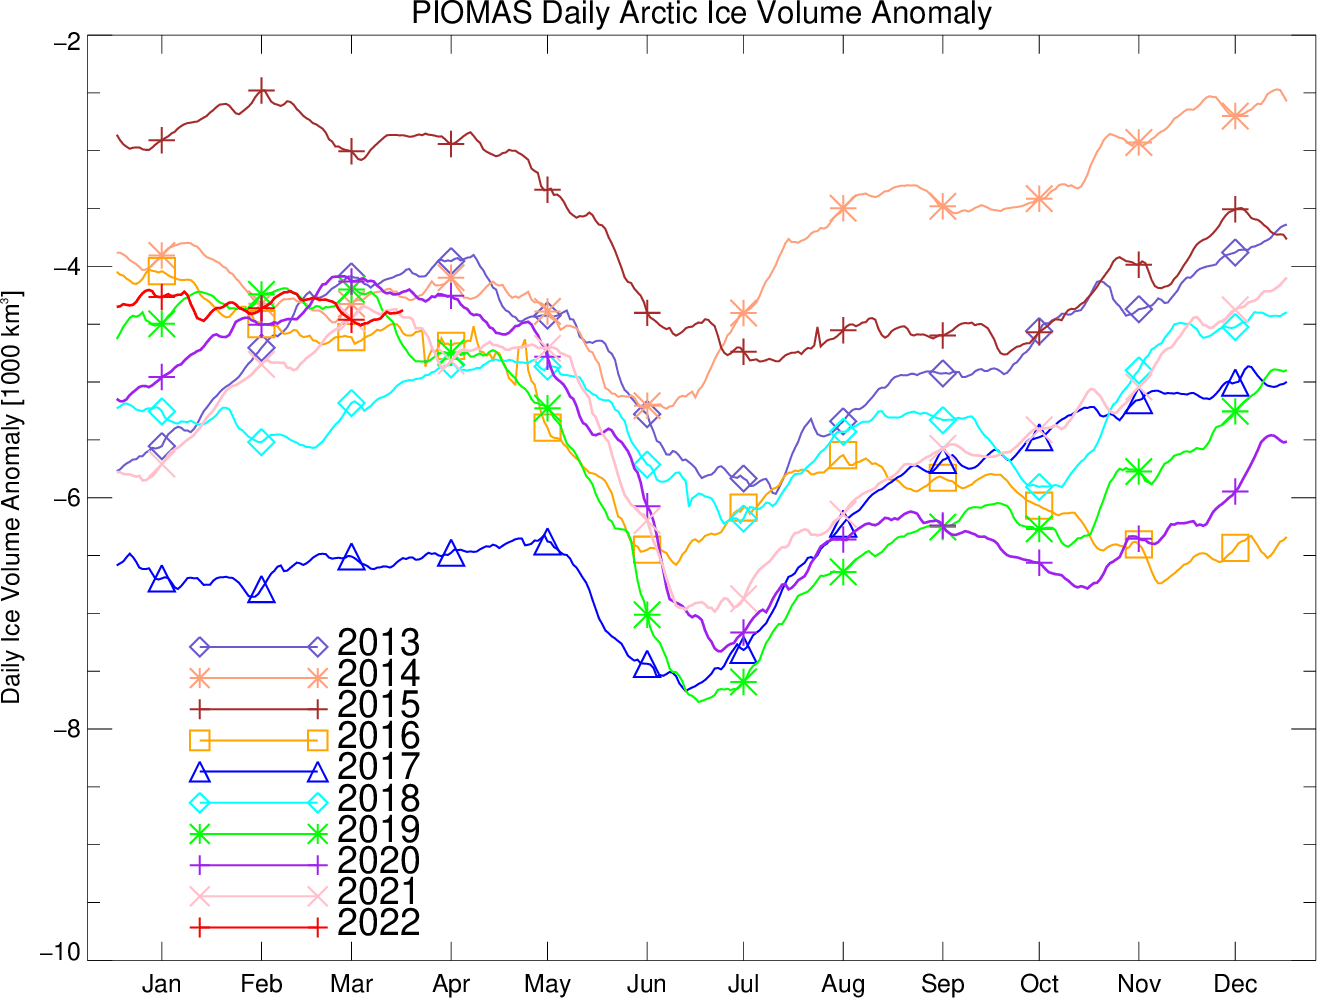
The Polar Science Center at the University of Washington has also released the PIOMAS volume data for March 2022:
Average Arctic sea ice volume in March 2022 was 21,700 km3. This value is the 6th lowest on record for March, about 2,200 km3 above the record set in 2017. Monthly ice volume was 38% below the maximum in 1979 and 25% below the mean value for 1979-2021:
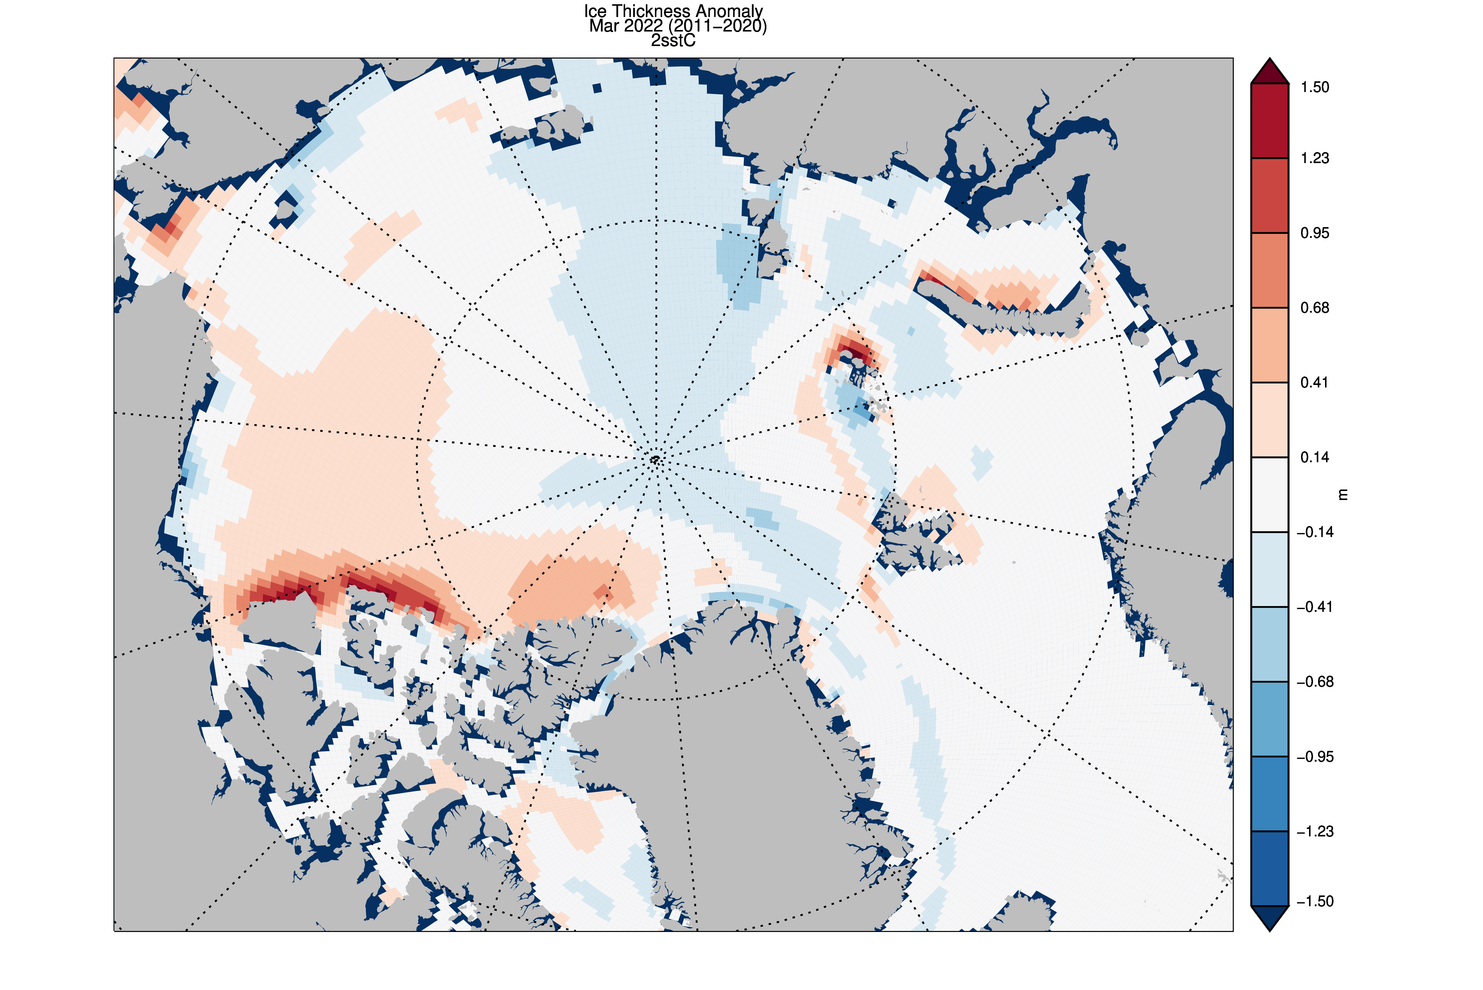
Ice growth anomalies for March 2022 continued to be at the upper end of the most recent decade with a mean ice thickness (above 15 cm thickness) at the middle of recent values:
The ice thickness anomaly map for March 2022 relative to 2011-2020 divides the Arctic in two halves with positive anomalies in the “Western Arctic” but negative anomalies in “Eastern Arctic”. A narrow band of negative anomalies remains along the coast of North of Greenland but positive anomaly exists north of Baffin Island.
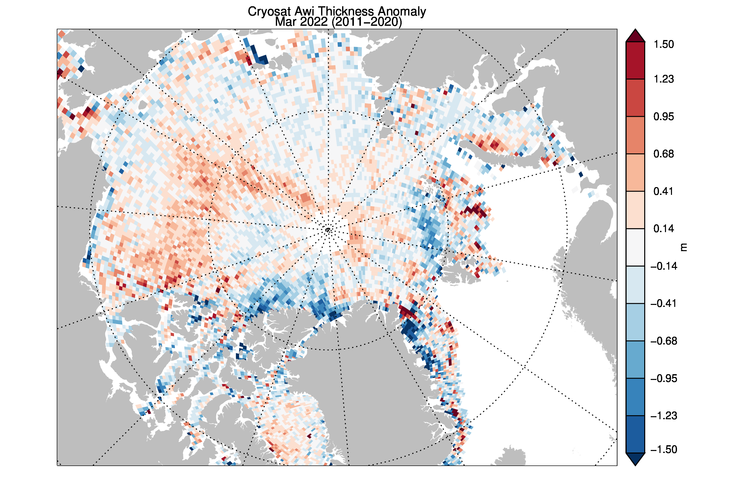
CryoSat 2 ice thickness shows an similar pattern of sea ice thickness anomalies though the areas North of Greenland and Baffin Bay show substantial differences:
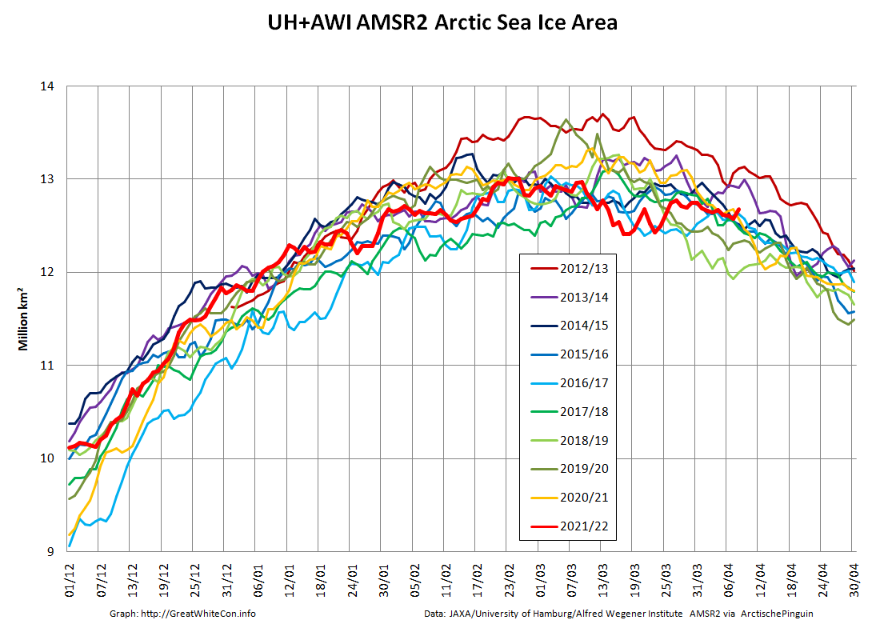
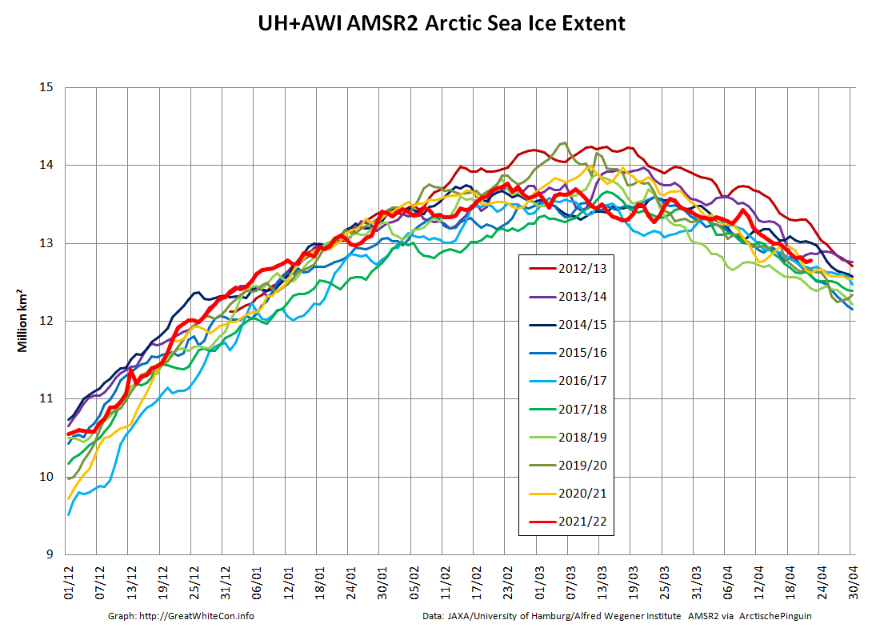
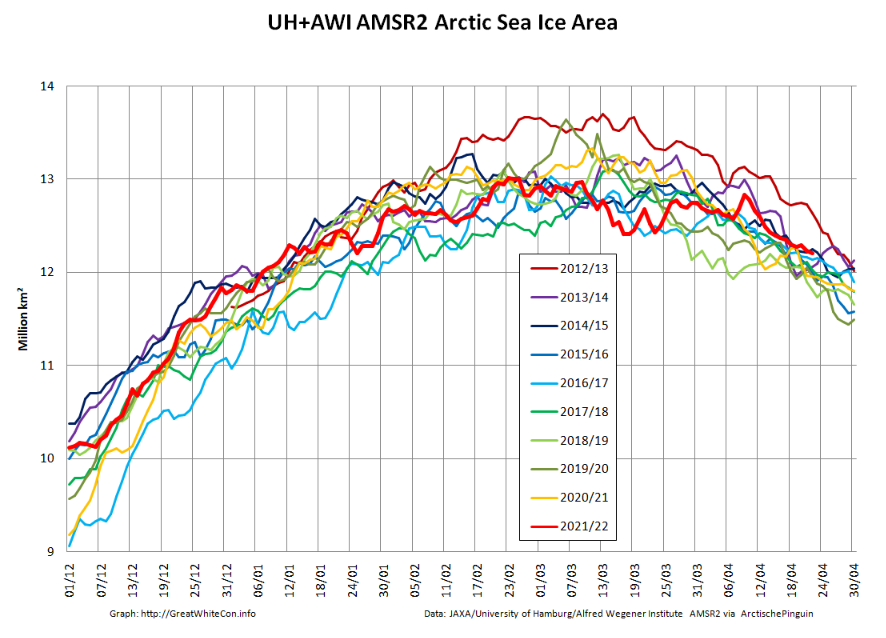
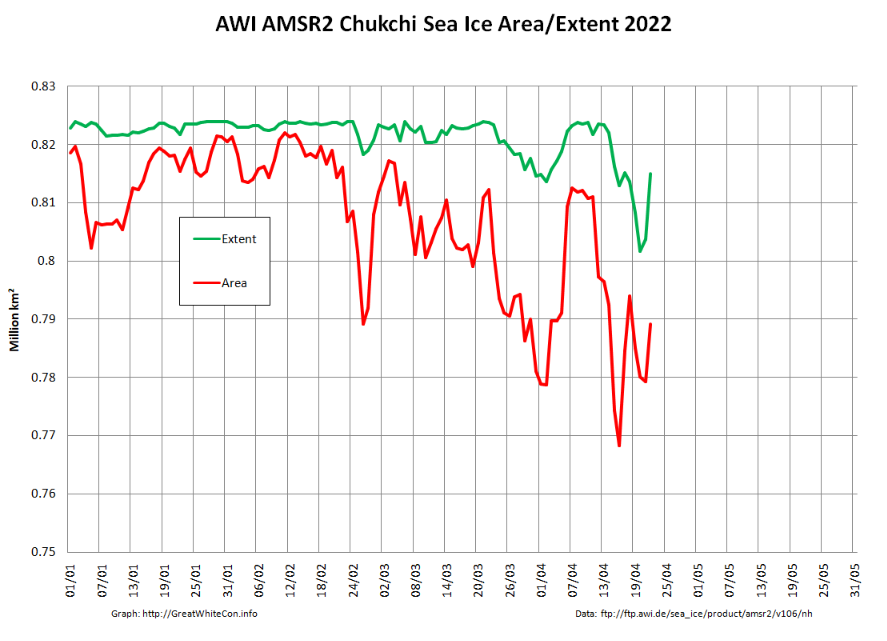
Here are the latest graphs of our favourite “high resolution” AMSR2 metrics, which combine recent data from the Alfred Wegener Institute with historical data from the University of Hamburg:
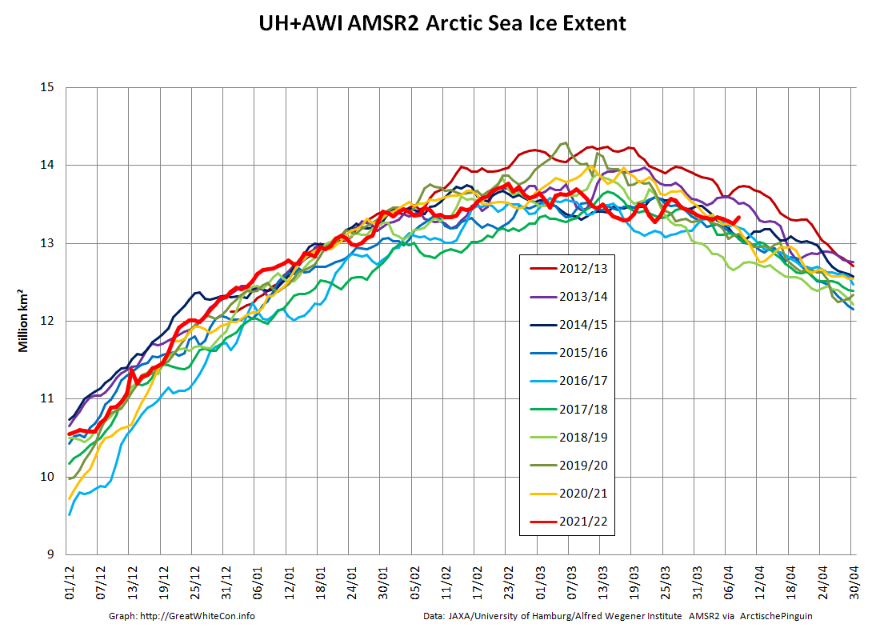
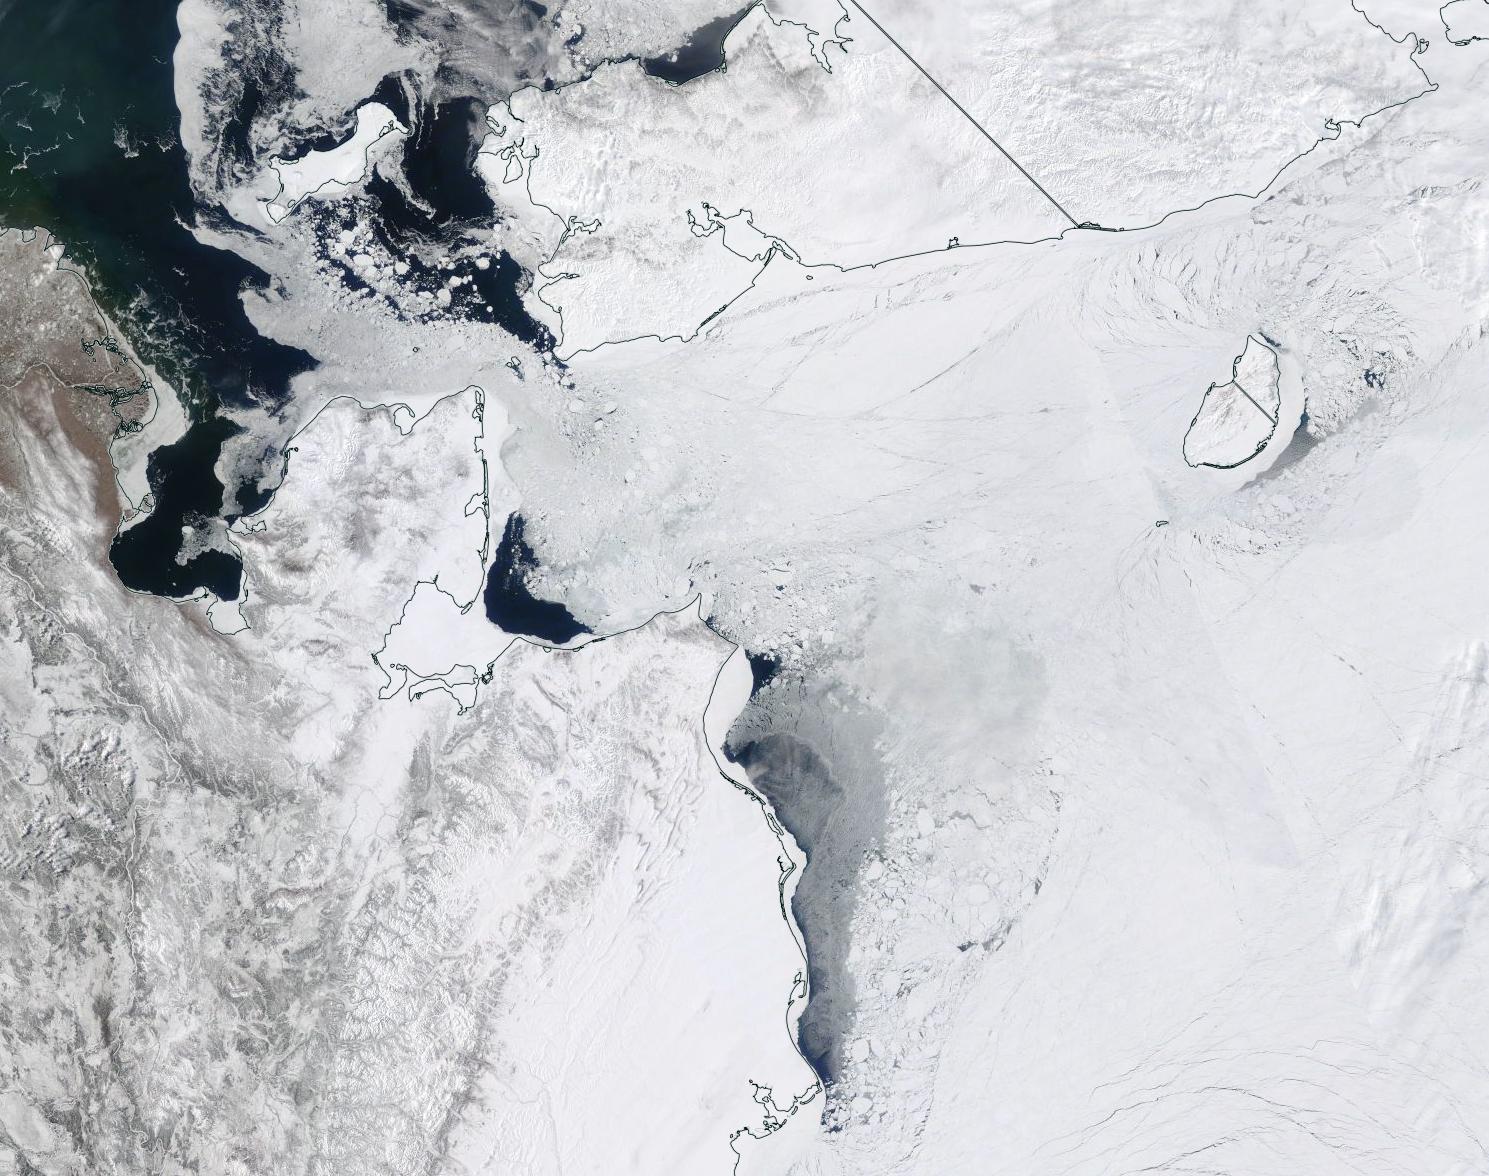
As you can see, there have indeed been a few ups and downs! Click the image below to see a 10 Mb animation of ice motion over the last few weeks:

The obvious point to note at the moment is that there are currently long flaw leads on both the Siberian and Canadian sides of the Arctic Ocean. The animation also reveals episodes of open water in the Beaufort and Chukchi Seas, as well as north of Franz Josef Land and Svalbard.
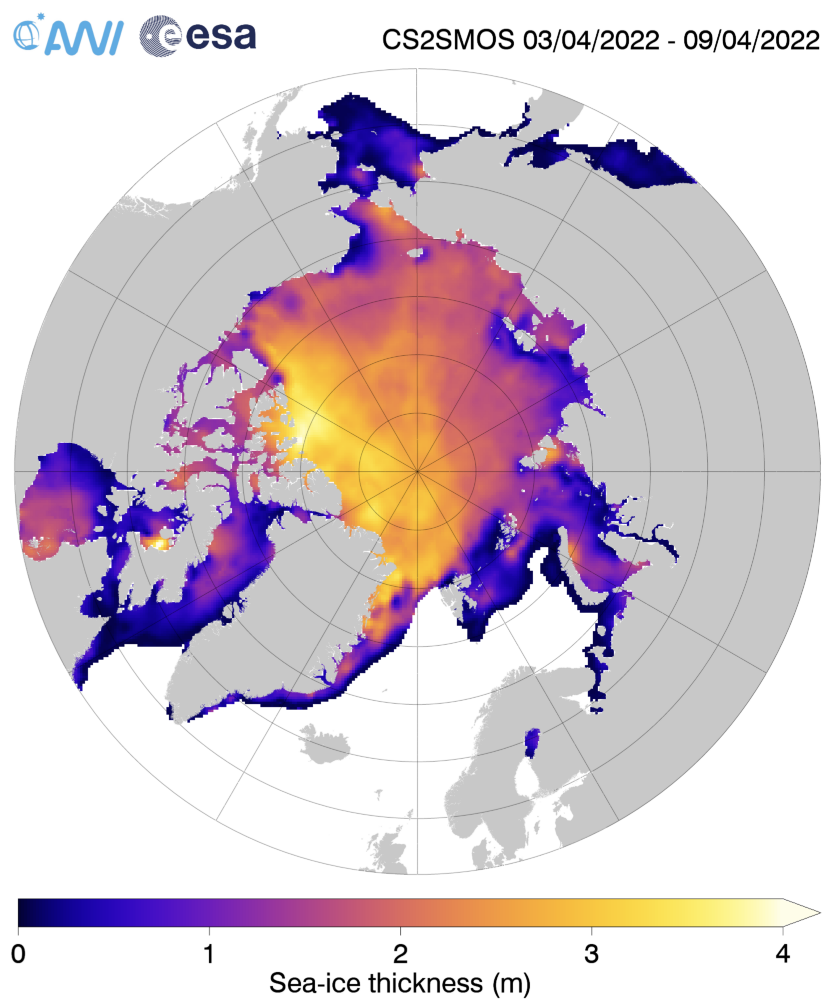
The ice in those areas is still very thin on the latest AWI CryoSat-2/SMOS sea ice thickness map:
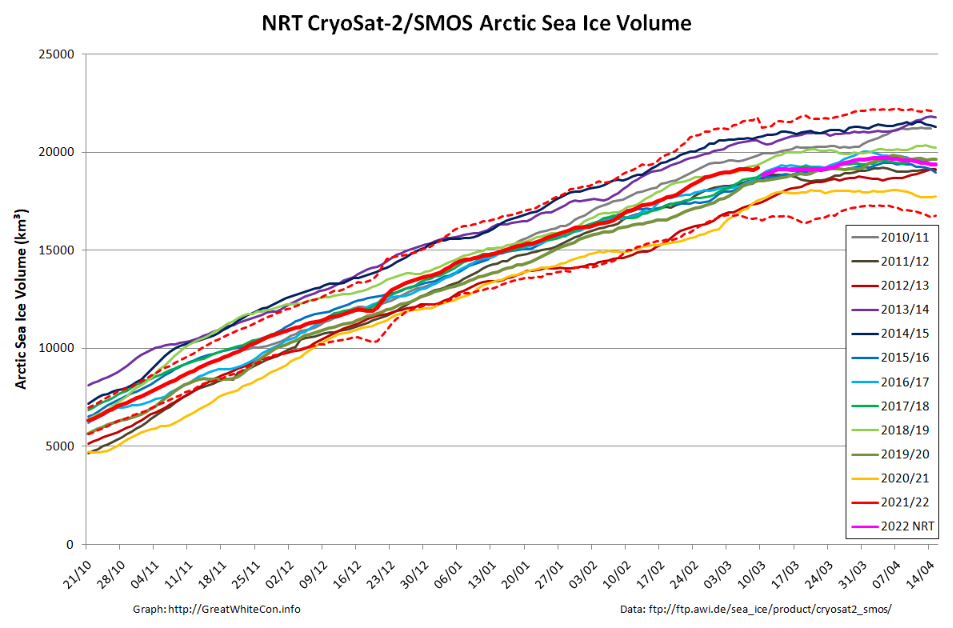
Here too is the latest AWI CryoSat-2/SMOS volume graph:
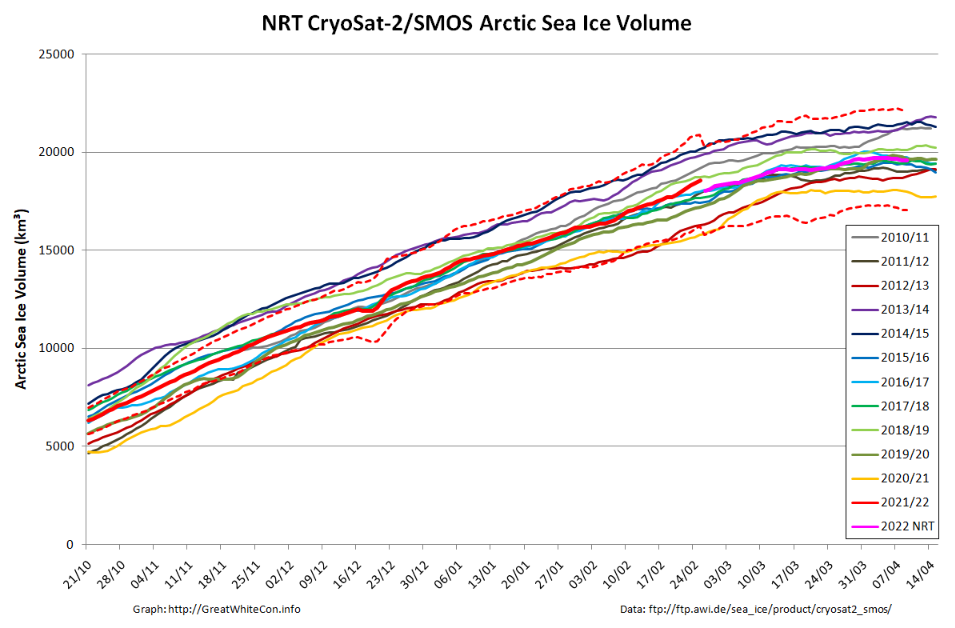
The reanalysed data is now showing something of a surge towards the end of February.
[Edit – April 23rd]Here’s the last “near real time” AWI CryoSat-2/SMOS Arctic sea ice thickness map for Spring 2022:
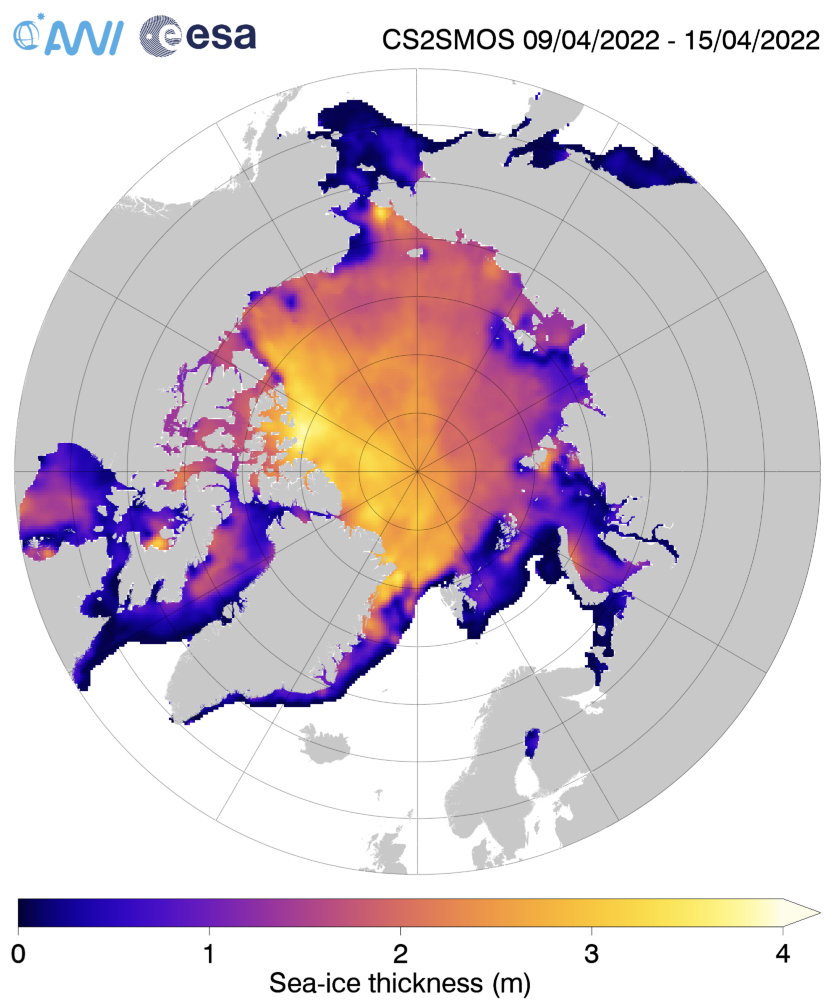
The significantly thinner areas in the Beaufort and Chukchi Seas are even more pronounced than previously. Here also is the associated CS2/SMOS volume graph:
The 2022 maximum volume based on NRT data is 19719 km³ on April 5th. Expect that to be revised upwards when the reanalysed data is ultimately published.
Going back to 2 dimensions, the assorted “ups and downs” now seem to have resolved into the melting season proper:
The peripheral sea have been responsible for most of the recent decline:
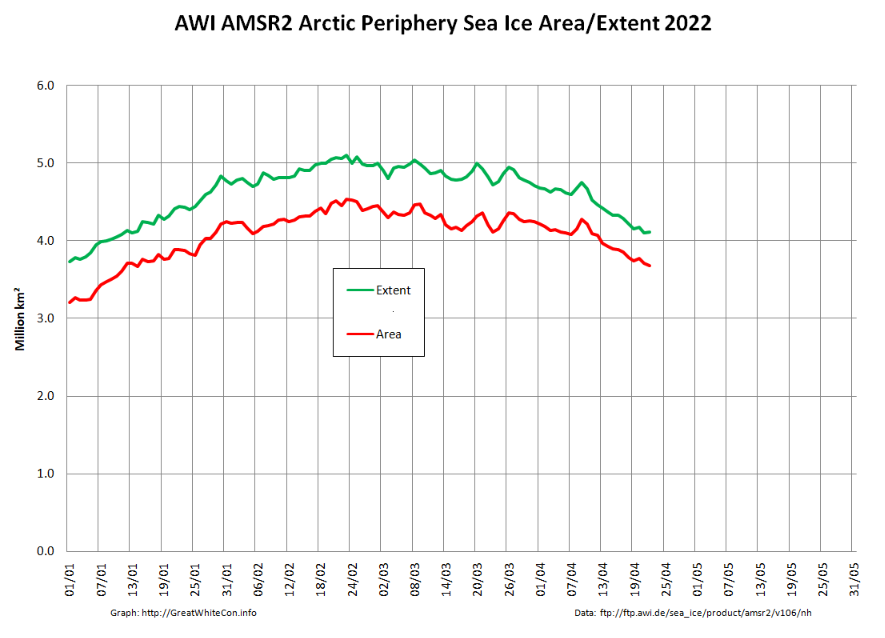
However as mentioned above, the Chukchi Sea has been experiencing some ups and downs of its own. Perhaps the sun is now high enough in the sky for the most recent “down” to stick around for the summer?
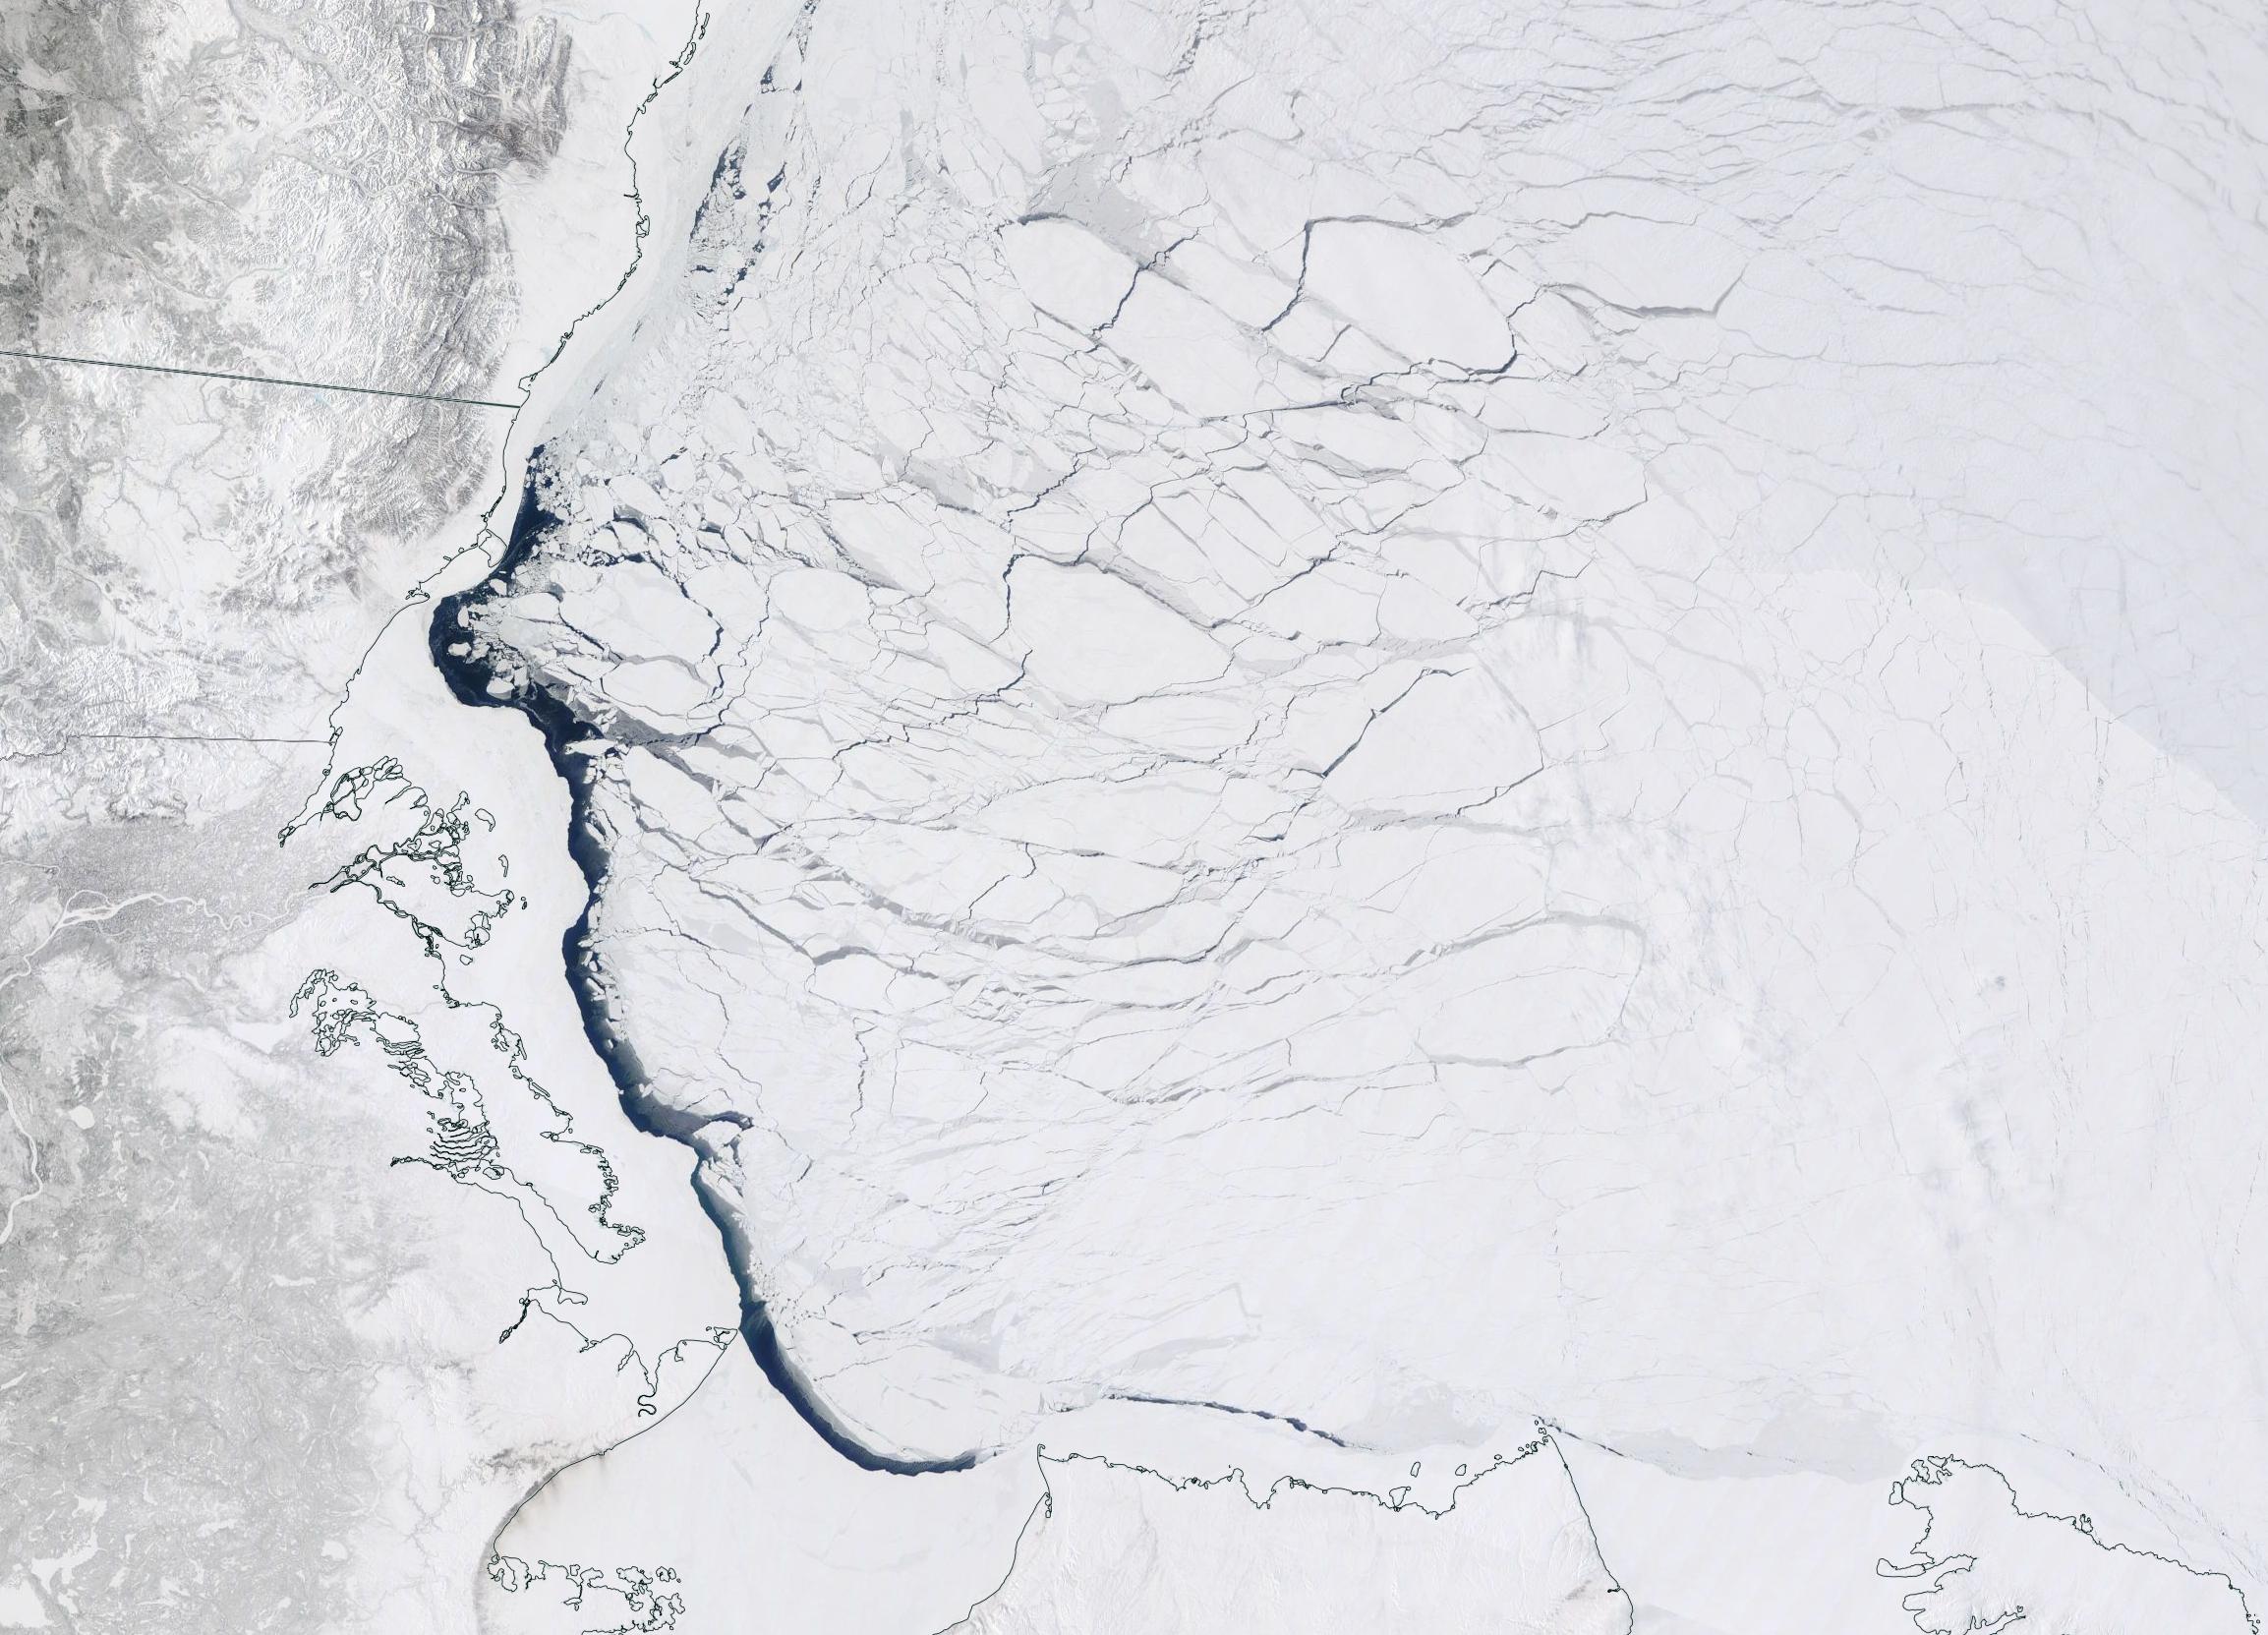
Over the last couple of days some open water has appeared in the Beaufort Sea off the Mackenzie Delta:
Especially for Taylor, here’s the GFS Arctic snow depth forecast for 10 days into the future:

See in particular the Beaufort and Chukchi areas.
Please also see the new open thread for May 2022
PIOMAS: “ Ice growth anomalies for March 2022 continued to be at the upper end of the most recent decade.”
Or as they say succinctly in another paragraph “…no trend [for March] in the last 11 years.” Any thoughts on when a negative trend might resume? This is the fifth or sixth month with no trend over that period. Given that both DMI (extent and volume) and NSIDC (extent only) are now in the decile range for ‘81-‘10, and Arctic temps are now ‘normal’ for the same period, I suspect that April will follow the same (no) trend readings. Any predictions for April?
I’m not a meteorologist, indeed, I’m I’ve only recently started reading about Arctic sea ice, I do know it’s hard to make predictions, but here goes anyway.
We’ll probably still see a similar extent at least at this time of the year for quite some time, no matter what happens the sunless Arctic winter will always be long, dark, it’ll be a long time after a blue ocean event before it’ll be warm enough to stall ice formation in the winter to say the least!
The ice will still pile up against the Canadian Arctic archipelago, flow out the Fram, the nares into the periphery.
In the worst summers for the ice,2012, 2019,2020 we’re still left with a rump of ice in the hardest to reach areas via ocean circulation, and the brief summer insolation above 80°. Again it could take quite some time for global temperatures to rise enough to melt the last of it.
In short, maybe the loss of the remainder of the sea ice could be a lot slower than what we’ve seen so far.
Only time will tell!
I predict that it all depends on the weather!
However now that the sun is shining in the land (and ocean) of the midnight sun I do start looking at snow cover.
Pretty ‘normal’ as well!
Yes, pretty normal, as are temps above 80 degrees north latitude. -20C or so at this point, per DMI. So previous warm spike is over, but sun will start to take over eventually. I see a pretty ordinary April ahead, May, who knows?
I agree that, at this time of year, it’s very useful to look at remaining snow cover. I also like to track ice cover in the US Great Lakes. Yet another indicator on an ‘unremarkable’ year:
[Embedded image – Mod]
In March the sea ice dropped BELOW 2010’s average for the first time since August 2021 !
Jan.31st. 16th.lowest. +333,064 sq.km. above 2010’s average.
Feb.28th. 11th.lowest +116,764 sq.km. above 2010’s average
Mar.31st. 10th.lowest -127,470 sq.km. below 2010’s average
Apr. 10th.14th.lowest +115,602 sq.km. above 2010’s average
April sees the restoration of sea ice extent ABOVE the 2010’s average.
Will this continue through 2022
AMO for Jan. 0.182
AMO for Feb. 0.139
AMO for March dropped significantly to 0.014
Jim, thanks for posting the NRT data, but per DMI, the jury is still out. We’ll see what PIOMAS says in a few weeks. In the meanwhile, DMI temps north of 80 degrees show it’s very cold compared to long term averages this time of year. I don’t remember a previously comparable year, but will try to find one. Still looks to me like natural variation is overwhelming any near-term (10 year) trends. Time (as usual) will tell…
I’m afraid I don’t set much store by the DMI’s volume calculations. Their temperature graph is also heavily weighted towards the North Pole:
In actual fact surface temperatures across the Pacific side of the Arctic Basin are currently well above “normal”:
“DMI… heavily weighted toward the North Pole.” Yes, I agree, Jim. That’s why it’s referred to as “above 80 degrees North. If they wanted to measure “above 60 degrees North”, I’m sure they would have reported a different number. However, I note from the GFS/CFSR data you showed, that it’s pretty cold along the Siberian coast, which might offset some of that Pacific-side warmth, so who knows?
For those seeking evidence of warming, the good news is it’s always warm somewhere, and for those of us worried about it getting colder, there’s evidence for that as well. The current 11-year “no trend” might last another 20 years, in which case we’ll all have to say the climate has changed. If the trends start going down again, then skeptics will need to admit that we are in a further warming period. Can’t wait to find out!
“That’s why it’s referred to as “above 80 degrees North.”
And it’s more heavily weighted towards 90N than 80N!
“It’s pretty cold along the Siberian coast”
However as discussed above, there’s already open water and plenty of thin ice in the Chukchi Sea, where it is currently also anomalously warm. None of which applies to the North Pole, which is irrelevant at this time of year.
“Plenty of thin ice in the Chukchi Sea…” Yes, but per DMI also plenty of 4-meter ice south of Wrangel Island. Will probably a pptential challenge for early season icebreakers trying to reopen the passage. As you say, stay tuned!
Compare and contrast the DMI modelled thickness with the AWI measurements (see above):
Whether it’s 1 meter thick or 4, the albedo of snow covered sea ice is still a lot greater than that of open water. Whilst we eagerly await the Summer solstice, temperatures in Pevek have been above freezing point recently:
The 2022 melting season is warming up, as discussed over on the May open thread.