Earth’s energy imbalance is of course a critical factor driving “global warming”. According to NASA back in June:
Researchers have found that Earth’s energy imbalance approximately doubled during the 14-year period from 2005 to 2019.
Earth’s climate is determined by a delicate balance between how much of the Sun’s radiative energy is absorbed in the atmosphere and at the surface and how much thermal infrared radiation Earth emits to space. A positive energy imbalance means the Earth system is gaining energy, causing the planet to heat up.
The doubling of the energy imbalance is the topic of a recent study, the results of which were published June 15 in Geophysical Research Letters.
Scientists at NASA and NOAA compared data from two independent measurements. NASA’s Clouds and the Earth’s Radiant Energy System (CERES) suite of satellite sensors measure how much energy enters and leaves Earth’s system. In addition, data from a global array of ocean floats, called Argo, enable an accurate estimate of the rate at which the world’s oceans are heating up. Since approximately 90 percent of the excess energy from an energy imbalance ends up in the ocean, the overall trends of incoming and outgoing radiation should broadly agree with changes in ocean heat content.
“The two very independent ways of looking at changes in Earth’s energy imbalance are in really, really good agreement, and they’re both showing this very large trend, which gives us a lot of confidence that what we’re seeing is a real phenomenon and not just an instrumental artifact, ” said Norman Loeb, lead author for the study and principal investigator for CERES at NASA’s Langley Research Center in Hampton, Virginia. “The trends we found were quite alarming in a sense.”
As our regular reader(s) will no doubt already be aware, Willis Eschenbach has been singularly unhelpful when it comes to assisting 3rd parties to reproduce the results contained in his 2014 letter to the editor of PNAS on the topic of “Arctic albedo”:
Whilst we wait (in vain?) for Willis to explain himself, here is a preliminary look at some example CERES net top of the atmosphere energy flux maps for the Arctic:
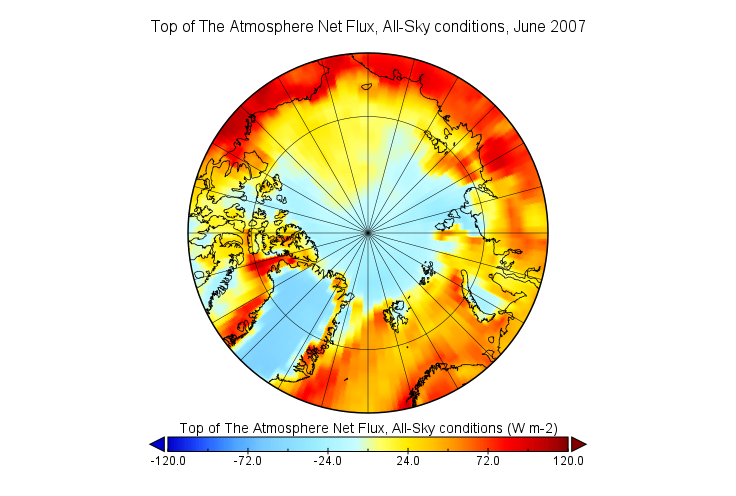
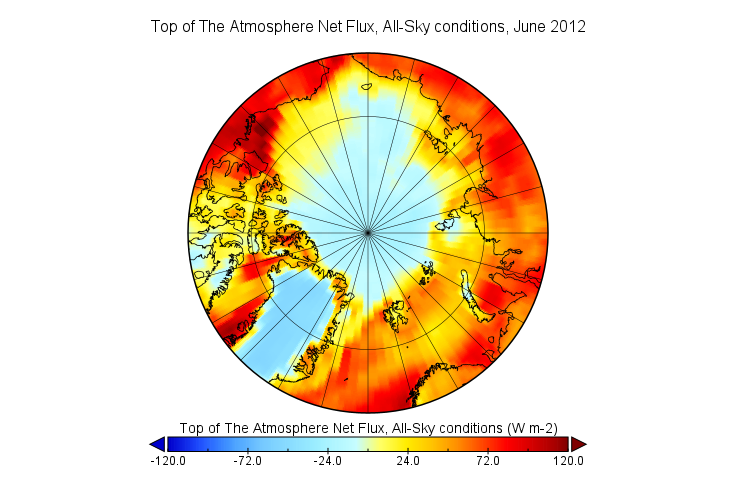
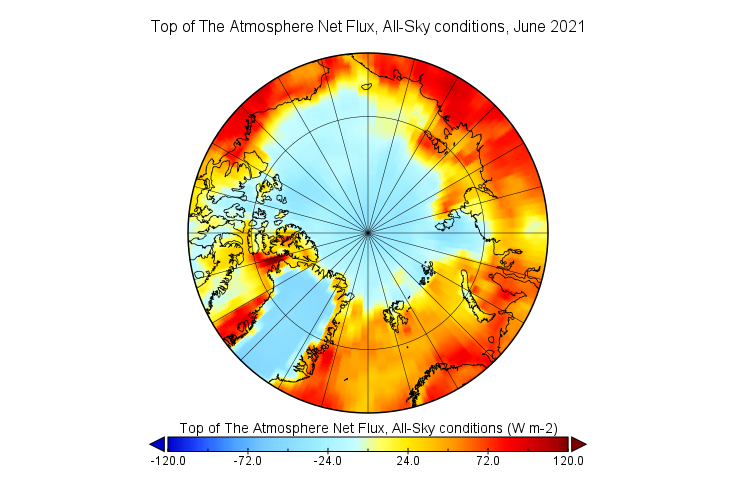
June 2021 is the latest month currently available in NASA’s CERES data, and please feel to play the game of “spot the difference” in the space provided for that purpose below. Meanwhile we await the data for July and August 2021 with barely bated breath.
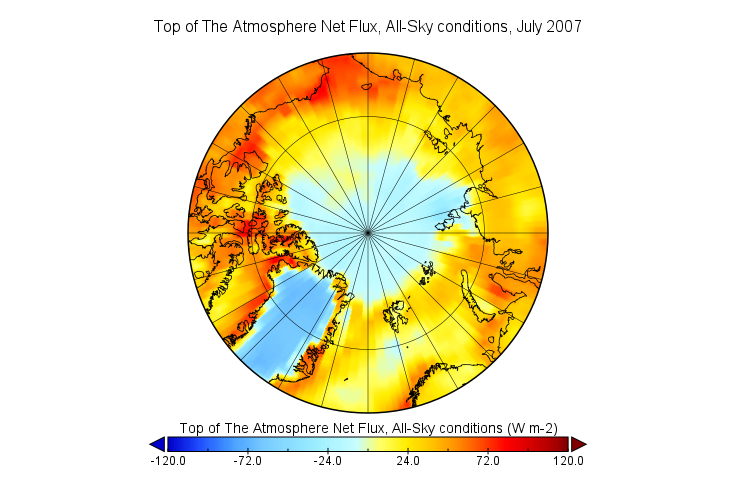
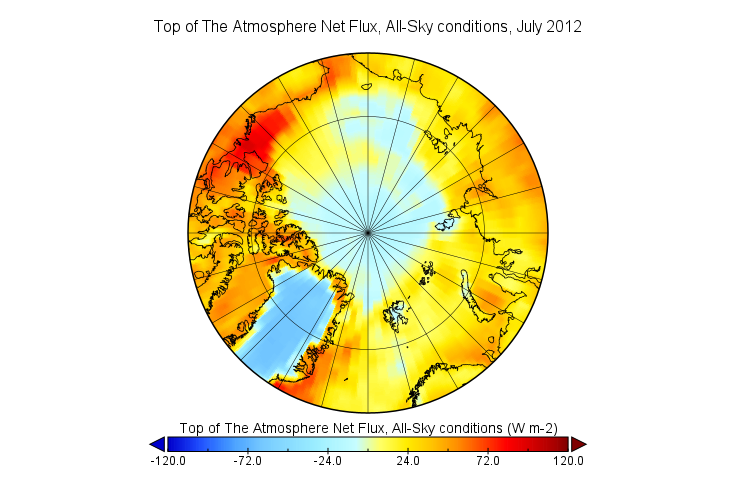
The CERES data for July 2021 has now been released, so first of all let’s take a look at the July net TOA flux for some selected years:
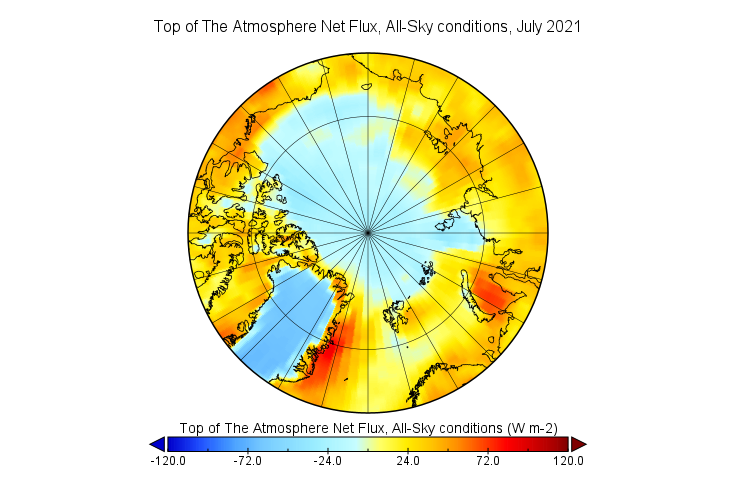
Next let’s compare this year’s peak insolation months with last year’s:
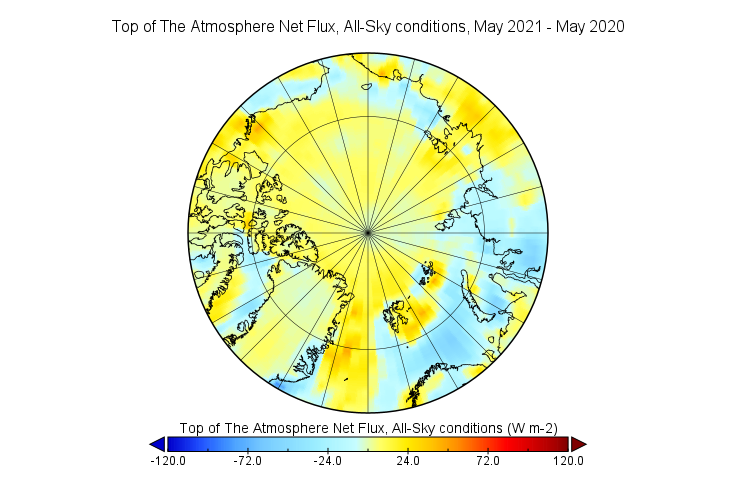
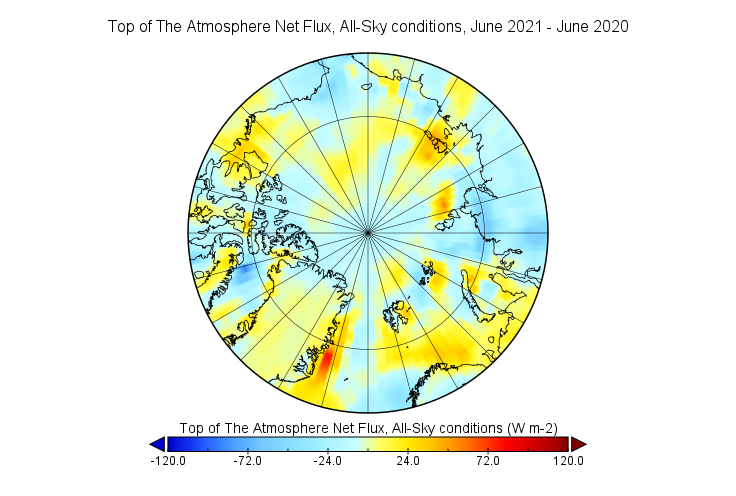
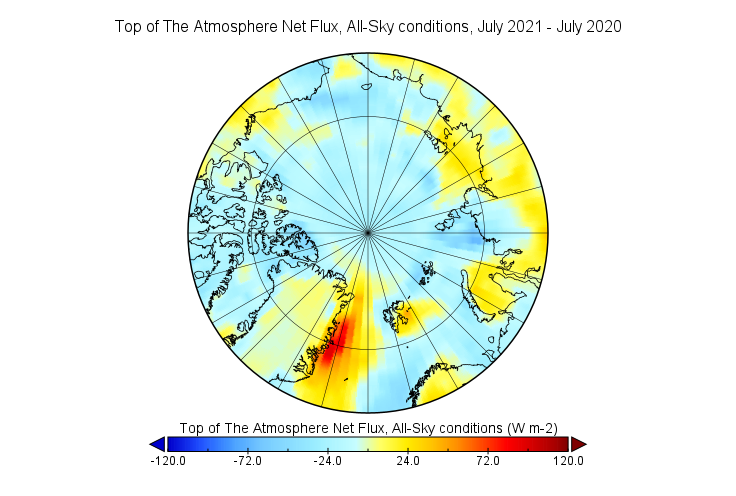
Does anything stand out yet?
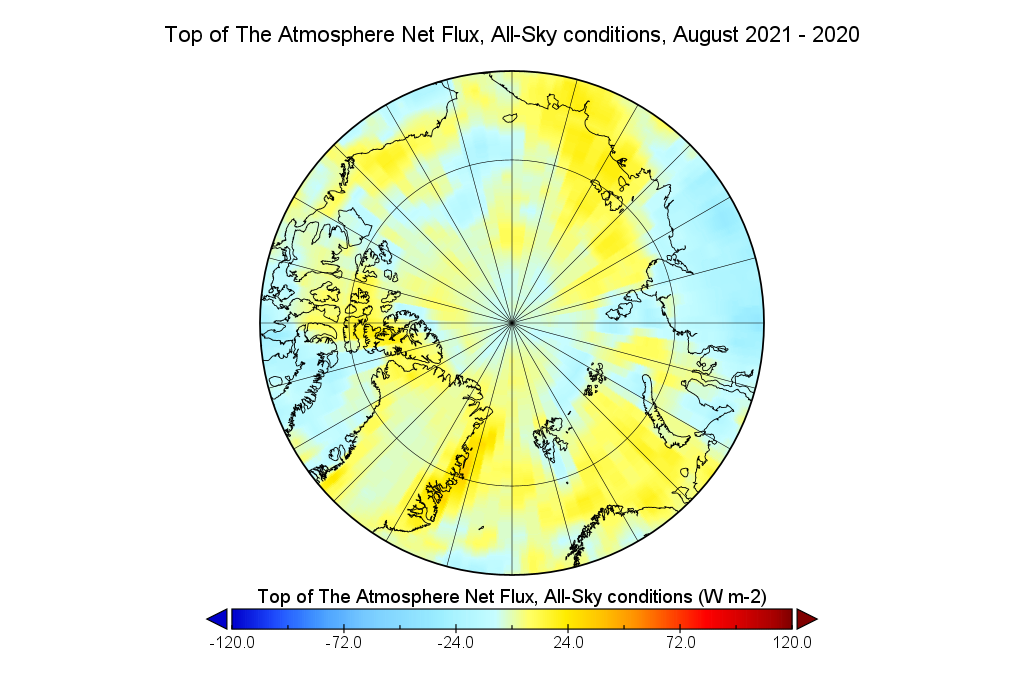
[Edit – January 1st]Here are maps of the CERES net TOA flux for August 2021 and our usual selection of other years:
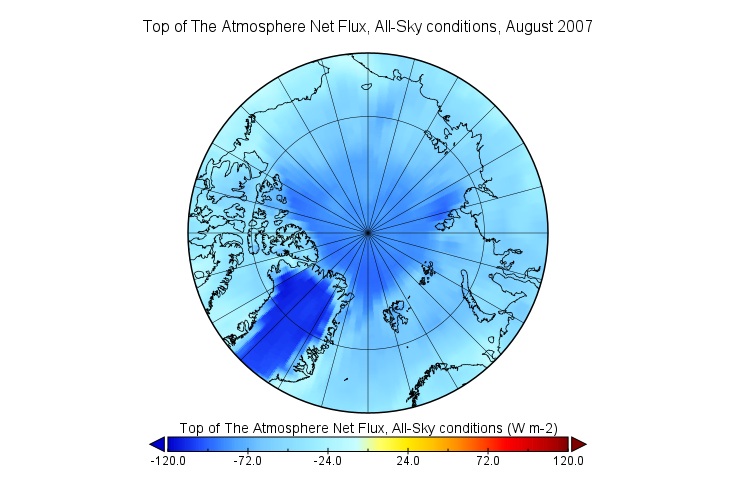
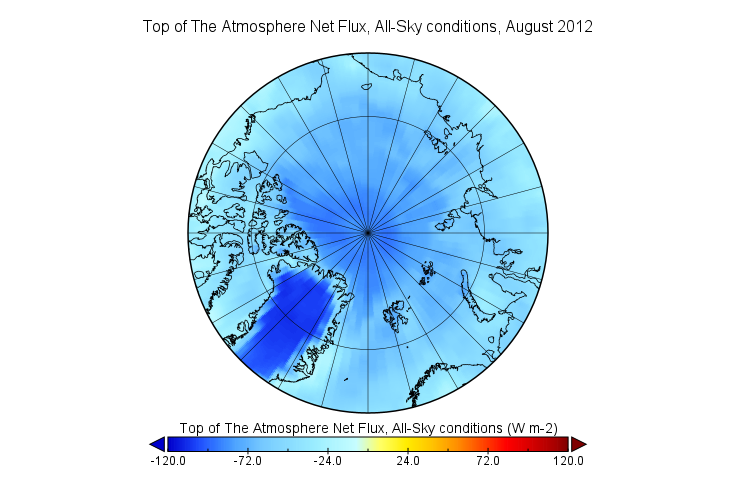
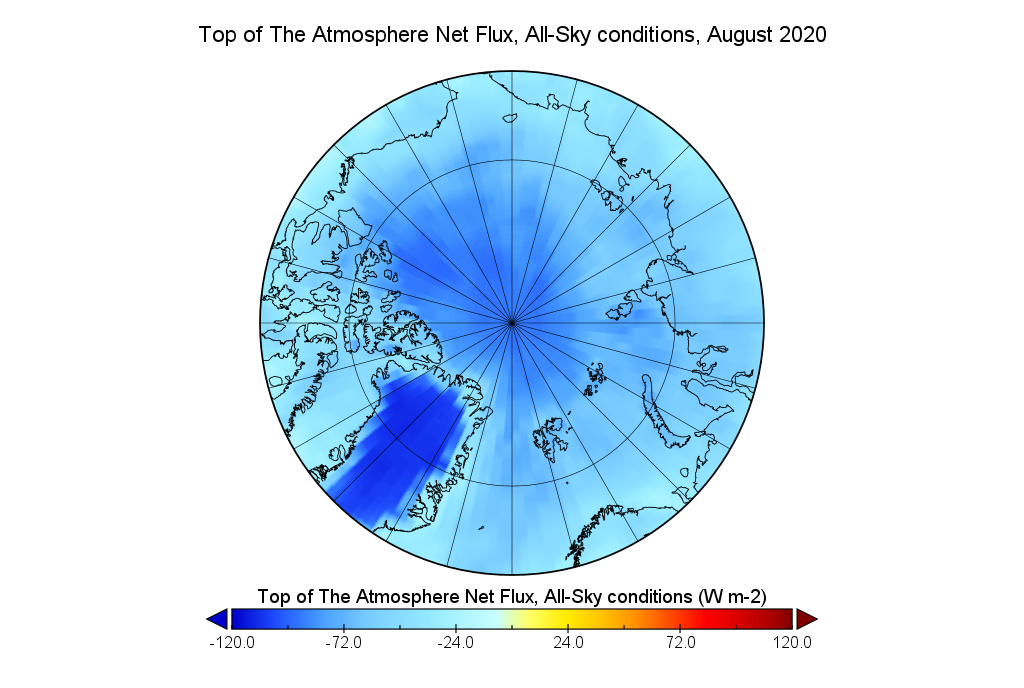
It is obvious that by August the entire Arctic is radiating energy back into space. Now let’s compare August 2021 with 2020:
Whilst we’re at it let’s also take a look at how September compares to last year:
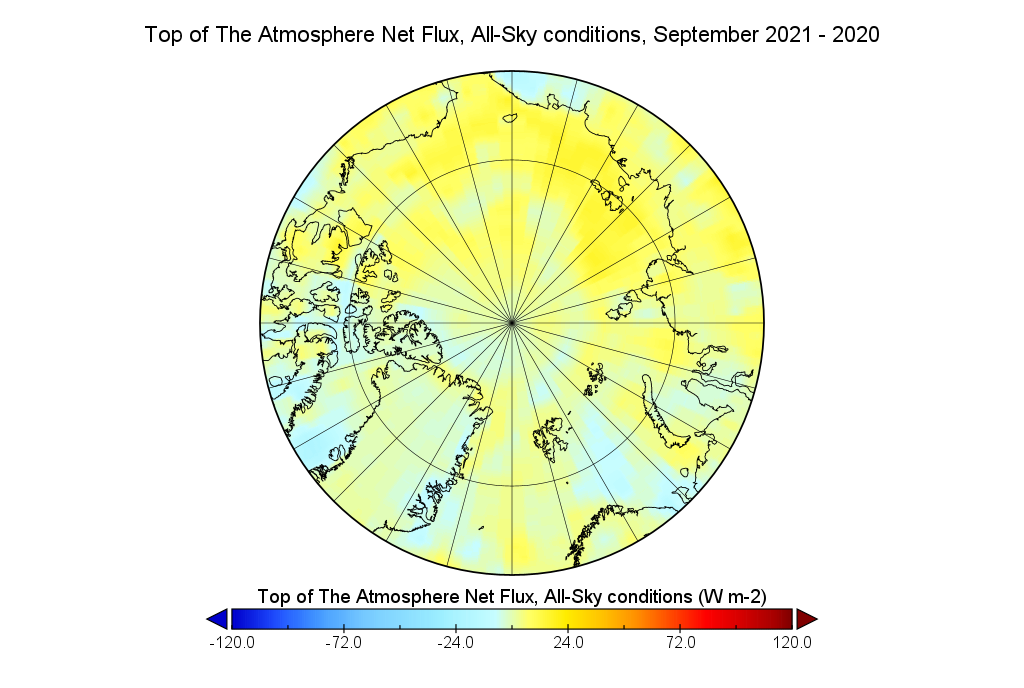
It is also obvious that the central Arctic has been radiating less energy back into space during September this year than it was in 2020.
Watch this space!
“Since approximately 90 percent of the excess energy from an energy imbalance ends up in the ocean, the overall trends of incoming and outgoing radiation should broadly agree with changes in ocean heat content.”
–
An interesting statement.
As an exercise one could consider what happens when there is an decrease in cloud cover for a year which should lead to an increase, different to an imbalance, in energy through the system.
The land gets a third of that energy , the sea 2/3. both will warm up.
9/10 of that energy may end up redistributed in the sea but one does not
say that it stays there, would one?
The concept of an energy imbalance demands equivalence of distribution, in other words if storage could occur it should be shared. This though creates problems, the “missing heat”.
The overall trends of incoming and outgoing radiation should broadly agree with changes in both land and ocean heat content.”
Precisely because it is not being stored.
November ice and Piomas will be interesting. La Nina faltering but effects should last all November December.
Will we still be in 10th spot in the Arctic?
Will the global temperature drop below 7th place?
“A decrease in cloud cover for a year which should lead to an increase, different to an imbalance, in energy through the system.”
I’m afraid you’ve lost me Angech. Unless I’ve misunderstood, NASA are saying that an increase in energy in the system corresponds to a temporary imbalance in the top of atmosphere flux. Net global incoming flux > 0.
Or did you have some other sort of “imbalance” in mind?
Thanks, Jim.
A few of the scientific statements seem to leave missing gaps in applying physics.
–
“NASA are saying that an increase in energy in the system corresponds to a temporary imbalance in the top of atmosphere flux. Net global incoming
flux > 0.”
–
The whole concept has a problem.
A constant heat source and constant absorption leads to a constant outgoing heat flux which cannot be positive or negative.
TOA is where the fluxes are always in balance..
Whether you increase the energy [sun or less clouds] or decrease the energy [sun or more clouds} the energy entering and leaving the earth always has to balance.
–
There is no imbalance. There is a change in the height of the TOA only.
The extra energy that goes in has to come out.
–
Saying that there has to be an imbalance is scientifically and physically wrong.
Saying that there is more energy going through the system is fine.
–
The amount of energy going out cannot be accurately measured due to the effects of clouds on the radiation assessment and limitations, to date on coverage [Roy Spencer].
Given that the error bars are far larger than any CERES estimate of anomalies and given the limitation of the ARGO argument as backup proof the article is misleading.
–
One should point out that in any natural setting the TOA errors should be 50% up and down.
When they are consistently up, 97%? , over a decade or more the observations are obviously wrong.
Mornin’ Angech (UTC),
“There is a change in the height of the TOA only.”
Which is illustrated in this GIF by Rasmus Benestad from our “Greenhouse Effect Explanations”
Over there you can also find some brief extracts from the oeuvre of the Halley Professor of Physics at Oxford University. A certain Raymond T. Pierrehumbert FRS:
The CERES visualisations above specifically map “Top of the Atmosphere Net [Energy] Flux”. As you can no doubt see, they are not uniformly white?!
I had a rant about Ceres with our friend JJB but still have great problems with possible retained heat and heat storage as concepts.
That is they seem real and logical but do not fit with SB .
Anyway , keep up the good work.
Thanks for your kind words Angech,
Some of this stuff is certainly counter intuitive, but (IMHO!) I don’t think you’ve quite got things straight yet.
And now I suppose I’ll have to go away and read JJ’s extensive correspondence on the matter?!
In the meantime here’s a blast from Prof. Ray’s past:
“Some of this stuff is certainly counter intuitive, but (IMHO!) I don’t think you’ve quite got things straight yet.”
True.
Probably a good thing.
Looking at other people and trying to understand their points of view and arguments should lead to greater understanding of one’s own views.
In the case of CERES and TOA I am trying to raise awareness that heat storage as described may have some flaws.
This is not a denial of GHG effects or back radiation which both have substantial science.
It may be as simple as the difference between energy of and energy [heat] stored in a body.
Interchangeable at any one specific moment of time.
Yet one is a permanent feature of all matter stored and unusable.
The other is transient and dependent on an inflow source and an outflow event which physics says has to balance.
Hence objects can get warmer and cool down with more or less energy running through them and yet never actually be a store of that energy in the way that it is a store of it’s own innate unusable energy.
This subtle difference does not mean that the earth does not warm up and cool down with energy changes. Just that using the word imbalance is wrong and justifies a concept of ongoing storage of energy until said imbalance is corrected.
Instead of just calculating the change in energy and saying this results in this distribution of the energy and heat and temperature profile at this time, a concept of a build up in energy over and above what is being put in is used.
Looking at the CERES data maps I am a little puzzled:-
A high altitude block of ice (Greenland) has a strong negative net flux (absorbtion of energy?) in summer (and a weakening annual emission).
But the cold, south-flowing stream to its east has a rapidly increasing annual flux – yet the heat from the bulk of the Gulf Stream (which warms Western Europe) and flows even further east tends towards a negative flux!??
(Are these CERES data maps showing differences from historical values or are they actual measurements?)
They don’t show anomalies, so in that sense they show “actual measurements” integrated over one month.
Blue (negative) areas show a net outgoing flux at the top of the atmosphere. Red (positive) areas show a net incoming flux.
To a first approximation the “high altitude block of ice” is shiny white so it reflects most of the incoming short wave radiation back out to space. Its temperature is above absolute zero, so it also emits long wave radiation to space. Hence in the middle of winter (note the change of scale):
Does that answer your question?