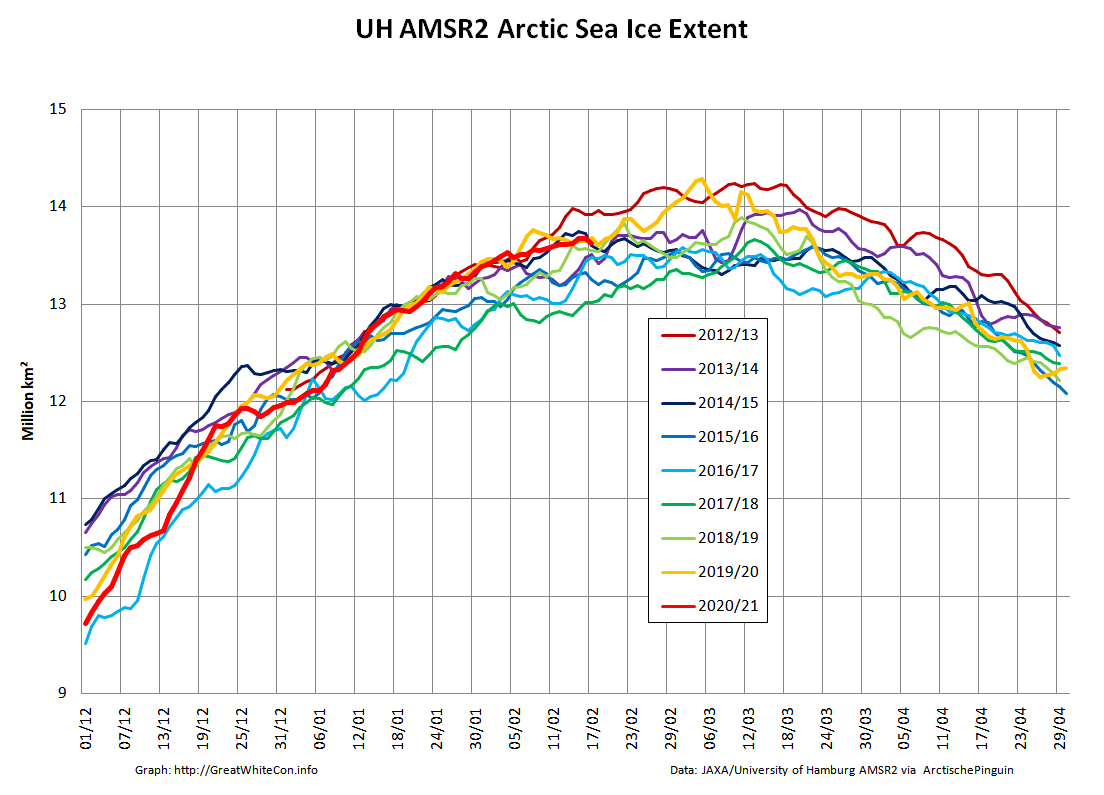
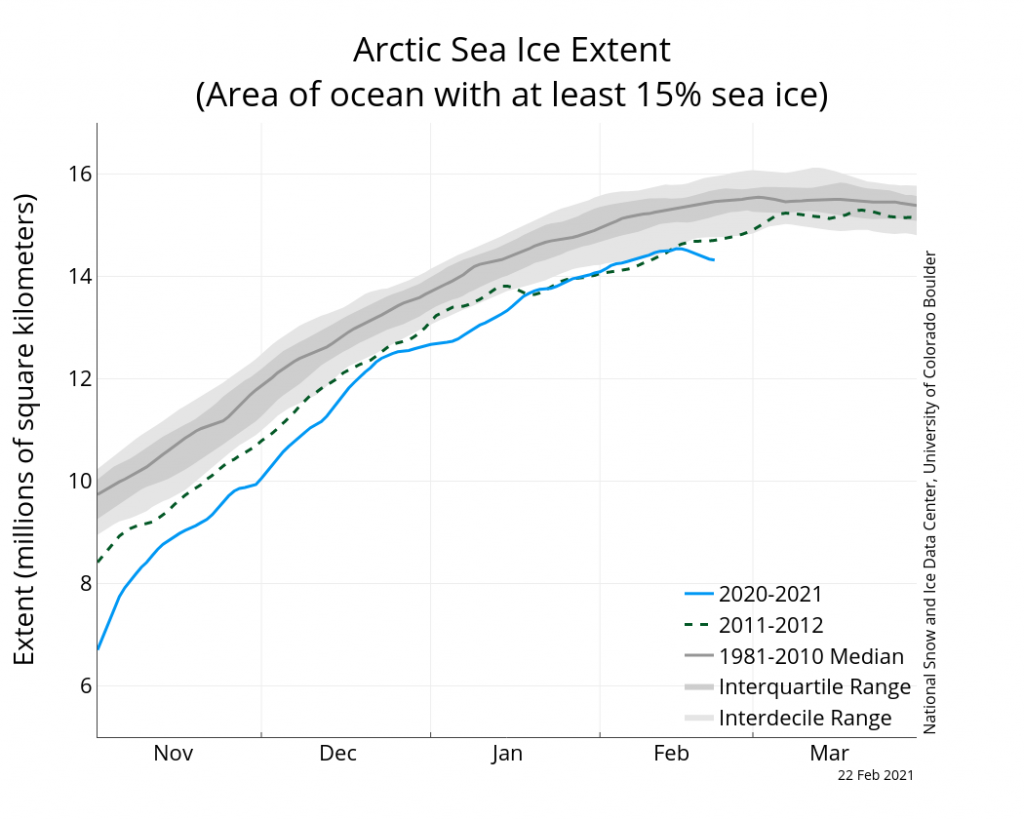
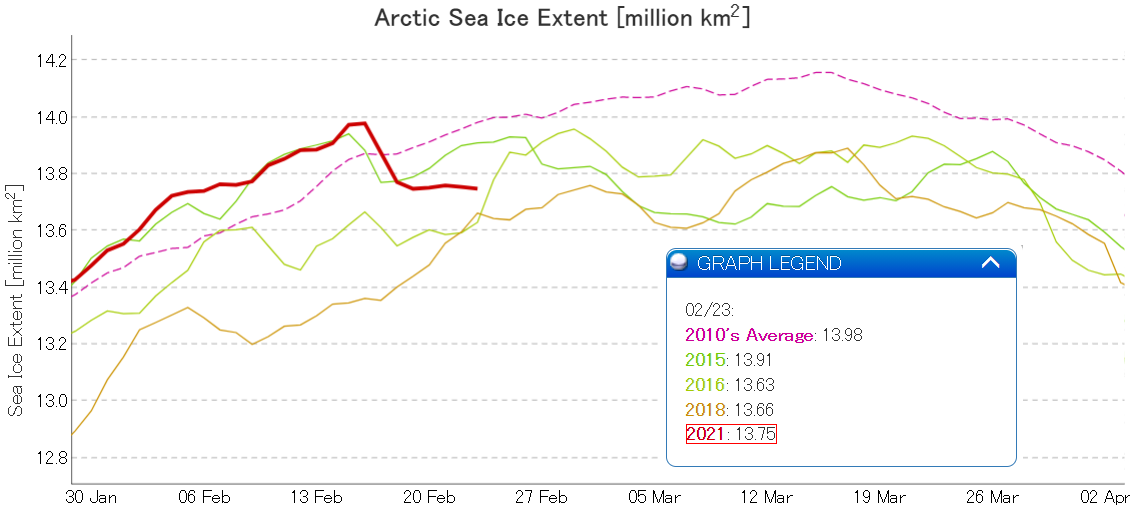
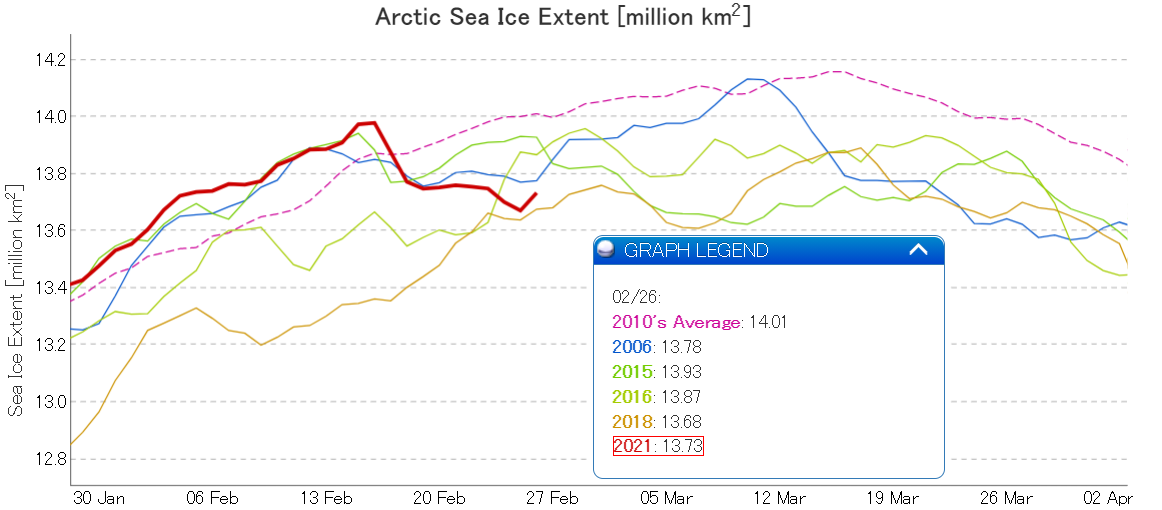
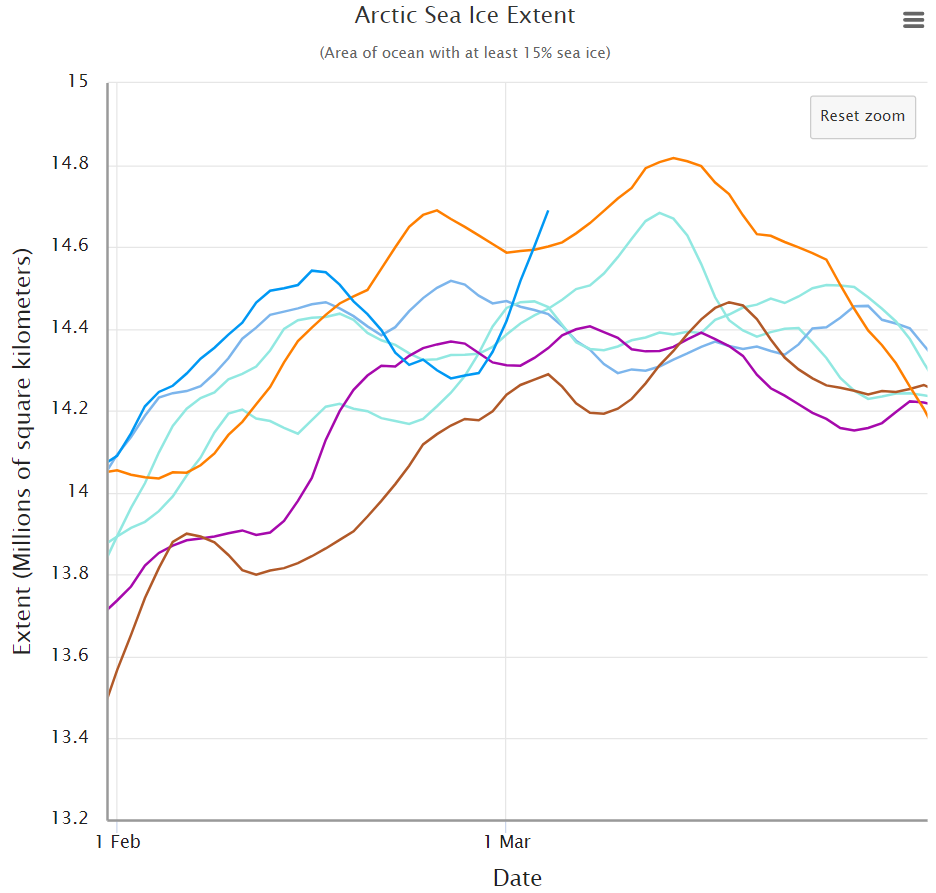
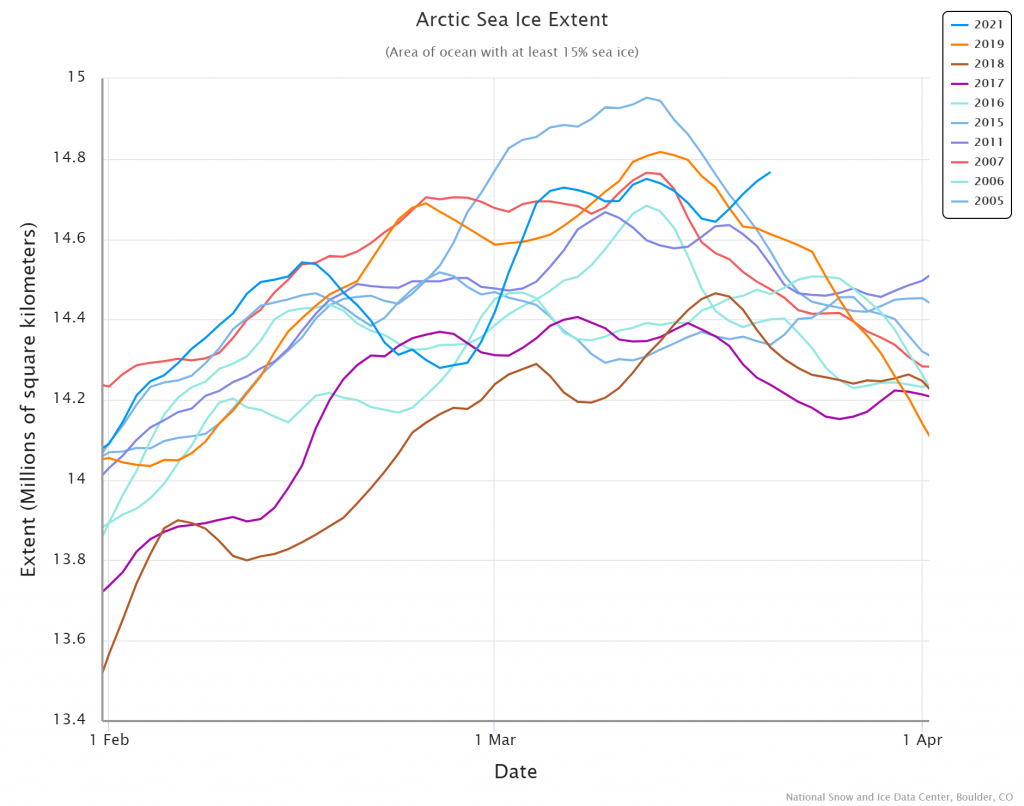
Here’s the latest graph of Arctic sea ice extent from JAXA/ViSHOP, with 2021 and 2015 highlighted:
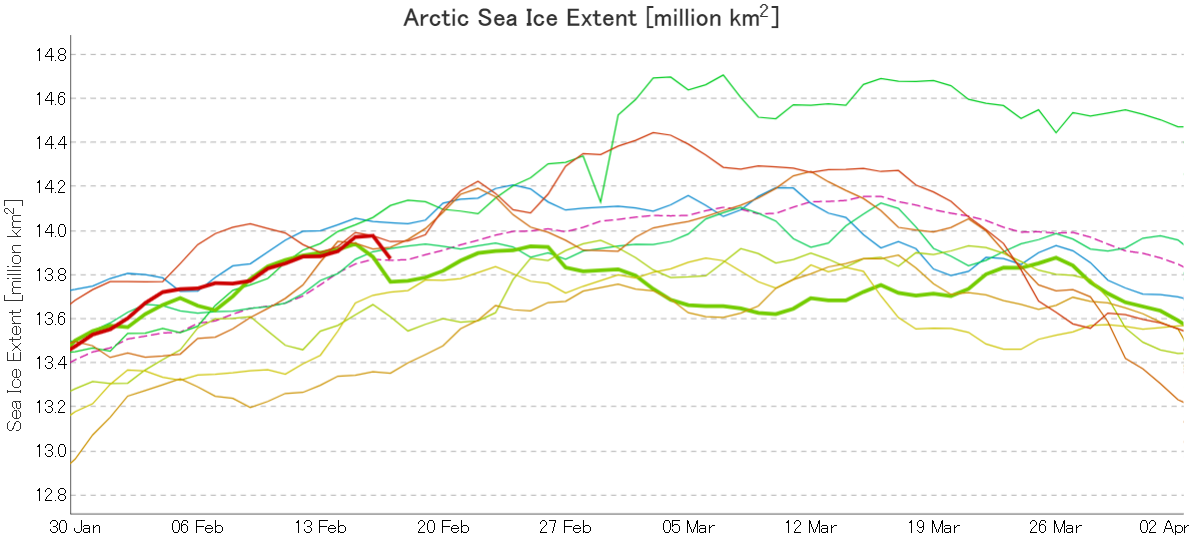
Extent fell by over 100,000 square kilometres between February 16th and 17th! Can that steep fall continue, as it did for one more day in 2015?
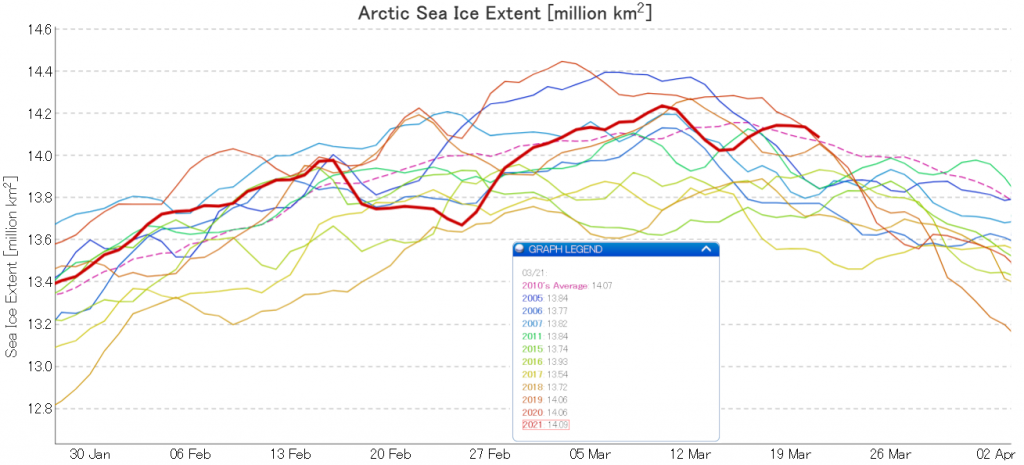
Here too is Zack Labe’s 2021 overview of JAXA maximum extent over the previous couple of decades:
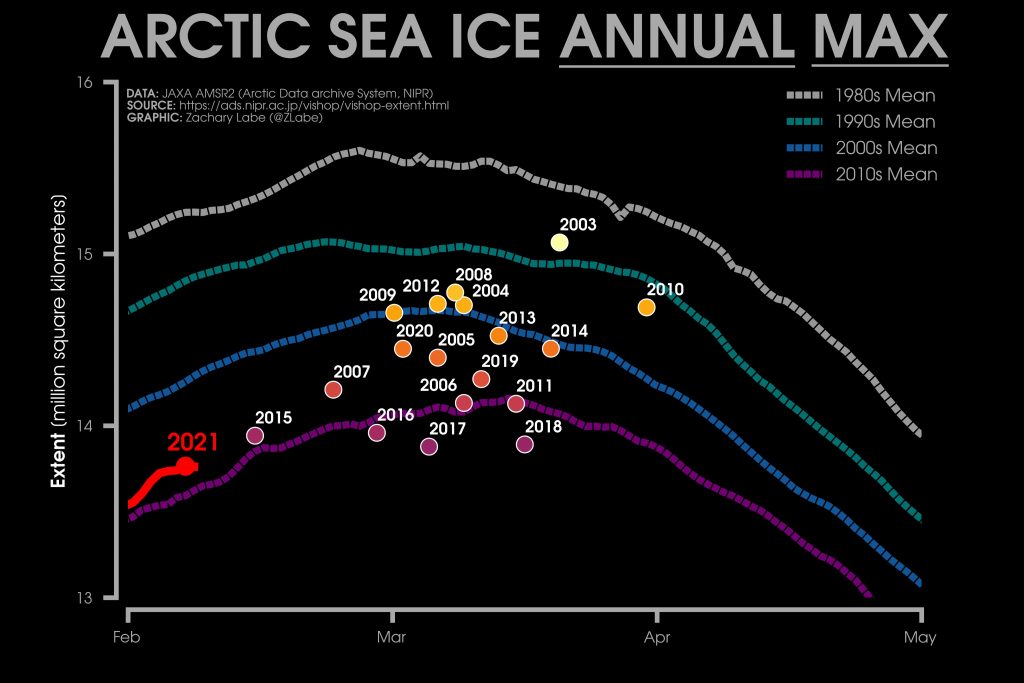
2015’s maximum was very early, on February 15th. Hence the current extremely tentative 2021 maximum is already both higher and later than that. The decadal average extent graphs show the date of the maximum getting later and later, and the 2010’s peaks in the middle of March.
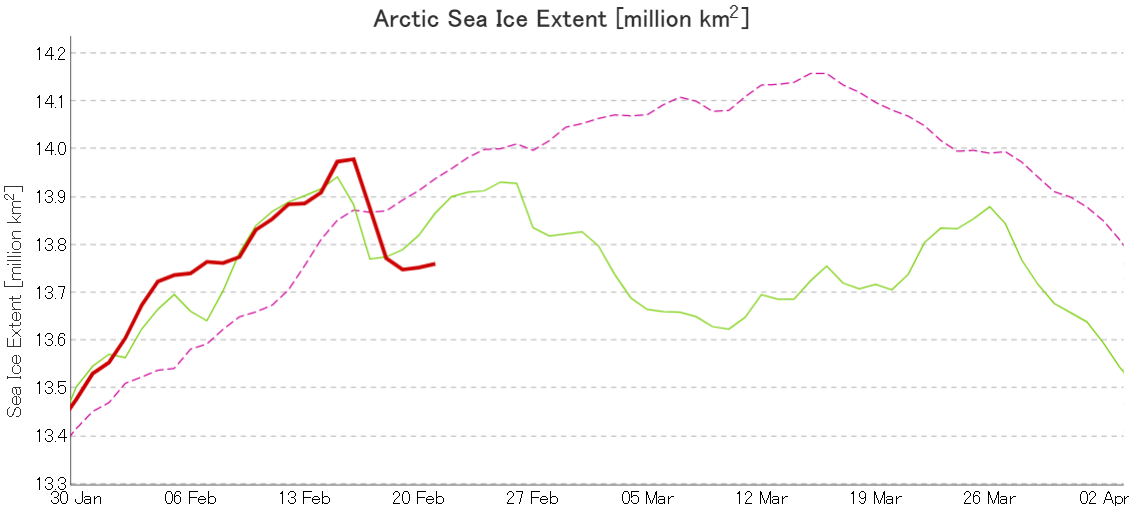
It therefore seems likely that there is more freezing still to come this year. However lets take a look at the high resolution AMSR2 sea ice area graph for the Sea Of Okhotsk:
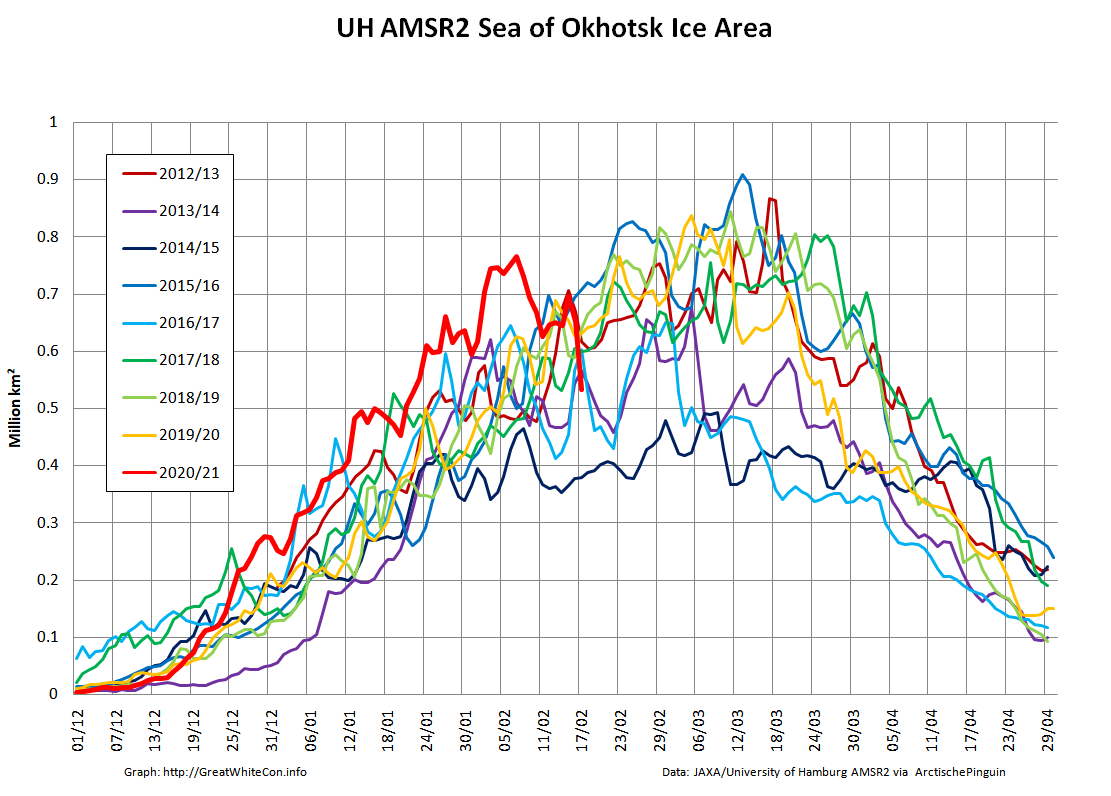
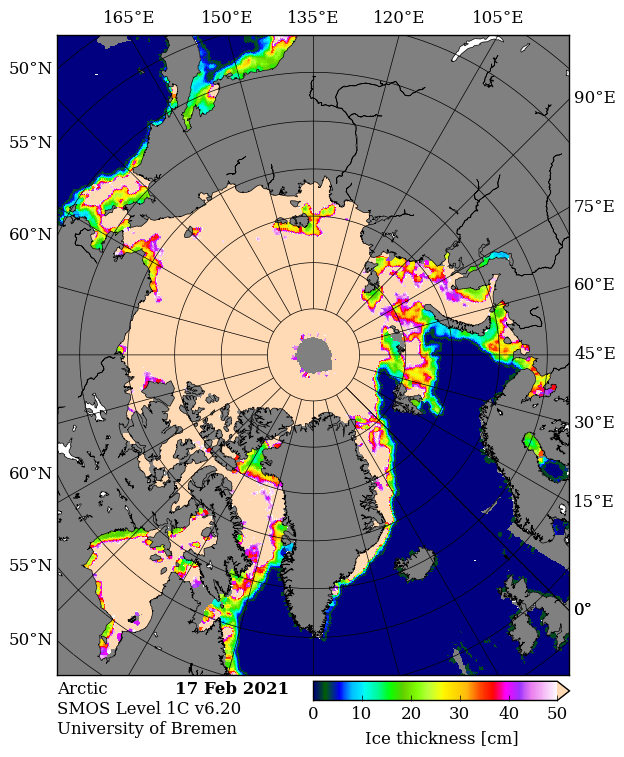
The recent fall in Arctic wide extent has evidently been driven by the recent rapid decline in this peripheral sea, where SMOS reveals more thin ice ripe for further melting:
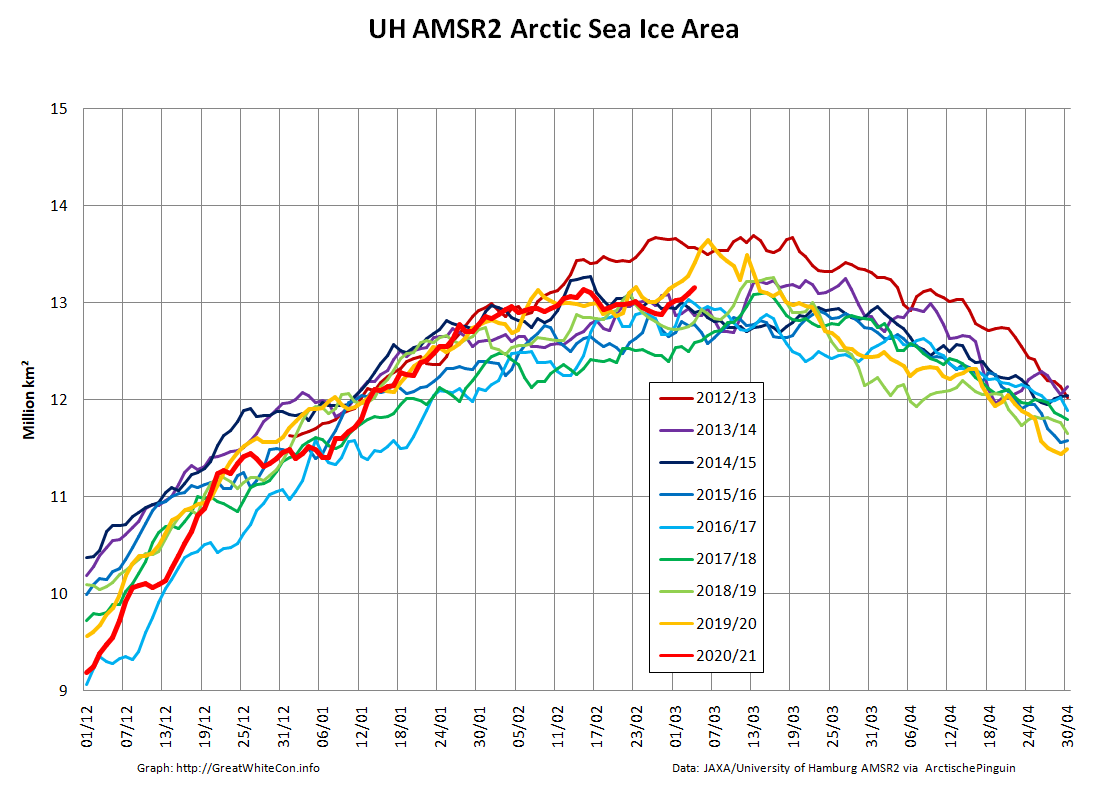
In conclusion, the high res AMSR2 extent metric shows the tentative 2021 peak below that of 2015!
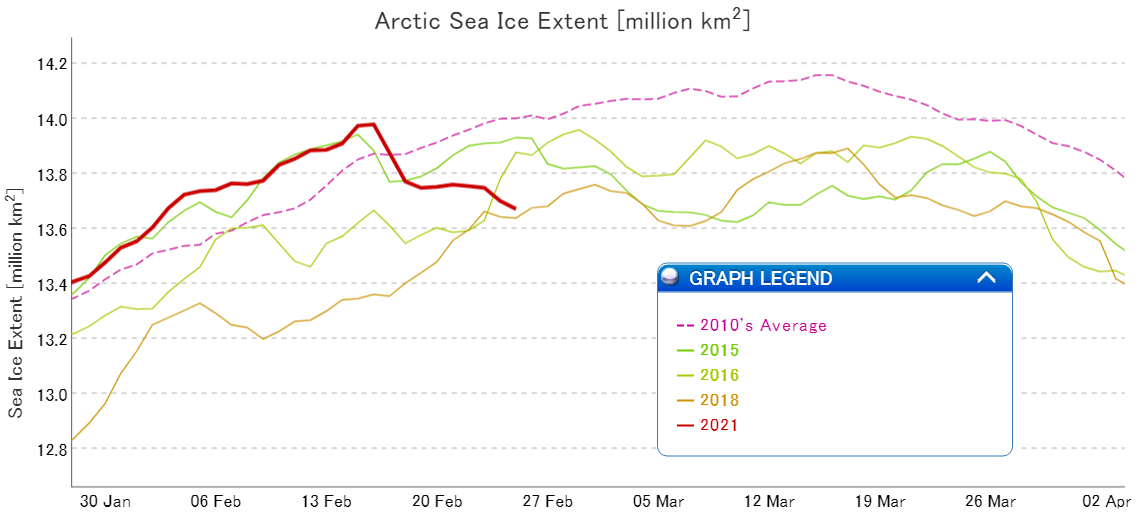
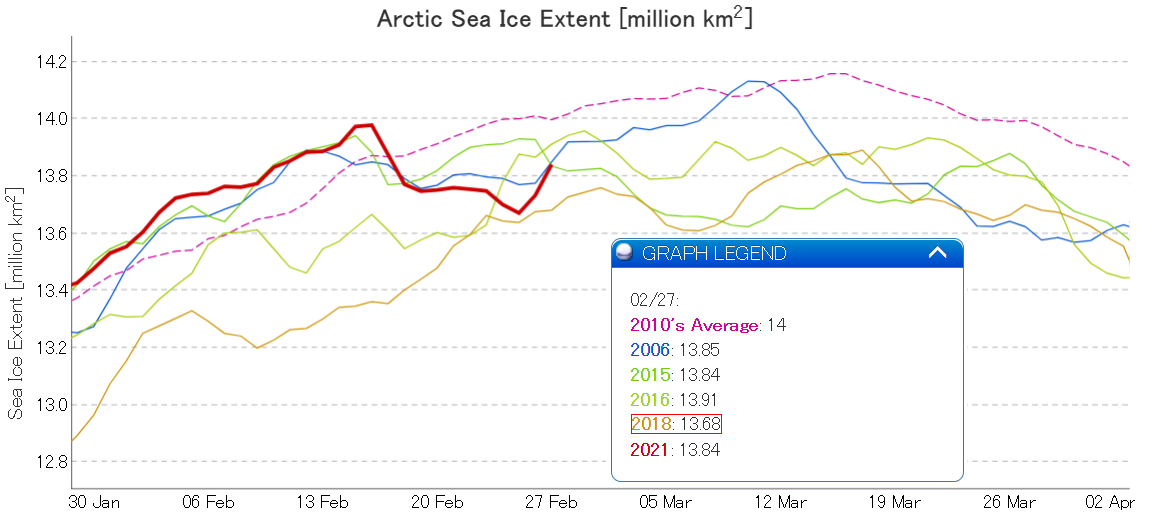
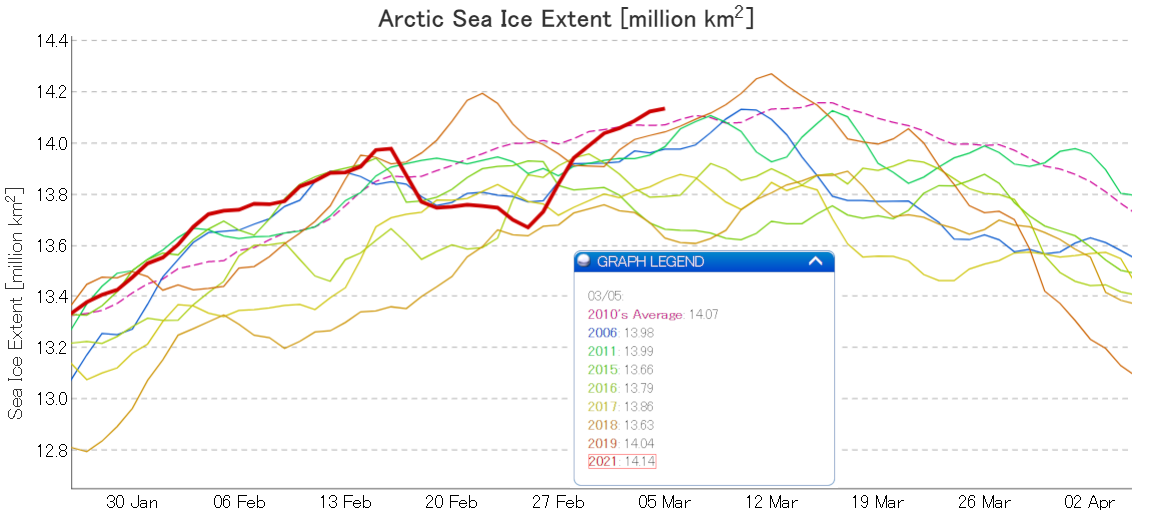
Following another 100k decline JAXA extent is still following the 2015 playbook remarkably closely:
Animation via NASA WorldView: https://go.nasa.gov/3axTEDu
P.S. See also:
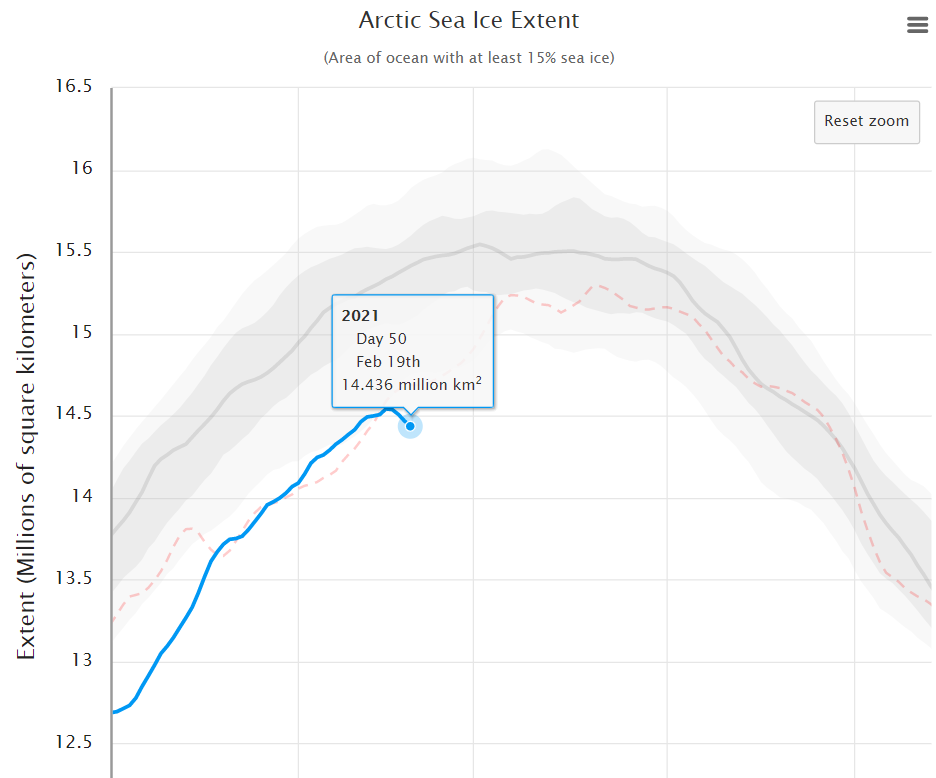
Now seems like a good time to compare JAXA AMSR2 extent with the NSIDC flavour of an Arctic sea ice extent metric, based on SSMIS data. JAXA still hasn’t rebounded significantly:
but Boulder has a problem. The NSIDC’s information is stuck on February 19th:
The first conclusion to hastily jump to is that the venerable DMSP F17 satellite has finally failed, but according to Thomas Lavergne the problem is actually on the ground:
According to Thomas Lavergne the SSMIS data is flowing to OSI-SAF once again!
Hopefully the NSIDC’s Charctic graph will update later today. Meanwhile JAXA extent is flatlining:

The current JAXA maximum still stands at 13.98 million km² on February 16th. The NSIDC 5 day average maximum is currently at 14.54 million km² on February 15th.
P.S. It’s nearly midnight UTC, and while Charctic is still stuck on February 19th this graph is now visible on the NSIDC “Arctic Sea Ice News & Analysis” page:
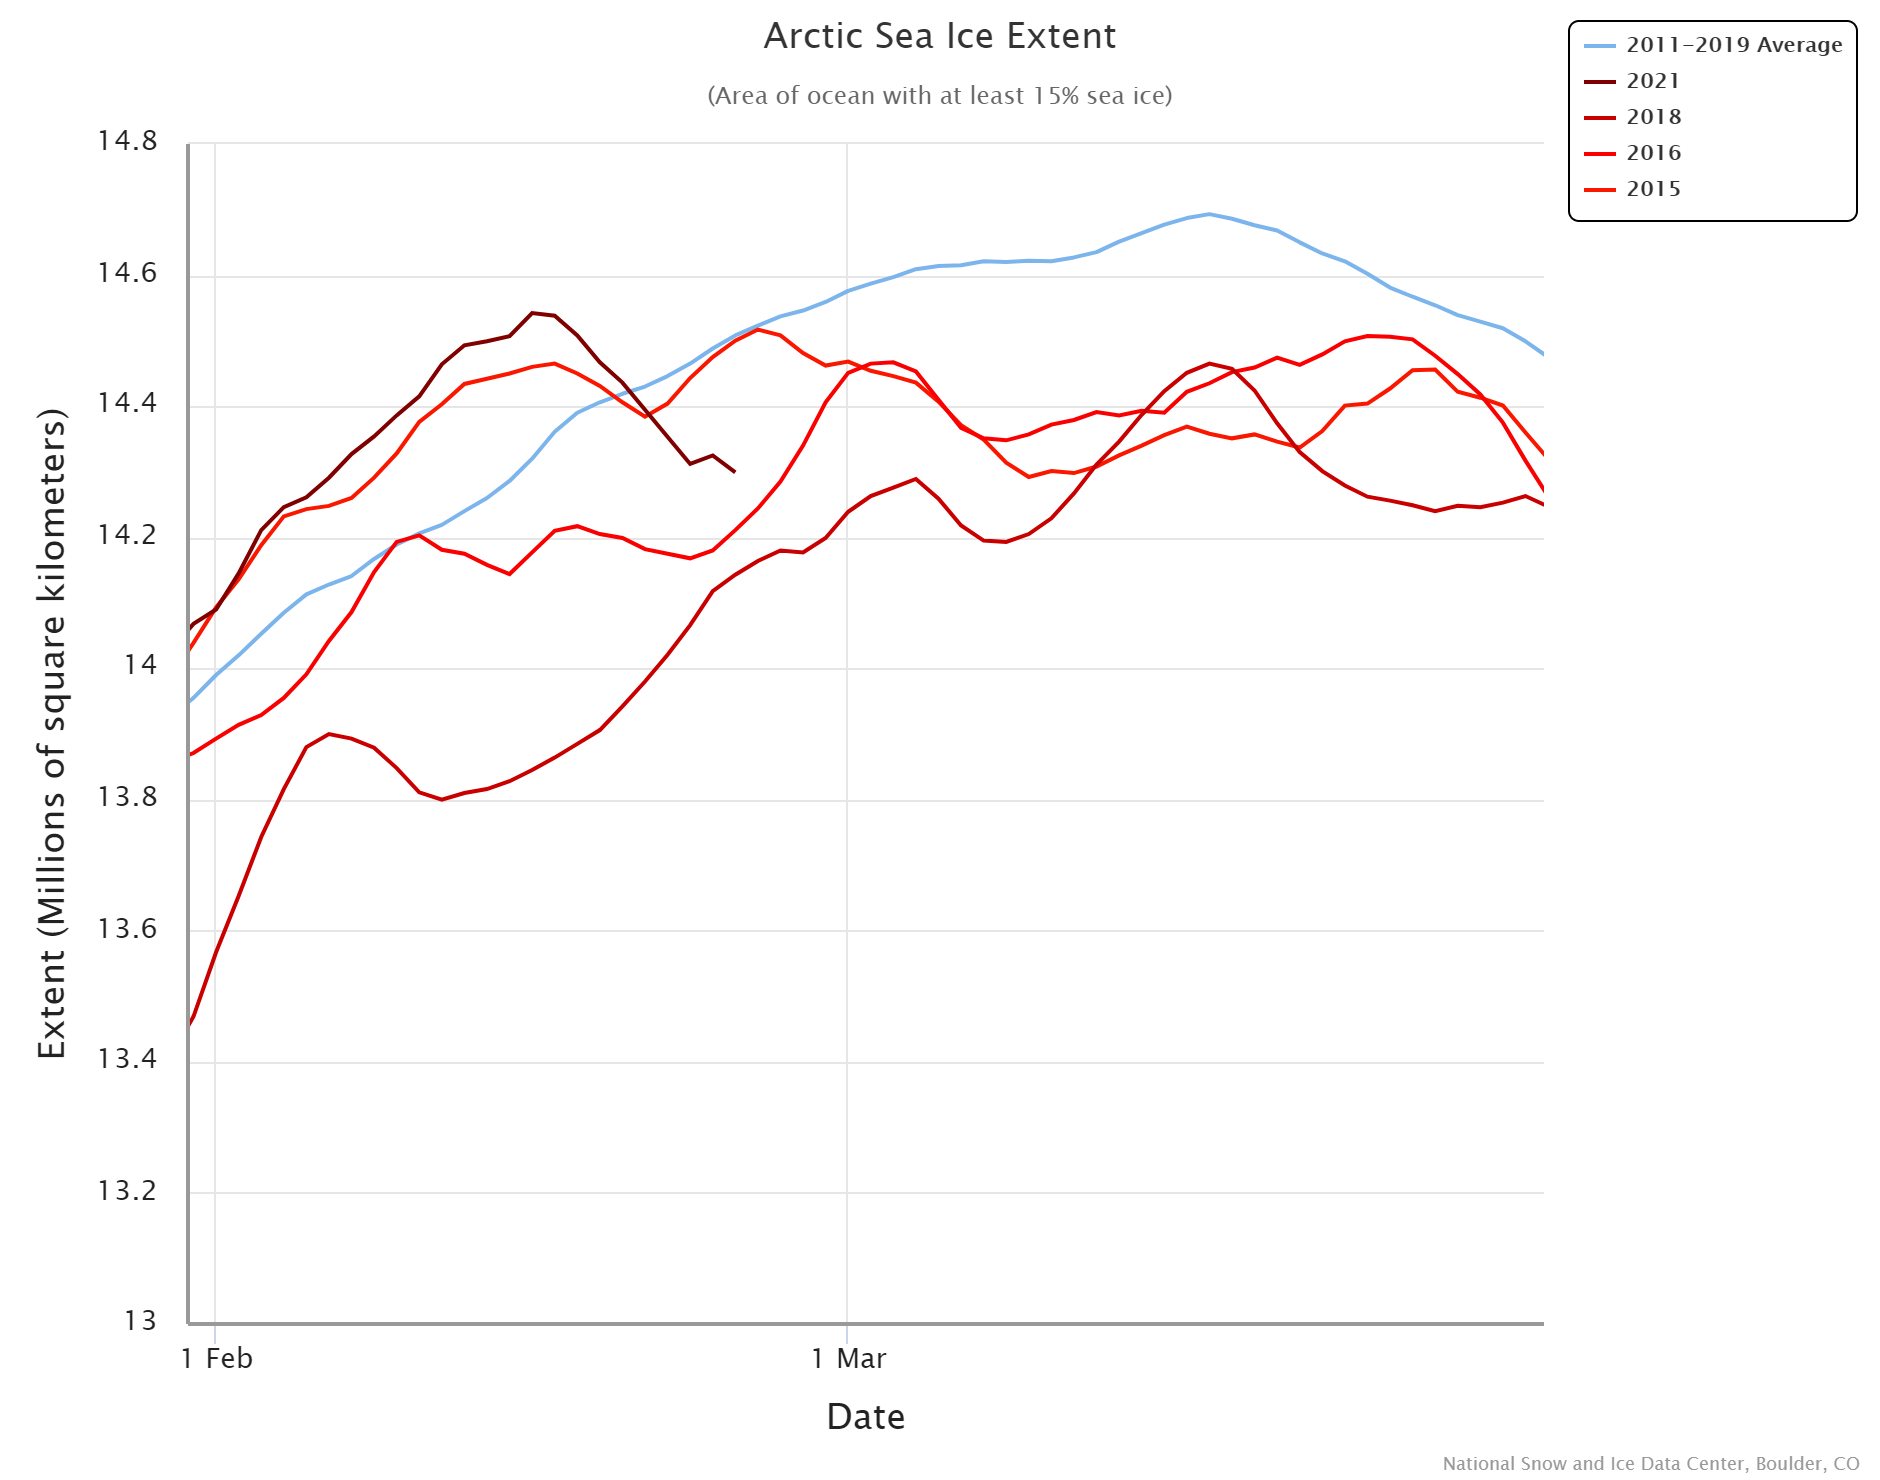
JAXA extent is still decreasing slowly, and is now 3rd lowest for the date in their records. Here’s a comparison with previous years with comparatively low maxima:
Another leg down for JAXA extent, which is now second lowest for the date:

The NSIDC’s Charctic graph is updating again, and currently looks like this:
Meanwhile via Thomas Lavergne on Twitter here’s a CMEMS forecast for a sudden surge in extent to well above the current maximum for 2021:
The NSIDC extent metric seems to be suffering further problems today, but AMSR2 soldiers on:
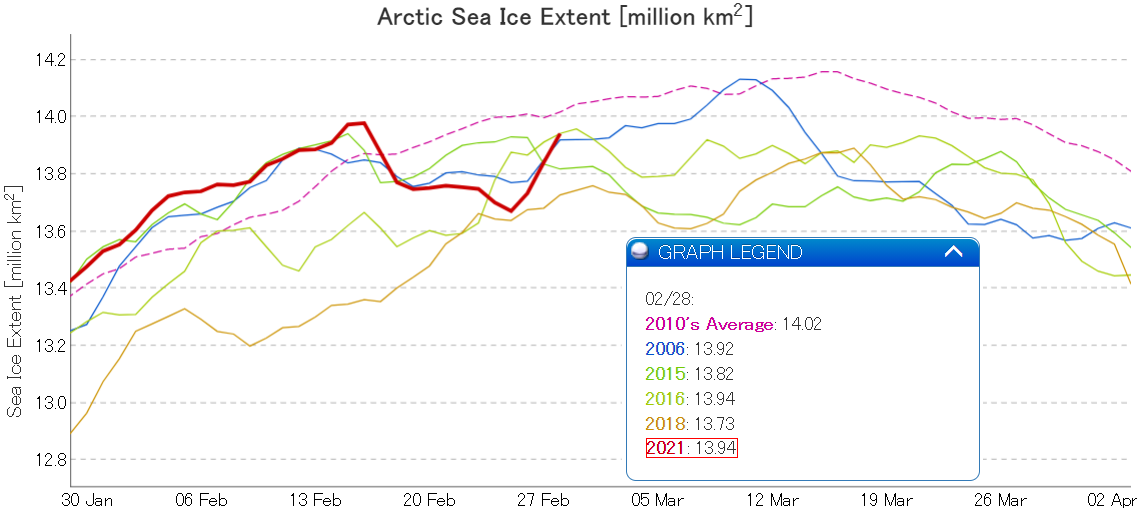
The long awaited “rebound” in Arctic sea ice extent has begun before JAXA extent reached “lowest for the date (in the satellite record!)”. Hence for completeness I’ve added in the curve for 2006:
The “rebound” in JAXA extent continues apace, with a 100k gain yesterday:
The latest CMEMS forecast from Thomas Lavergne suggests this will continue for a few more days:
Following another 100k km² gain yesterday JAXA extent is racing back towards the year’s high:
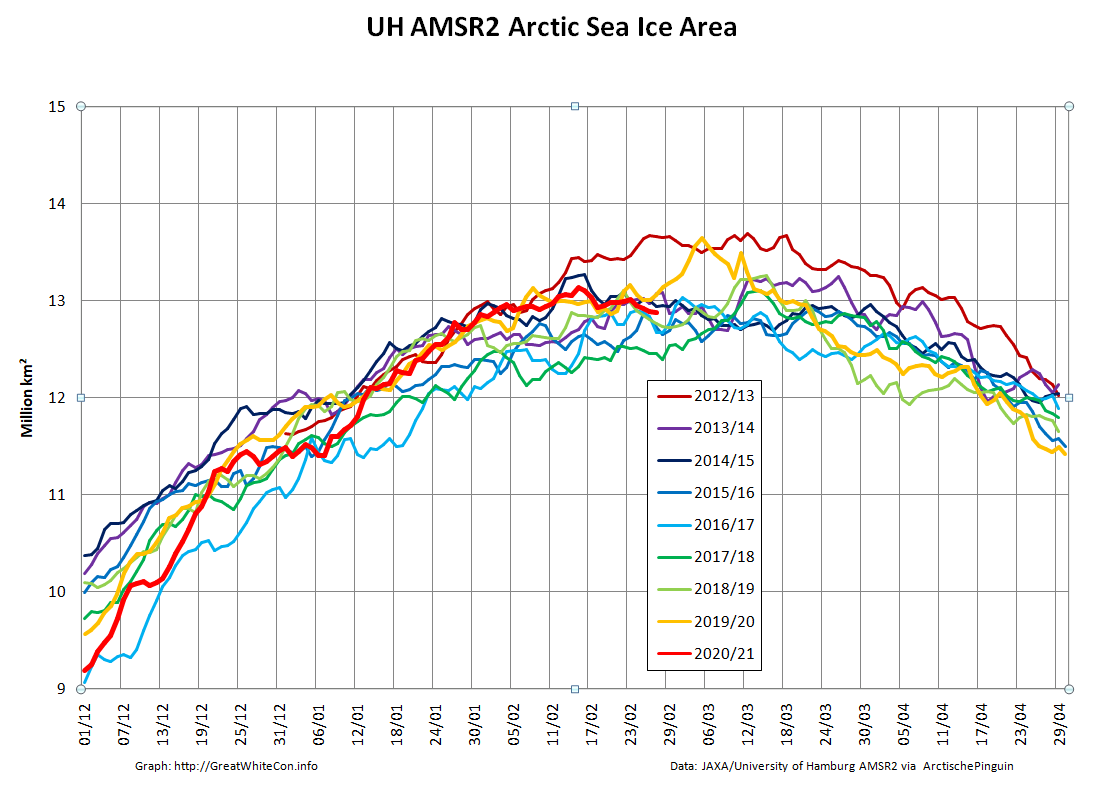
However high resolution AMSR2 sea ice area has yet to follow suit. Data to February 27th:
In another intriguing development, a strong cyclone is heading into the Bering Sea. Here’s a picture of it taken by the Suomi NPP satellite:
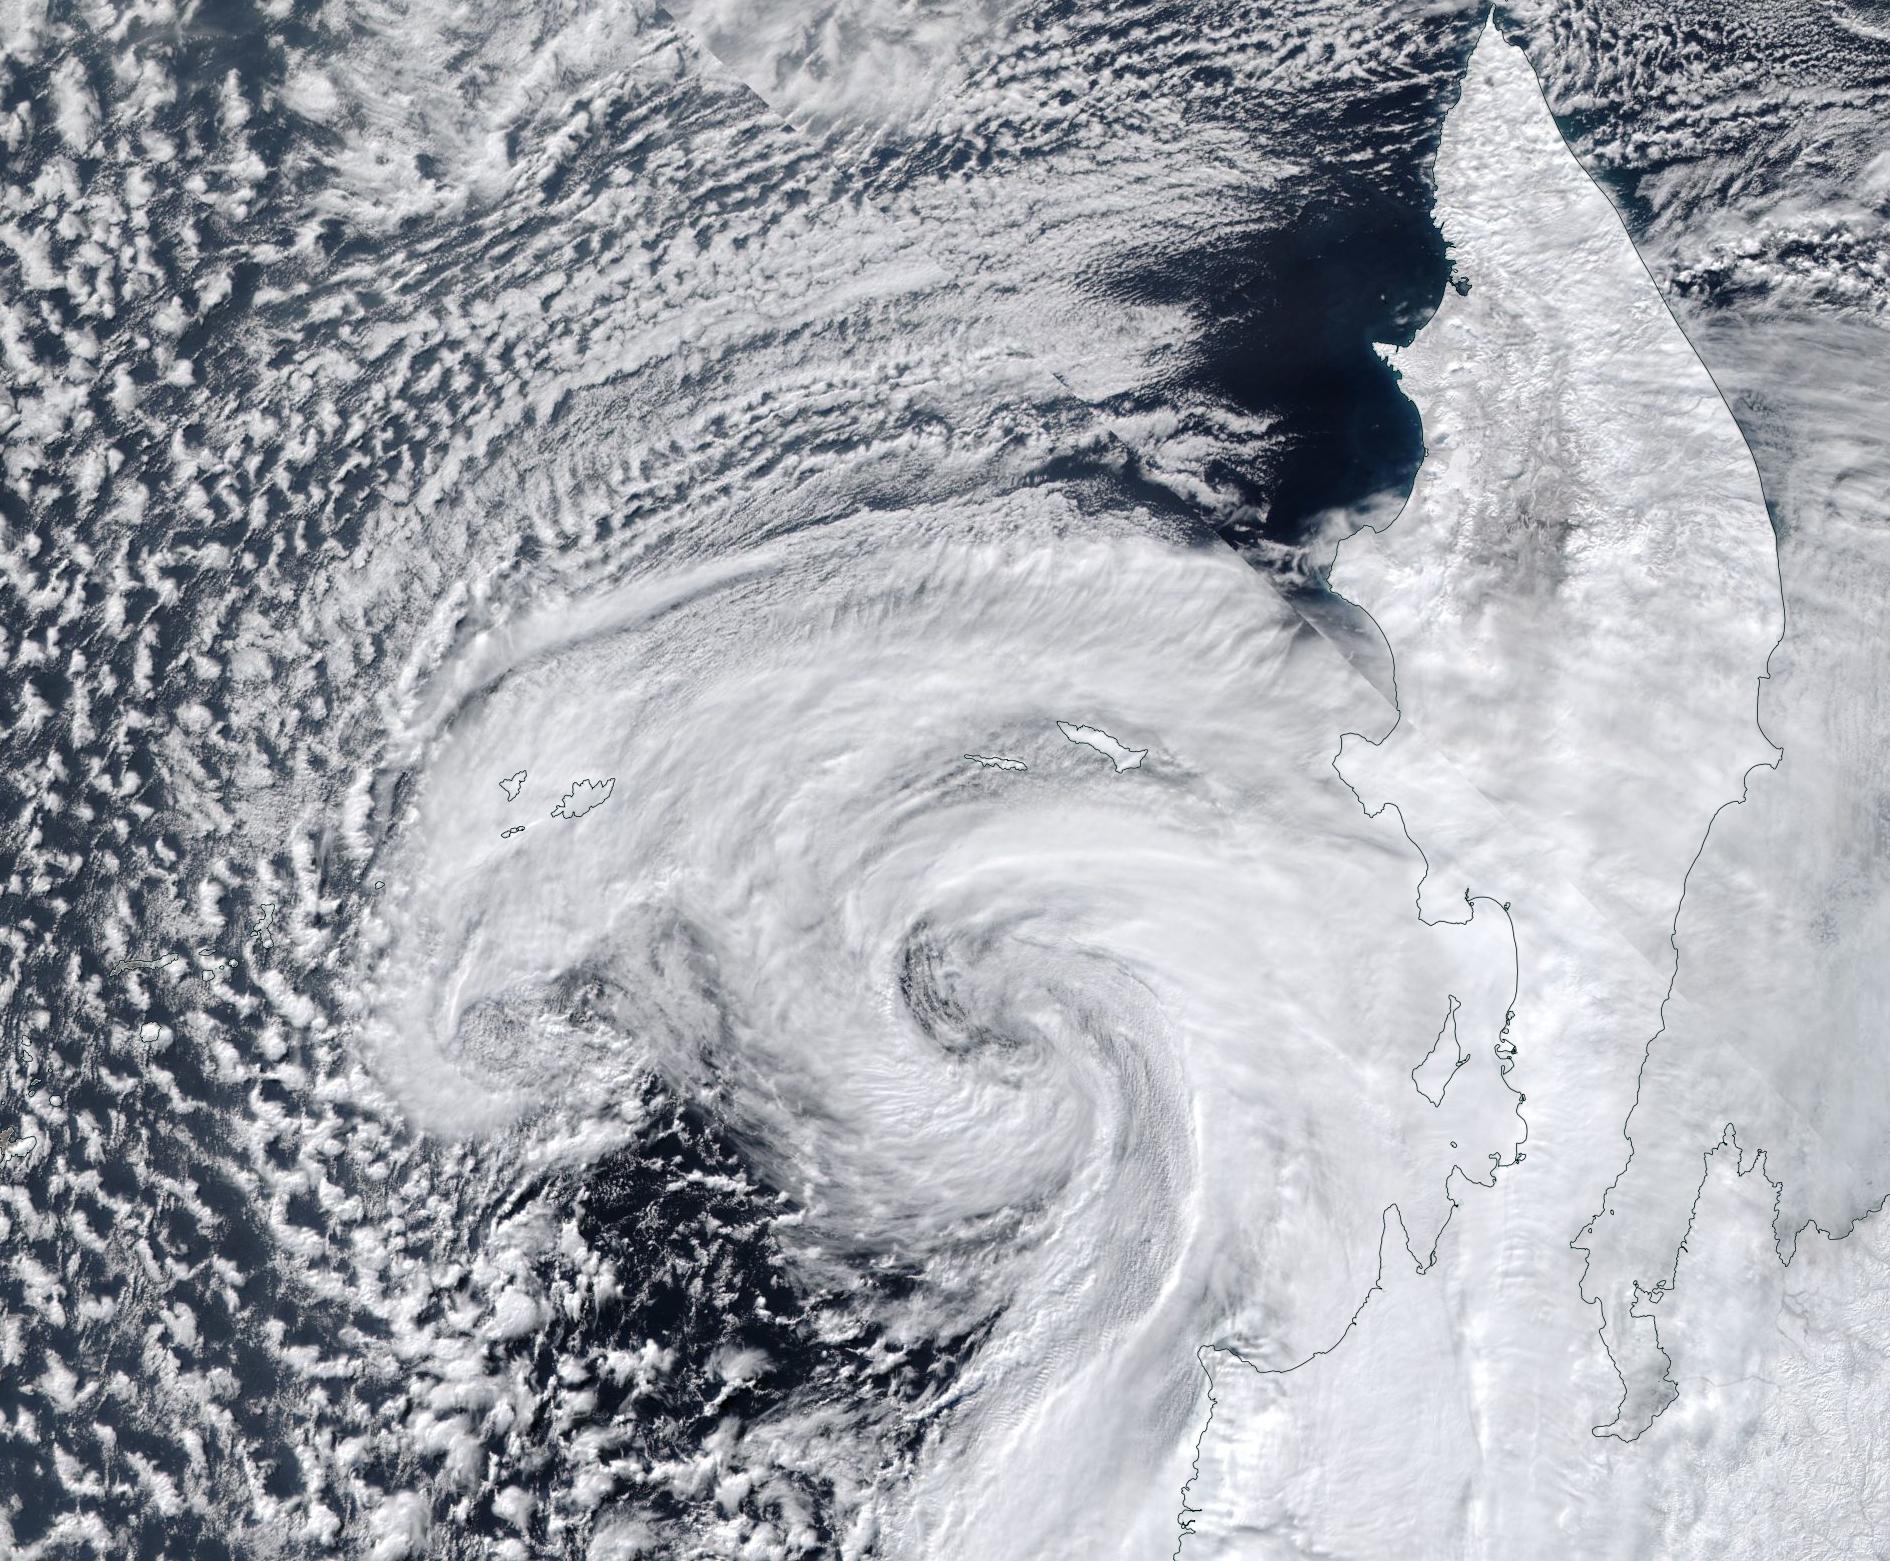
and here is the resulting “surf” forecast for the Bering Sea at midnight tonight UTC:

I cannot help but wonder what effect a huge swell directed straight at the ice edge in the Bering Sea will have.
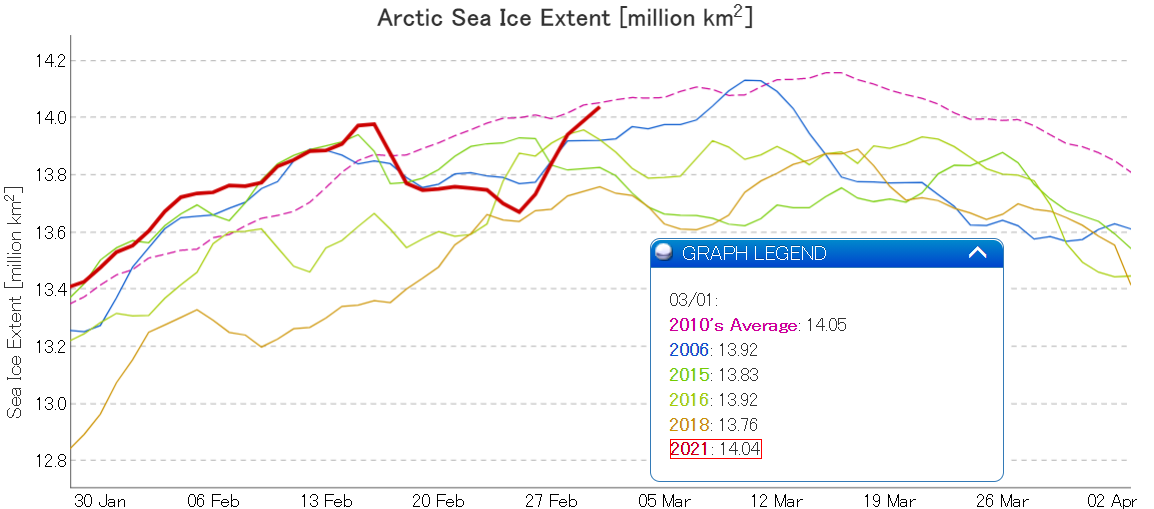
After yet another 100k km² gain JAXA extent has breached the 14 million level and reached a new maximum for the year:
The Bering Sea cyclone has been filling in today, but is now much closer to the ice edge:

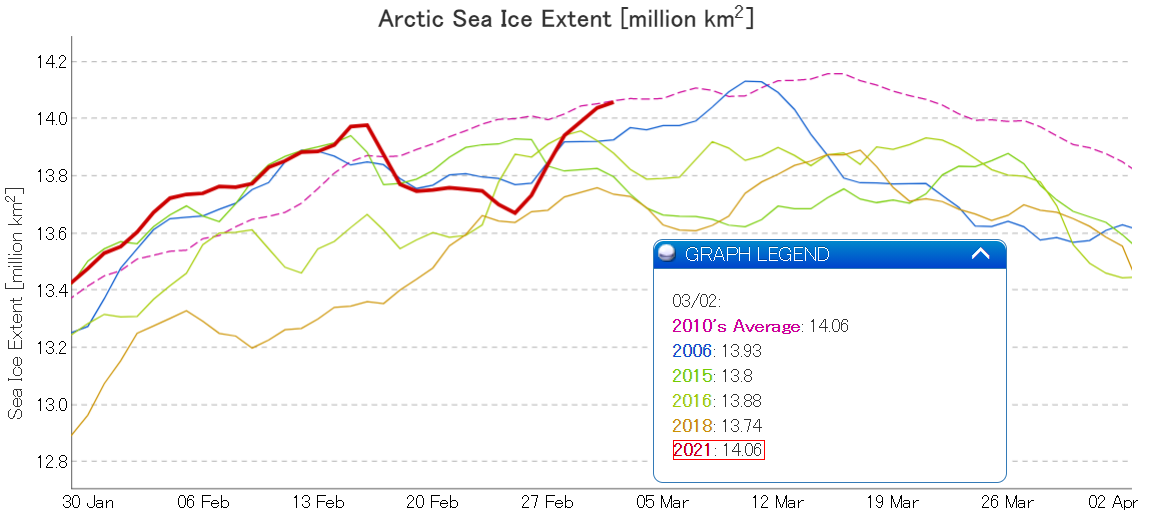
The JAXA extent trend is still up, but the rate of increase has decreased today:
Here’s a glimpse of the state of the ice in the Bering Sea following the recent cyclone:

Meanwhile NSIDC extent is still not updating, and another cyclone is heading for the Bering Sea:
Here’s the latest CMEMS forecast from Thomas Lavergne, with the added bonus of the OSI_SAF extent graph:
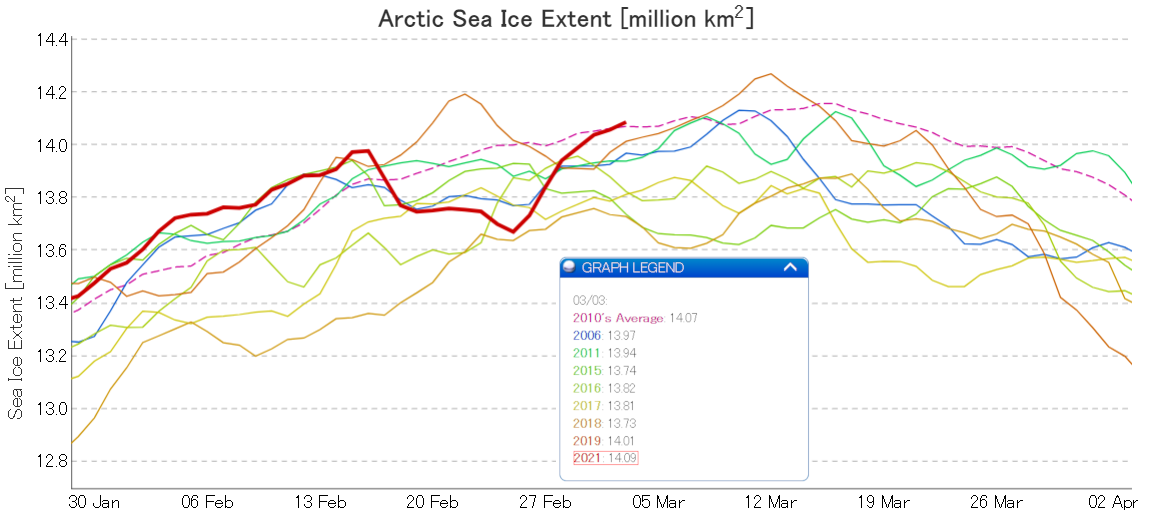
JAXA extent is still increasing, and hence my graph is getting more crowded with earlier years:
However note that sea ice area is still well below the initial peak on February 15th:

The NSIDC’s Charctic extent graph has burst into life again, to reveal extent still rising:
JAXA concurs:
High resolution AMSR2 Arctic sea ice area has also reached a new maximum for the year:
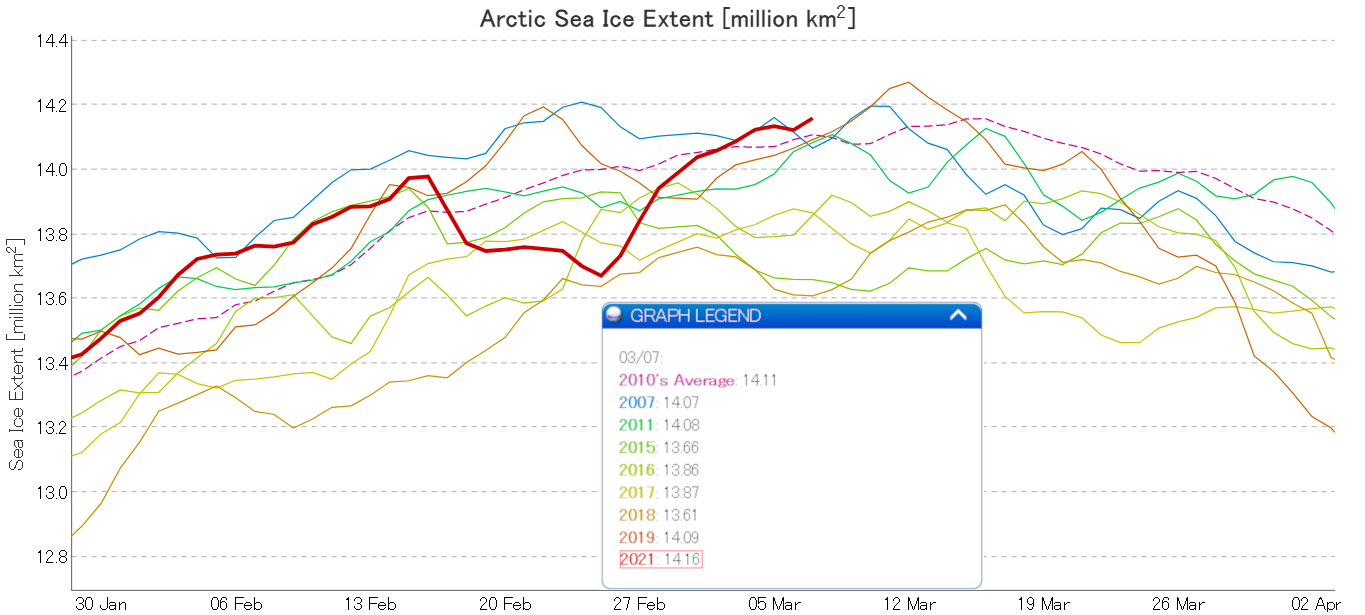
JAXA extent has finally recorded another down day:
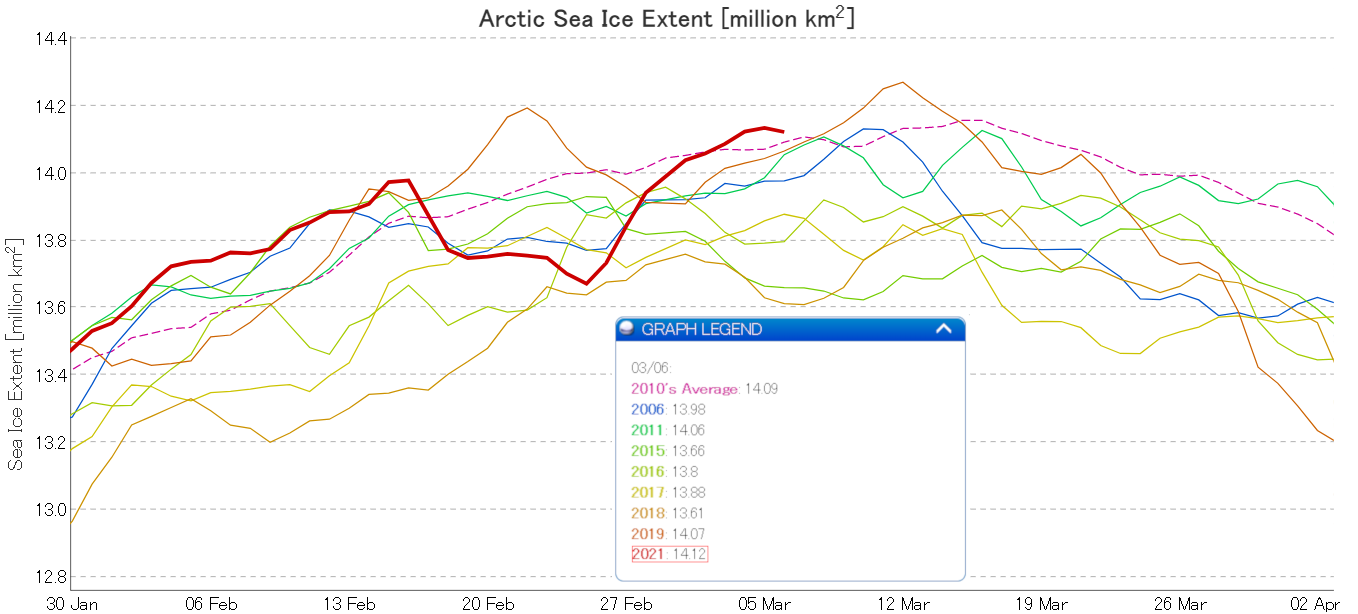
The extremely tentative new JAXA maximum is 14.14 million km² on March 5th.
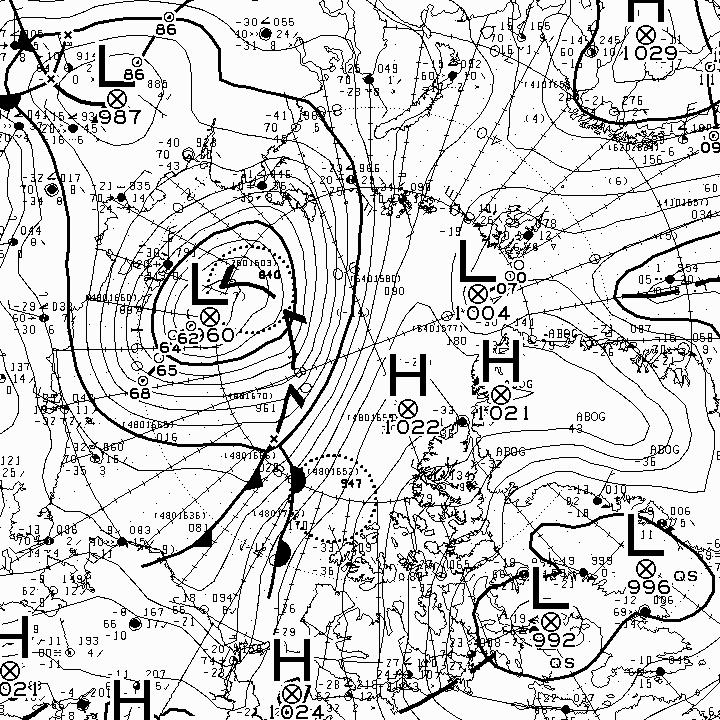
Yet another cyclone is spinning on the Pacific side of the Arctic, but this one is forecast to move over the central basin rather than just the periphery. Here’s the current Environment Canada synopsis at 12Z:
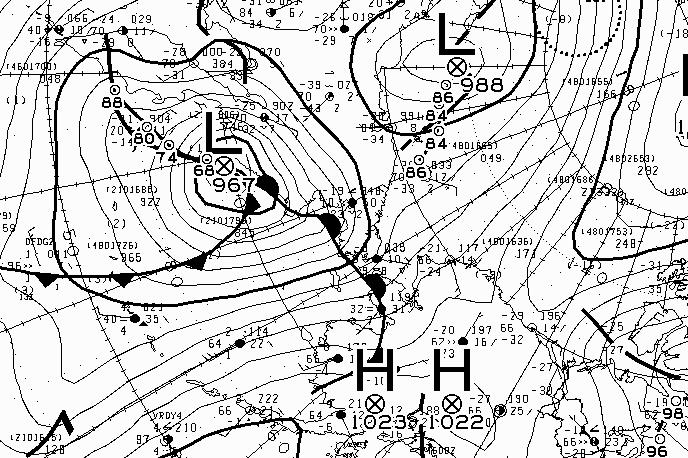
Plus the US Navy’s ice drift forecast for March 10th:
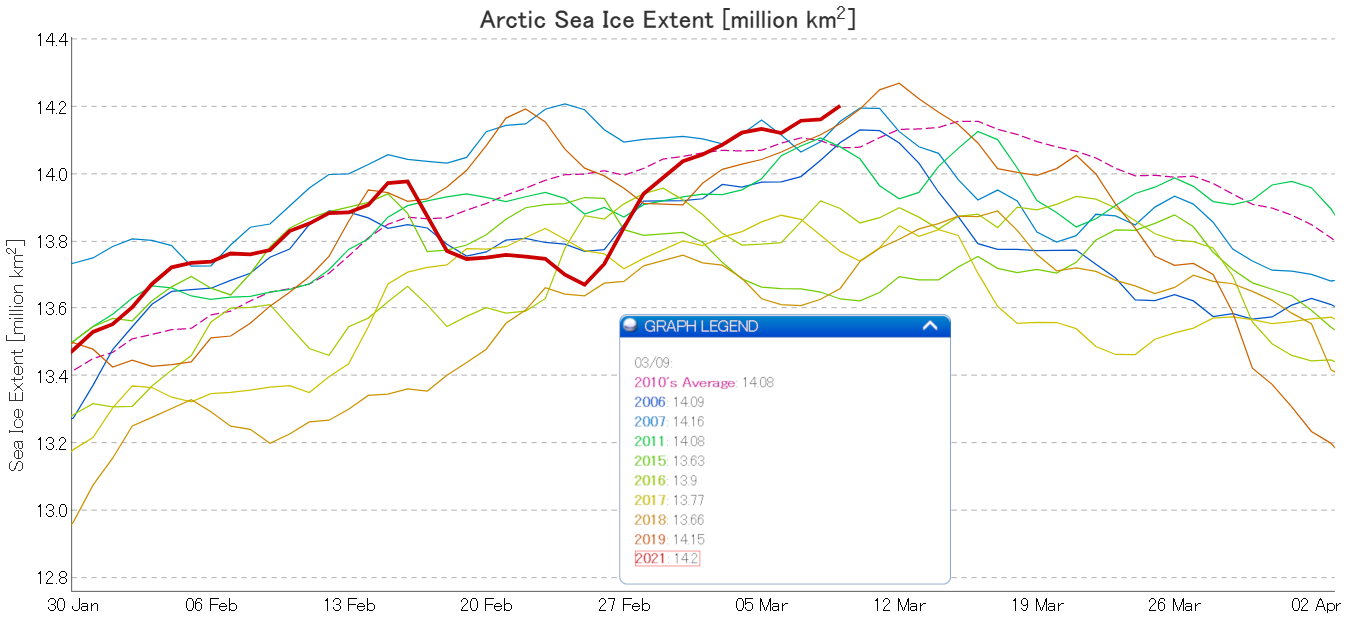
Another leg up for JAXA extent. Hence I’ve added 2007 to the list of years that 2021 extent is now greater than:
JAXA extent is still increasing:
and the most recent in the current sequence of Arctic cyclones appears to have bottomed out with a central MSLP of 960 hPa according to Environment Canada:
By way of comparison note that the “Great Arctic Cyclone” of August 2012 reached a minimum MSLP of 966 hPa.
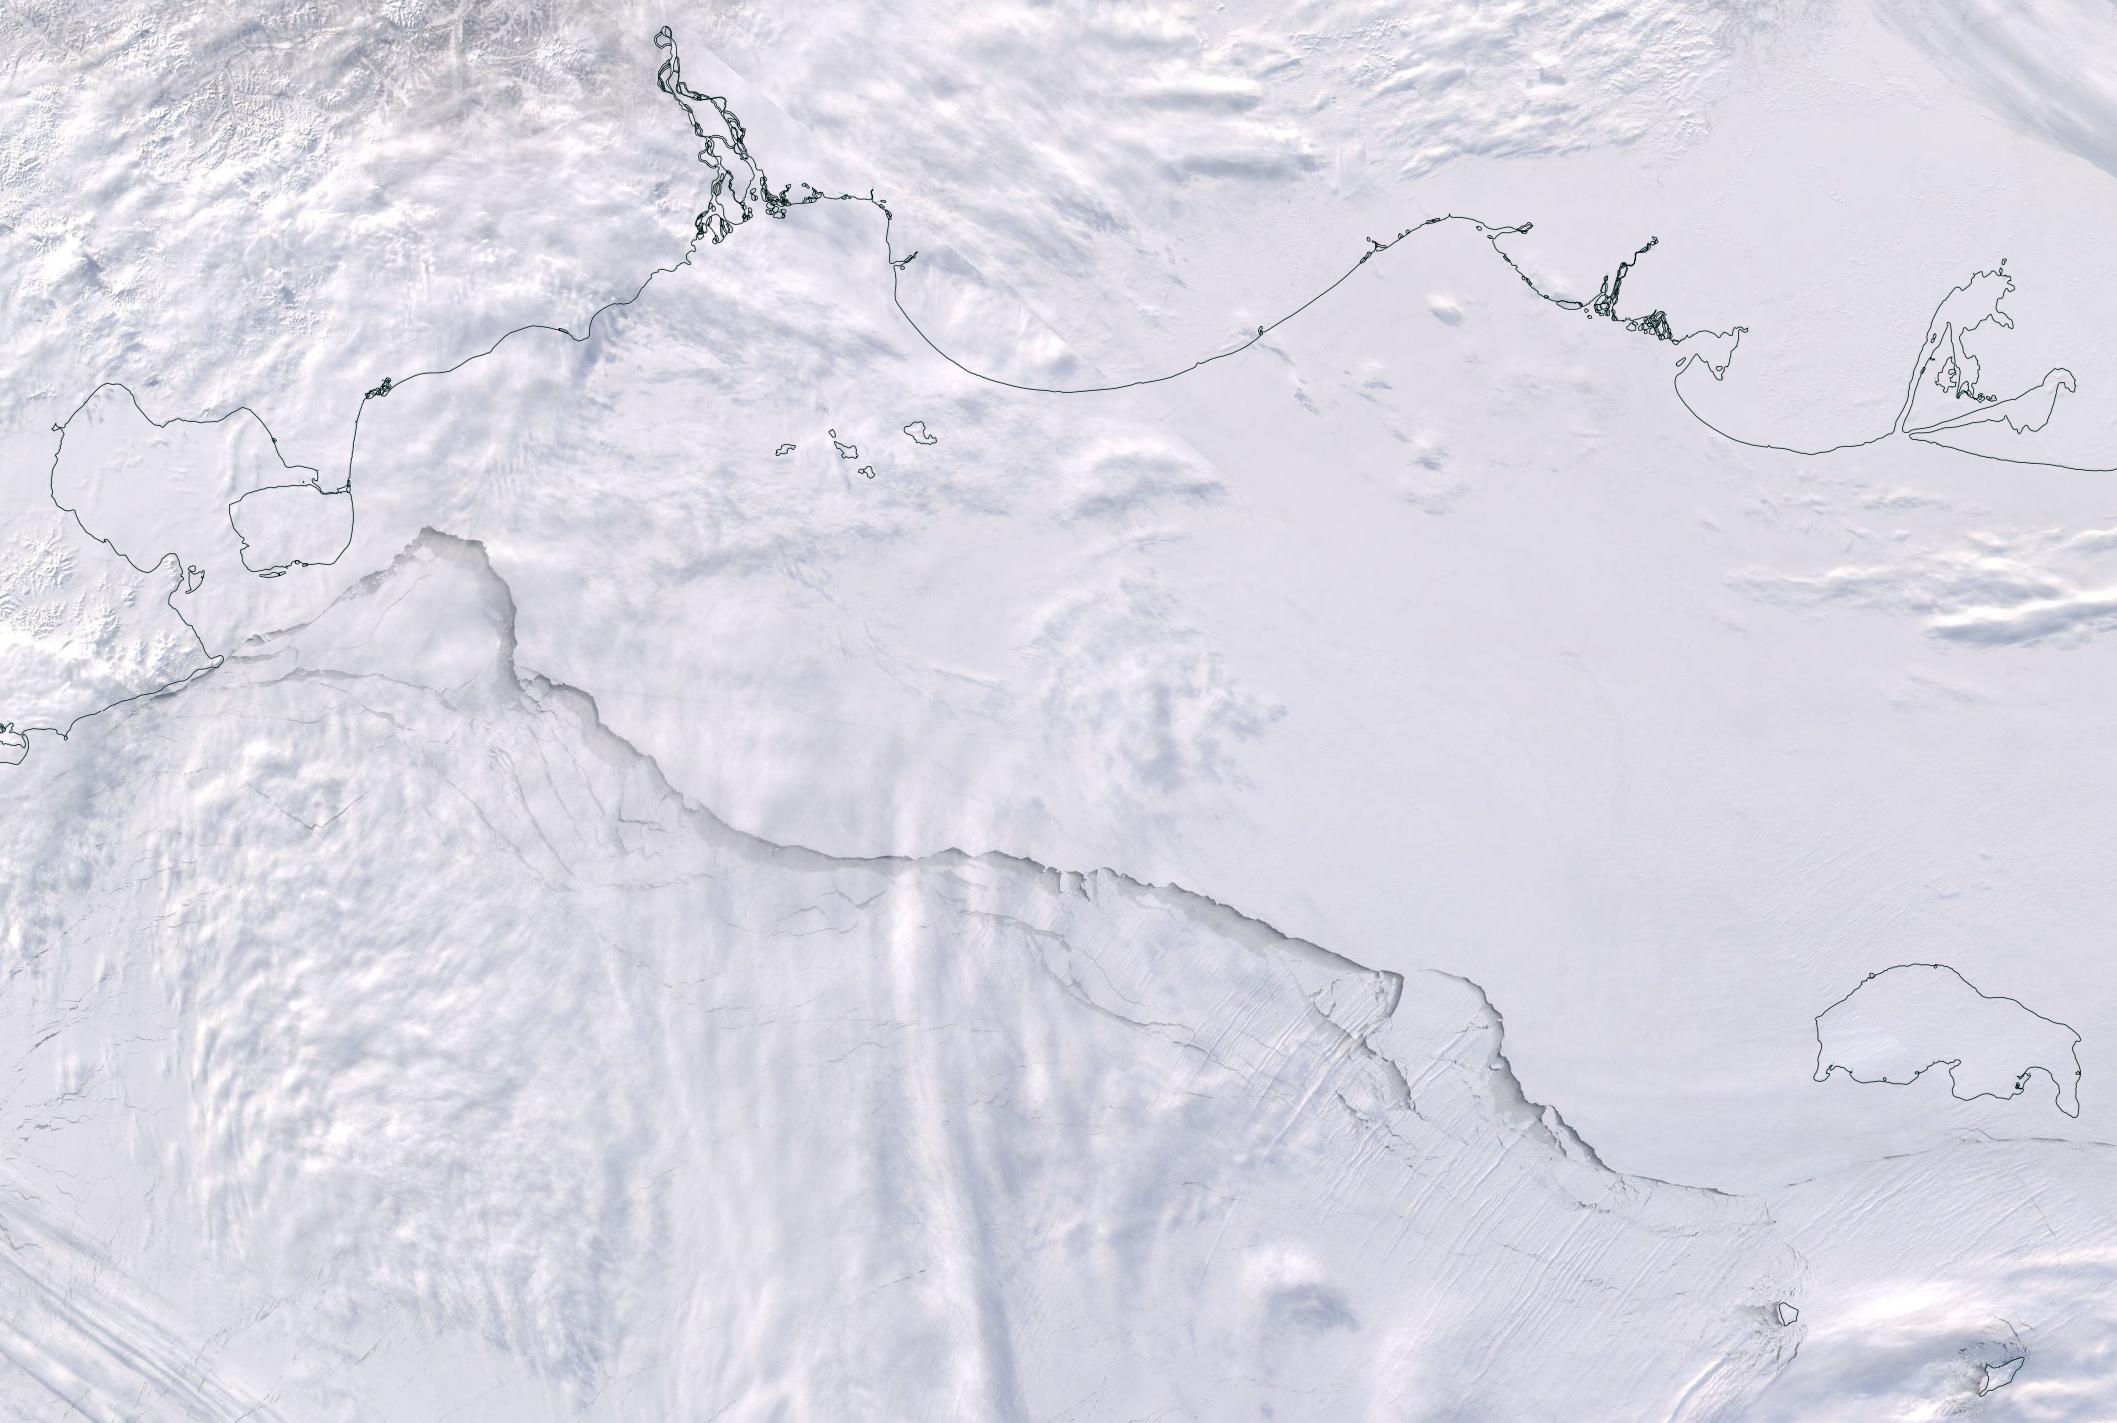
The most obvious effect of the passage of the cyclone has been the opening up of this by now refrozen lead along the edge of the fast ice in the East Siberian Sea:
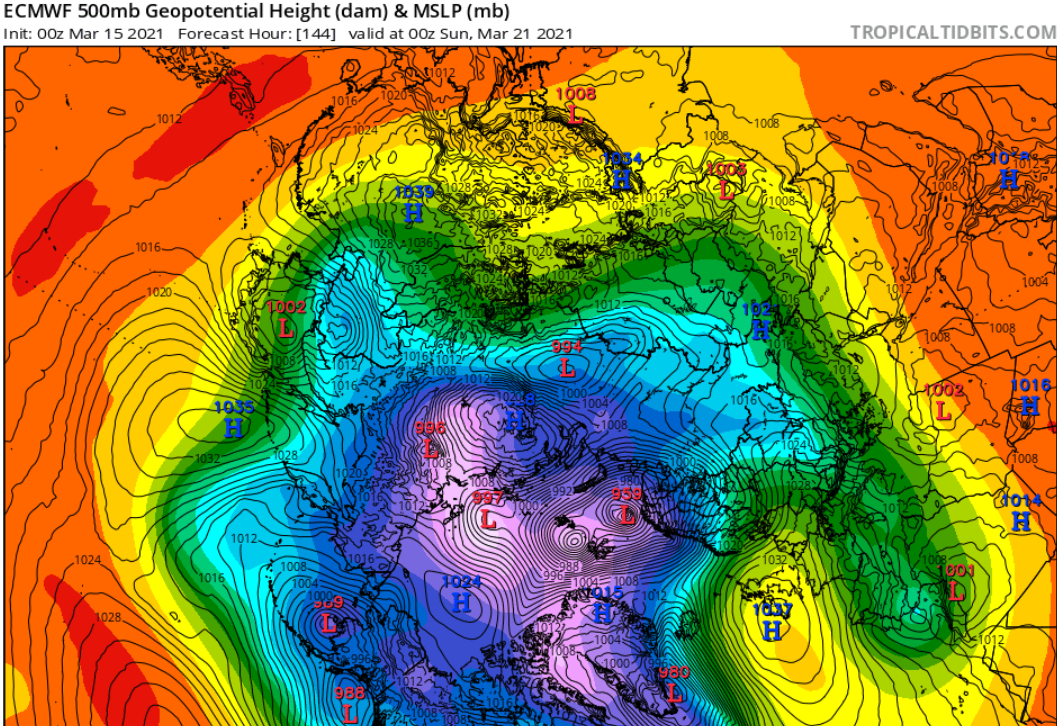
There are more Arctic cyclones on the way. Here is the ECMWF forecast for 0Z on Saturday, courtesy of TropicalTidbits:
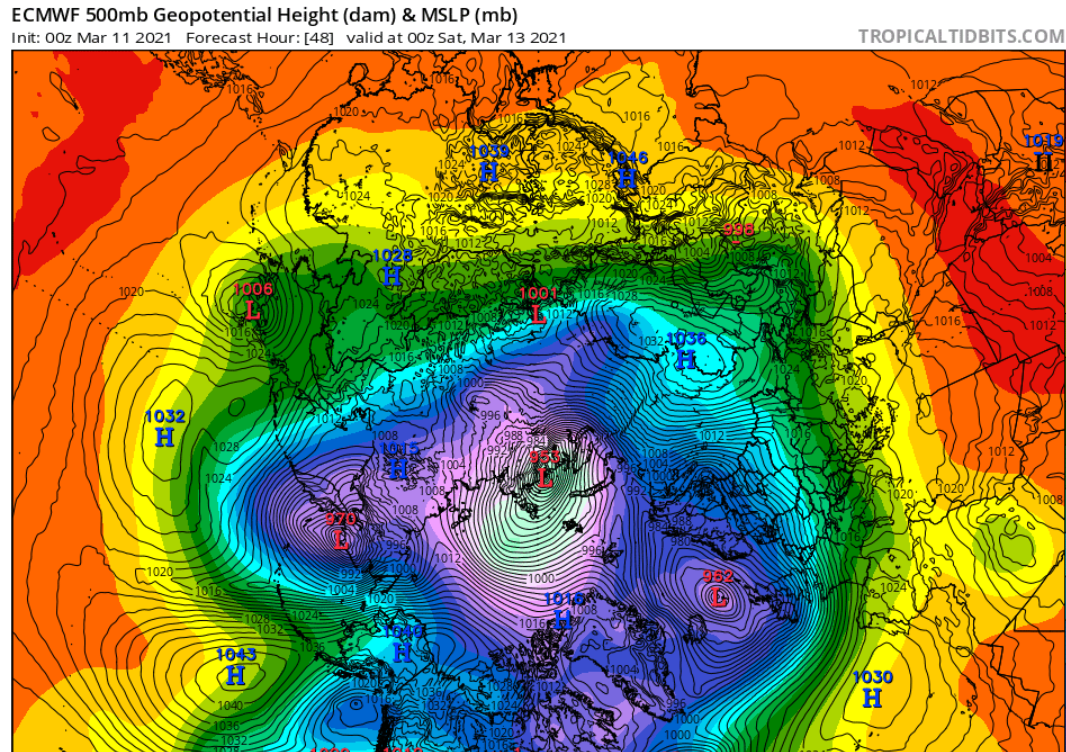
There’s a 953 hPa MSLP cyclone over the Kara Sea, plus 970 hPa arriving in the Bering Sea. The isobars are also closely packed over the Fram Strait, so what with one thing and another it looks as though the 2021 maximum extent is still some way away.
JAXA extent is declining quickly once again:

The slightly less tentative maximum is now 14.24 million km² on March 10th.
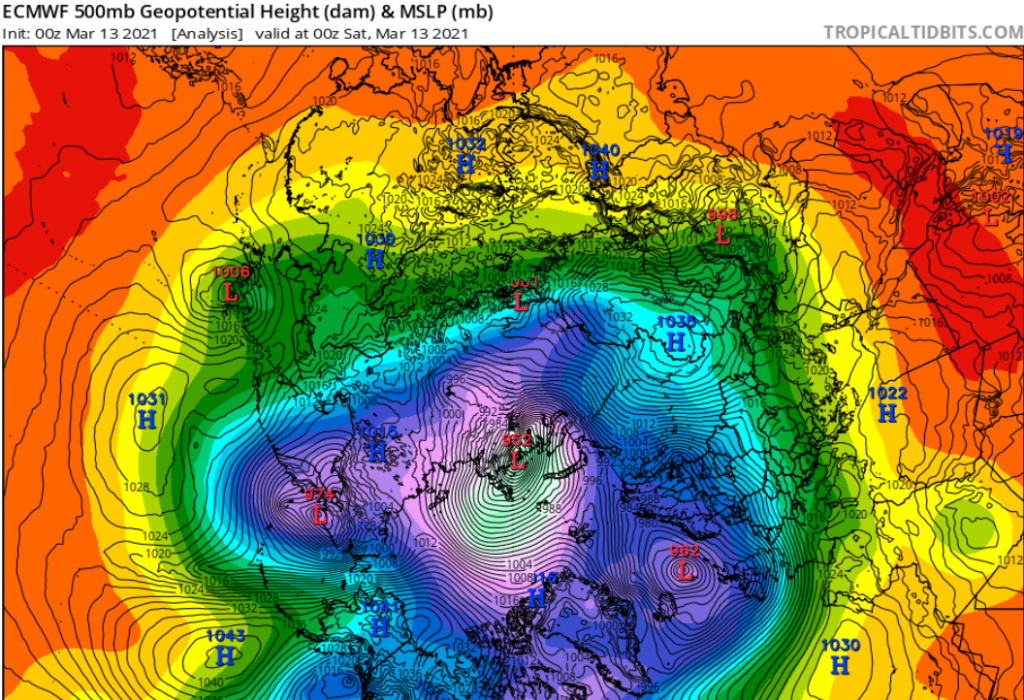
The world’s assorted meteorological offices have different opinions on the minimum MSLP of the Kara Sea cyclone. GFS went for 950 hPa, but ECMWF settled for 952:
The next sub 970 hPa cyclone is currently forecast to enter the Central Arctic from the North Atlantic in a week or so. That’s still a long way off though, so we’ll take another look at that in a few days time.
JAXA extent is still declining, so the tentative maximum is looking more secure by the day. The NSIDC’s 5 day average is declining more slowly, but currently reveals a maximum of 14.75 million km² on March 12th:

The forecast cyclone on the Atlantic side of the Arctic changes from day to day and from model to model. However the ECMWF currently show it bottoming out at 959 hPa over the Barents Sea at 0Z on Sunday 21st:
Sunlight is now reaching 80N and beyond, so it is now possible for MODIS to see through the clouds and observe wind driven sea ice breaking up north of Svalbard:
NSIDC 5 day averaged extent has just posted a new maximum for the year. 14.767 million km² to be (overly?) precise:
JAXA, on the other hand, seems more than content to stick with the existing maximum:
All the extent metrics are now declining in unison, and the continual sequence of strong Arctic cyclones has paused for the moment. Barring unforeseen circumstances that leaves the 2021 Arctic sea ice maximum extent numbers as follows:
UH/Wipneus AMSR2 – 13.97 million square kilometres on March 11th
JAXA/ViSHOP AMSR2 – 14.24 million square kilometres on March 10th
NSIDC 5 day SSMIS – 14.77 million square kilometres on March 21st
NSIDC 1 day SSMIS – 14.87 million square kilometres on March 11th
OSI-SAF 1 day SSMIS – 14.99 million square kilometres on March 10th
P.S.
The NSIDC have now issued a press release announcing the 2021 maximum extent:
Arctic sea ice has likely reached its maximum extent for the year, at 14.77 million square kilometers (5.70 million square miles) on March 21, 2021, according to scientists at the National Snow and Ice Data Center (NSIDC) at the University of Colorado Boulder. The 2021 maximum is tied with 2007 for seventh lowest in the 43-year satellite record.
Please note that the Arctic sea ice extent number is preliminary—continued winter conditions could still push the ice extent higher. NSIDC will issue a formal announcement at the beginning of April…
In addition NASA have produced a video to mark the event:
Watch this space, just in case!
Here’s yesterday’s cyclone in the middle of the Bering Sea with an MSLP of 962 hPa. Earlier it reached as low as 948!
Several of the wave buoys in the area seem to be out of action at the moment, but buoy 46073 recorded a peak wave height of 43 feet:
with an average period of almost 13 seconds:
Thanks for all the work.
I have been following it at the Arctic Sea Ice Forum but your blow by blow seems a little more intuitive.
Does the ice extent fall with a cyclone and experience a rebuild after always or does the wind direction play a more important role?
200,000 shifts up or down in a week is a concern in so many ways as to the values we place on a lowest year or a set of rebound years.
Thanks for your kind words angech.
Extent can rise or fall during a cyclone depending on the path of the cyclone relative to the ice edge, frequently doing both in quick succession!
The rapid rate of compaction/dispersion during the current sequence of cyclones suggests to me that the ice on the Pacific periphery is more mobile than it used to be a few years ago. Or perhaps the cyclones are stronger? Or both?!
At the very least it suggests the sea ice in question won’t survive for long once the 2021 melting season starts in earnest.
“A concern in so many ways” as you put it.
Nice to have your analysis again, Jim. Extent is a tricky metric. Have a 950 hPa blow in August and the warm water makes the extent plummet. The same intensity in dead of winter with temps at -25C and you get an ice factory. It may be a week or so before we see a max (depending on source), and it’s anybodies guess when max volume will occur (my guess is a bit after mid-April). These storms and subsequent skim-overs/compaction will drive volume. Looking forward to your volume analysis now that PIOMAS has finally got the February update out.
Thanks for your kind words Taylor. Volume analysis has been available here since March 3rd! I’ve just added the University of Washington’s thoughts.
It’s not really “the dead of winter” any more on the Arctic periphery. Whilst in the short term there will be a modest volume increase the winds are currently driving ice out of the basin into the (comparatively!) warm waters of the far North Atlantic:
It remains to be seen what impact that has on the eventual Autumn minimum. Here’s the Pacific periphery for completeness:
There’s a lot of thin ice in the Sea of Okhotsk ready to swiftly vanish into oblivion once the 2021 melting season gets underway:
I note with some interest that NSIDC, MASIE and DMI have all shown upticks over the past few days, and in the same timeframe, Greenland has been showing near-record ice mass gains – are we in for a surprise late season extent high?
High resolution AMSR2 extent has reversed again just short of a new high:
With another cyclone hovering near the ice edge, time will tell!
It may not be ‘dead of Winter’ on the periphery, but with DMI showing -25C above 80 degrees N, it’s not Spring yet either. I noticed NSIDC is showing a (very slight) new high in extent, while DMI and MASIE are showing a slight down tick and no new high. Alas, this is the time of year where different resolutions, techniques and sourcing make for ‘reality uncertainty’. A few weeks time should resolve it, per history.
However, with it that cold in the central Arctic, we’ve still got some for volume to grow…
Central freezing will increase volume faster than the melting periphery reduces it for a few more weeks.
However taking the freezing season as a whole it has been comparatively mild in the high Arctic:
Yes, I agree about fairly mild overall season, but what ‘cumulative degree days’ obscures is the relatively mild fall vs. the current (-28C yesterday) bitter conditions. Likely that mild fall was driven by a lot of exposed water, especially on the Siberian side, which is now protected with a thick layer of ice. Had we experienced a more typical fall, this year’s cumulative graph would be in the middle of the pack. For volume, later cold is better than early cold. We’ll see what this means for the coming month. I don’t have any source for long term temp/weather forecasts, so can only guess at this point.
“For volume, later cold is better than early cold”.
Why do you say that? It seems to me that the opposite is the case. Early “mild” spells of weather may well deposit snow on the surface of the ice which acts as insulation when the “later cold” arrives.
BTW, given that this is the Extent post, and not the Volume one, I should note that the recent peak in extent is the last gasp, so to speak, and it will be interesting to see the final roundup from all the sources, likely next week, I should think.
The NSIDC haven’t called it yet, but I reckon extent has now gasped its last for 2021.
See: https://GreatWhiteCon.info/2021/02/the-2021-maximum-arctic-sea-ice-extent/#Mar-25
Famous last words?
https://twitter.com/Permafrostee/status/1374788046252605456/photo/1
(* Might come in handy?!!?)
It may indeed. Thanks for the heads up.
The link to the “Permafrost Atlas” referred to:
https://doi.org/10.4095/328115
…and just for fun: THIS GUY appears to be better than Michael Jordan, Kobe Bryant and Zion Williamson,
https://www.news.com.au/sport/american-sports/nba/russell-westbrook-sends-nba-into-meltdown-with-absurd-tripledouble/news-story/eb523cef928220b519de52a0e1e5b8e1
I’m afraid I’m from the wrong side of the pond.
“Absurd” I comprehend, but what on Earth is a “triple double”?
This is more my sort of thing:
See also:
https://GreatWhiteCon.info/tag/gwcabbwfsc/
A triple-double is scoring double figures in three statistics. Apparently this guy has done that 168 times in his career or something(5 seasons my nephew told me…).
They think he should easily go onto break the record of 180-odd set by some obviously famous guy I forget the name of now.
I think this season he has already set 16 triple-doubles in 38 games and even though I’d never heard of him has been lauded as one of the leagues most consistent performers.
Jim,
Any thoughts on the recent ‘stall’ in sea ice extent reduction? Both NSIDC and DMI show little reduction lately, and DMI has it currently within the 25-75% quartile. Is that consistent with other metrics? DMI daily volume seems relatively flat as well, so I wouldn’t think the extent is a result of ice breakup or scattering. The month is done, so this will affect April reporting. Thoughts?
The end of month Fram Strait export numbers will be interesting!
Some of the thickest ice remaining in the Arctic has been consistently driven by recent winds into the “death zone” that is the current “far north Atlantic”. See for example:
https://GreatWhiteCon.info/2021/04/facts-about-the-arctic-in-april-2021/#Apr-27
Short term this results in a slow decline in extent for the time of year. However I confidently predict a swift decline in volume over the medium term:
YMMV of course!
My brother is a surfer and that Nazares place is ridiculous: you couldn’t even see the guy compared to the size of the wave.
I believe Kelly Slater doesn’t like big wave surfing so it requires a special skill set I suppose. I heard some famous Australian ran into some trouble a while back but my brother doesn’t surf big stuff like that. He’s taken me to Margaret River a few times and I just get scared watching them. He doesn’t take off from the same point of the wave as some of his mates and I’m not sure if he’s ever surfed the main break but he has surfed Cowamerup Bays Northpoint which I’m glad I did not watch.
Some people, ay!
I do not know if any of you have studied ice core records.
It appears not, you all seem to be more alarmed by years of less sea ice.
Ice core records show that the ice accumulation on Greenland is most in Warmest years. Warm times with open Arctic is necessary for the evaporation and precipitation of snow on Greenland to rebuild the great treasure of ice that is pushed into the warm tropical current to chill the water and form sea ice again.
Sea ice is removed in warm times and evaporation and snowfall and sequestering of ice is increased. More ice spreads and dumps into the oceans and cools the climate and forms sea ice that stops the evaporation and snowfall until the sequestered ice is depleted. Then the cycle repeats.
Hi Alex,
However unfortunately for that theory the evidence is that currently Arctic sea ice mass is decreasing concurrently with Greenland land ice mass decreasing too: