Our title for today is a reference back to a 2015 article by Paul Homewood on his “Not A Lot Of People Know That” blog, in which he told a load of old porky pies about the National Snow and Ice Data Center’s graphs of Arctic sea ice extent. Only last week Mr. Homewood cooked up another pile of porky pies concerning the Danish Meteorolical Institute’s Arctic sea ice extent metric. Now he has turned his pie baking skills to the Multisensor Analyzed Sea Ice Extent (MASIE for short), which is “a prototype collaborative product of the National Ice Center and NSIDC”.
Mr. Homewood obviously hadn’t done a whole lot of homework on MASIE before firing up his porky pie production line, since he used the self same recipe posted on the so called “Science Matters” blog of Ron Clutz shortly before. In fact he just reprinted the first part of Ron’s article and added a handy link to Ron’s even bigger pile of porky pies beneath it. Hence both Paul and Ron’s web sites currently proudly proclaim that:
Something strange is happening in the reporting of sea ice extents in the Arctic. I am not suggesting that “Something is rotten in the state of Denmark.” That issue about a Danish graph seems to be subsiding, though there are unresolved questions. What if the 30% DMI graph is overestimating and the 15% DMI graph is underestimating?
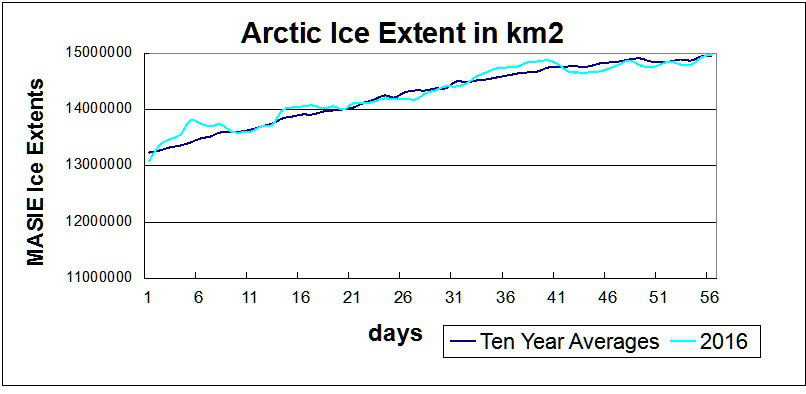
The MASIE record from NIC shows an average year in progress, with new highs occurring well above the 2015 maximum:
While I am compelled to agree with Ron and Paul that “something strange is happening in the reporting of sea ice extents in the Arctic” we disagree about everything else! One reason for that is because only a few days ago I interviewed NASA scientist Walt Meier following a suggestion by Ron Clutz that I do precisely that. Please read the edited highlights of that interview, and note in addition that Walt assured me that he had not previously been contacted by either of Messrs. Clutz and Homewood. Having never previously contacted Mr. Meier, here’s what Ron Clutz would have his loyal readership believe this weekend:
NOAA Is Losing Arctic Ice
Why the Discrepancy between SII and MASIE?
The issue also concerns Walter Meier who is in charge of SII, and as a true scientist, he is looking to get the best measurements possible. He and several colleagues compared SII and MASIE and published their findings last October. The purpose of the analysis was stated thus:
Our comparison is not meant to be an extensive validation of either product, but to illustrate as guidance for future use how the two products behave in different regimes.
Here is what Dr. Meier’s peer reviewed paper from October last year concluded on the matter:
Operational modelers require timely data that are as accurate as possible to initialize forecast models. In particular, an accurate ice edge is important because of the influence of the interaction of sea ice and water with the overlying atmosphere on the model fluxes. Consistency of data is also desirable for operational models, but is a secondary concern because the models are regularly reinitialized for their synoptic forecasts. Operational observations like MASIE make the most sense for these applications. However, the quality and amount of information used to produce the operational analyses vary.
Climate modelers desire consistent long-term data to minimize model biases and better understand and potentially improve model physics. The passive microwave record is useful, but has limitations. Regions of thin ice are underestimated and if the ice cover is diffuse with low concentration, ice-covered regions may be detected as open water. Even thin ice modifies heat and moisture transfer and thus may affect atmospheric and oceanic coupling. Surface melt results in an underestimation of concentration. This should be considered when evaluating model concentrations with passive microwave data.
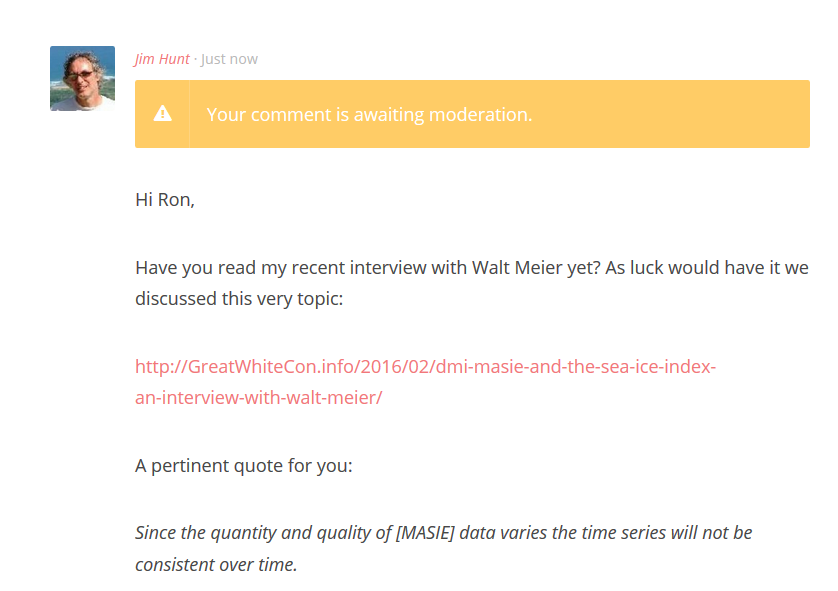
and here once again is what he told me a few short days ago:
Since the quantity and quality of [MASIE] data varies the time series will not be consistent over time.
For some strange reasom Mr. Clutz’s article mentions none of this. Needless to say I have attempted to bring this unfortunate oversight to the attention of Ron & Paul:
Even more unfortunately it seems that their joint acute snow blindness has got even worse over the last few days, since they still haven’t noticed my link to Walt Meier’s words waiting patiently in their WordPress.com “moderation queues”.
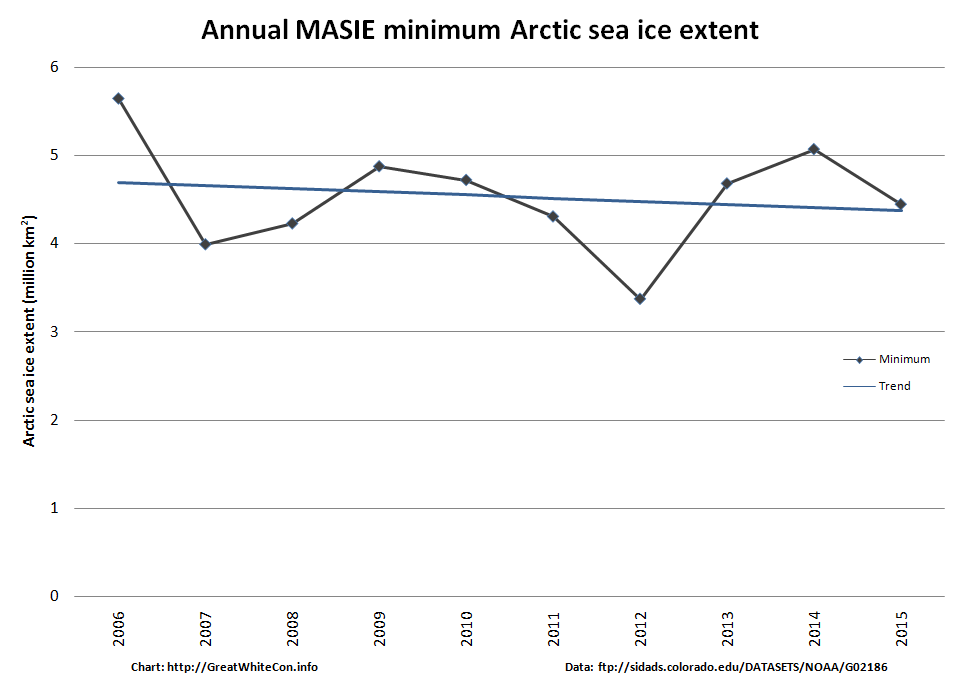
Whilst we wish them on their recovery from their painful ailment, here’s an alternative interpretation of the MASIE data:
Operational modellers for the use of! Here’s what the NSIDC’s Sea Ice Index currently reveals to climate scientists:

NSIDC Arctic sea ice extent is evidently still currently lowest *ever for the date.
Re: Not A Lot of People Know That
I stopped by there once and quickly realized that not a lot of people know that becuz most of them aren’t stupid enough to believe the lunatic ideas of Paul Homewood. Thank god for small favors 🙂
Quite so Kevin!
However were you previously aware that Mr. Homewood’s “lunatic ideas” are republished by, amongst others, our Great British Global Warming Policy Forum? If not please see:
https://greatWhiteCon.info/2016/02/the-great-global-warming-policy-forum-con/
Are you familiar with Willard Watts`cluelessness during the 2012 polar cyclone that devastated Arctic ice and contributed to the record low area, extent and volume?
ASIB as usual was days ahead of the blogosphere forecasting the storm. Meanwhile back at Watts’ Troll Central, his minions were oblivious to the impending storm and were droning on and on about the mythical recovery of Arctic ice occurring in their Wing-nut Alternate Universe (WAR). Of course the former weather reader and college drop-out was the most clueless of all. Check out the very first comment at the link below and Willard’s moronic reaction. I forgot about Neven’s visit to WUWT.
https://archive.is/GQC1r
This was just the beginning of what will eventually be a very bad month for the intellectual lightweight. This was the same month that an “anonymous” blogger posted a hilarious Downfall parody video and linked to it at several blogs that are less than enamoured with Watts.
http://bit.ly/1kBrnhQ
For the sake of brevity I will fast forward to late in August, there were too many Willard follies committed that month to include in a single comment. Watts claimed that MASIE was showing a different outcome, more in line with the one he saw in the WAR. Walt Meier visited Troll Central and gave an explanation regarding the differences between MASIE and the NSIDC Sea Ice Index he recently gave to Snow White.
Mosher was a pain in the derriere to Willard and the inmates of the echo chamber that month and documented many of the minions mindless comments and posted them around the time of Meier’s visit.
Reading Reggie’s extensive documentation of Watt’s kerfuffle has been enlightening and I now have a cunning plan…
t.b.c.
By the way, the WAR copyright will have to be changed, I have found references to its use by Reggie in 2010 and believe it was first used at Think Progress in 2008. Unfortunately T.P. deleted all comments from their site predating 2010.
Reggie also coined the terms Troll Central, Teabag Troll, Astroturf Spin Machine and Reality Based Universe during the same time period.
I have found some interesting work done by Reggie from early this decade which will be shared in private with interested parties via Storify, time permitting.
Oh OH
Looks like little willard has got some splainin to do…
http://bit.ly/21dXnqZ
The following comment was posted by one of the climate trolls named kadaka (KD Knoebel) at #wutz blog way back in August 2013 when “blowtorch” Reggie visited during an Arctic heatwave that the college dropout and former weather reader conveniently dissapeared …
Willard’s Troll Central knew back in August 2013 the product would eventually be replaced …the plot thickens, stay tuned for more invonvenient facts from August 2013 courtesy of the Master of Space and Thyme and Reggie.
[Reformatted – mod]