On January 1st 2016 the 15% concentration threshold daily Arctic sea ice extent metric reported by the United States National Snow and Ice Data Centre reached the lowest ever level for the first day of any year since their satellite derived records began in 1979. A couple of days later the more familiar 5 day trailing averaged extent also reached the lowest ever level for the date:
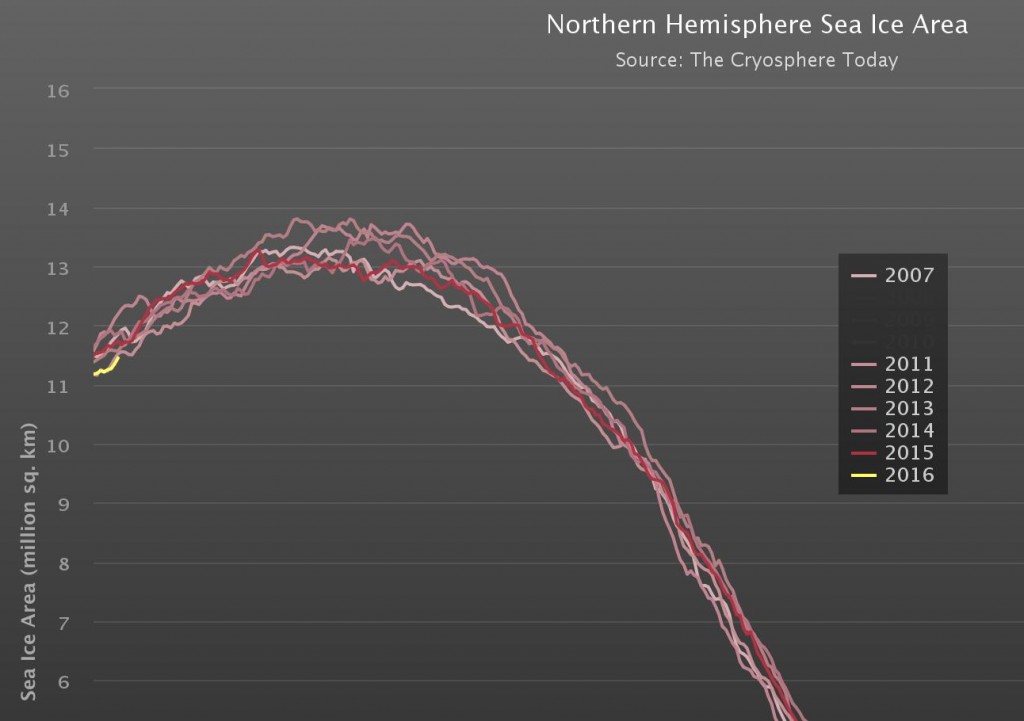
Cryosphere Today have been somewhat sluggish about updating their records of Arctic sea ice area, but have at long last revealed that their metric is now also at the lowest ever level for the date:
Meanwhile Great White Con commenter “Just A Thought” states that:
I find it hard, with what I do have access to, to see why everyone is so worried that the Arctic is melting.
He or she has evidently only had access to the propaganda perpetrated by Tony Heller (AKA “Steve Goddard”) on his so called “Real Climate Science” blog. Mr. Heller’s latest Arctic pronouncement on December 31st 2015 is entitled “Arctic Meltdown Update” and claims that:
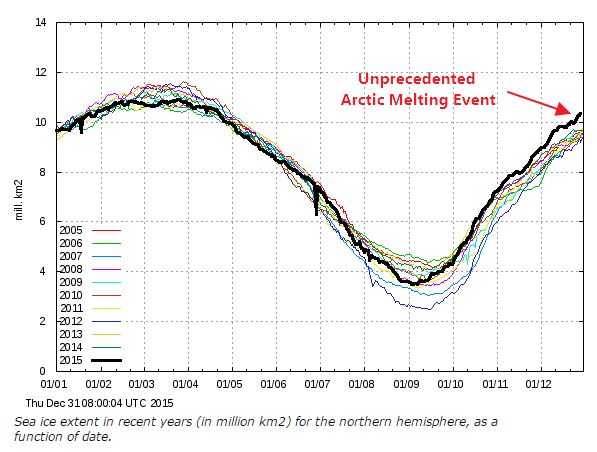
Experts say that a terrifying storm melted the North Pole yesterday. This unprecedented melting event has caused Arctic ice to reach its highest December extent in over a decade.
justifying that comment with the following graph of his beloved (albeit deprecated) 30% concentration threshold DMI extent metric:
Here’s a video revealing the effect of the recent “terrifying storm” on the sea ice on the North Atlantic side of the Arctic:
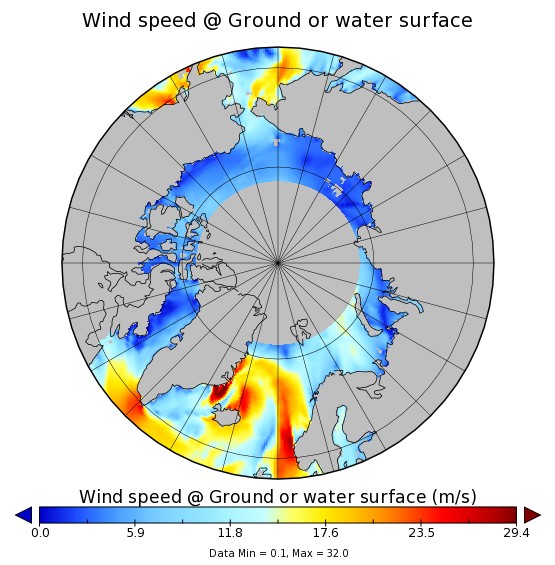
As you can see the ice at the North Pole didn’t melt away. However the ice edge did retreat in the immediate aftermath of what is referred to here in the United Kingdom as “Storm Frank“. Frank led to lots of flooding in the North of the nation, and also to some strong winds inside the Arctic Circle:
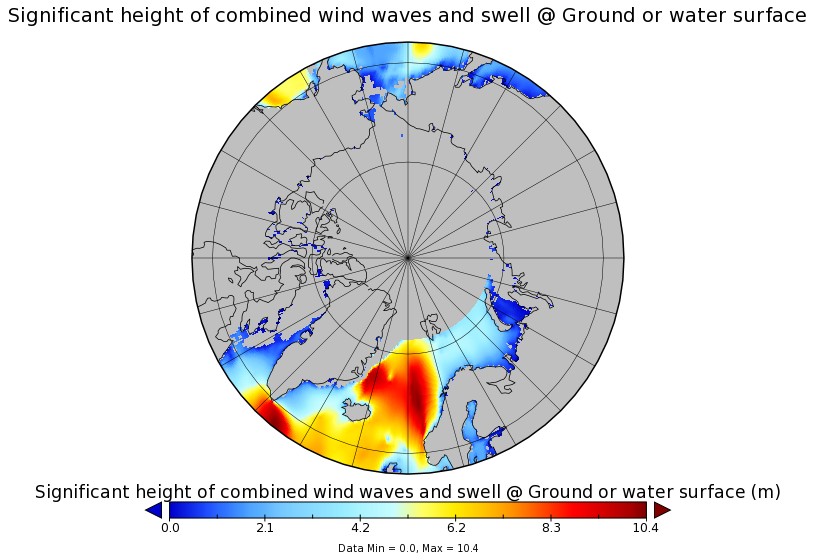
Those winds, travelling over a long stretch of open ocean, produced some pretty significant waves, speeding in the direction of the sea ice edge:
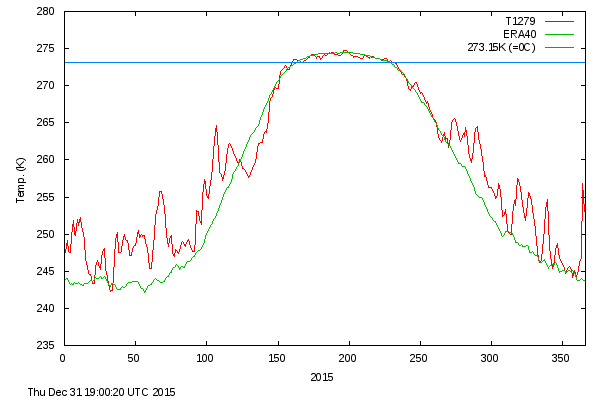
Meanwhile temperatures near the North Pole did briefly rise above the freezing point of sea ice in the middle of the Arctic winter. Here’s the Danish Meteorological Institute’s view of the air temperatures in the central Arctic:
and here is NOAA’s temperature anomaly reanalysis for December 30th 2015:
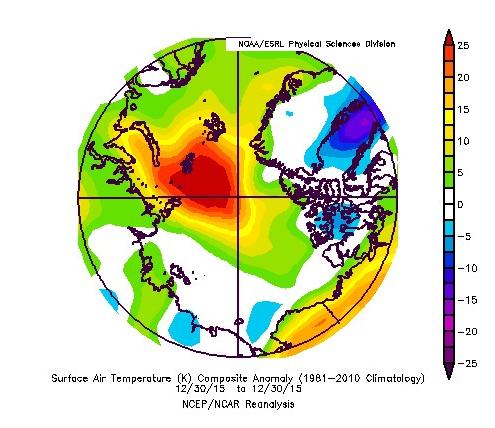
Personally I reckon the 25 m/s winds and resulting 10 meter waves had more effect on the sea ice metrics than the 25 °C above normal air temperatures, but your mileage may of course vary, especially if your pseudonym is “Steve Goddard”!
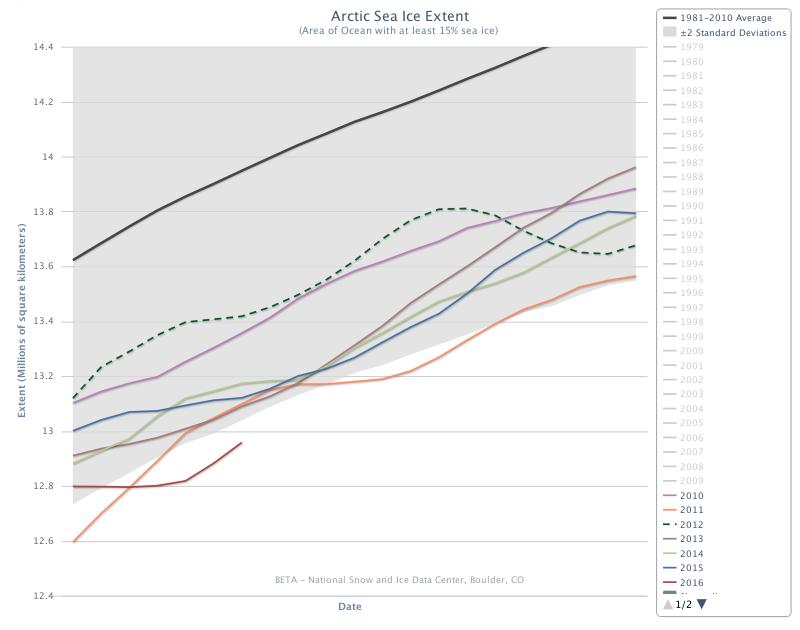
After a brief hiatus JAXA/IJIS/ADS have now updated their Arctic sea ice extent numbers for the first time in 2016. The graph’s a bit cluttered, but they have 2016 in 4th place at 12,878,297 km2 on January 12th :
great video jim . we can all now see the results of the amo flipping to the cool phase. each of those large storms of the past 6 months removes more energy from the system . those storms will have layered the ice up on top of itself and caused cracks,leads and open water allowing even more energy to escape the system. all part of how the atlantic modulates its own temperature over decadal timescales.
north sea temperatures peaking 3 c lower this summer were an early indicator of what was to come for the north east atlantic this winter.
i see the alarmism is in full flow over on the asif regarding winter ice extent. you would think some people would learn from the mistakes of the past. jd allen appears to be winters answer to the summer alarmism of the frivilous one ,lol.
long way to go for this winters extent,and with volume building all the time and the atlantic cooling rapidly ,the pacific blob gone along with a shift in weather patterns, i fear there may be a few disappointed arctic watchers this coming summer.
as for the el ninio, or el tinio as i like to call it. all the signs are pointing to a 2014/15 event with the current satellite temps being the subsequent result. again i strongly suspect all those lookng for a big jump in tropospheric temps this coming year will be disappointed.
you never know though, noaa may lend them a temp smearing algorithm or two to bring the graphs into line with the current unprecedented warming mantra 🙂
Thanks for your kind words Chilly, but smiley or not I cannot let your final paragraph go unchallenged. Which “temp smearing algorithms” would those be?
Regarding the energy in the climate system perhaps I might direct you to another organ of mine, which brings news of the advent of Hurricane Pali?
Pali in Early Start to 2016 Pacific Cyclone Season
Time will tell how much Arctic sea ice such energy will have melted by September.
you know a hurricane produces a huge local cooling effect jim ?
It seems you have missed my point entirely Chilly, and you haven’t answered my question on “algorithms” either!
ENSO may continue to oscillate but carbon dioxide concentrations in the atmosphere continue to rise and as physics dictates the energy in the climate system continues to rise. A hirsute physicist explains:
All that energy eventually expresses itself somewhere somehow. Tropical storms in both the Pacific and the Atlantic before the middle of January is unprecedented (since records began!). Historically things don’t generally start spinning until June:
Subtropical Storm Alex Arrives in the North Atlantic
indeed, at the moment that energy is leaving the system via the atmosphere as a result of the hurricane 🙂 note as co2 levels have risen the temperature has not, for the last 18 years anyway jim. still no hot spot in the troposphere either .
i think the unprecedented melting effect you have highlighted on the chart was probably more like an unprecedented compaction event, well unprecedented in the absolutely minuscule period of time that is the satellite monitoring era.
looking good for lots of ice this summer jim. could this be the beginning of an increase in summer extent levels as the amo goes cold ? by the time our bet comes to its conclusion ,we could be halfway to the levels of the late 70’s 🙂
Surely you jest once again Chilly. Here’s the latest update from the JMA:
On January 15th 2016 the JAXA ADS Arctic sea ice extent metric was once again the lowest for the date (since their records began), and still below 13 million square kilometres:
What I find curious is the abrupt change around the 11th of Jan.
I’ve been too busy following (now ex) Hurricane Alex to have my finger on the pulse of the Arctic just at the moment. However CT area also shows a similar recent “hiatus”, and on the 15th was in second place by a whisker:
Speaking of Alex, see also:
https://greatWhiteCon.info/2016/01/is-the-son-of-storm-frank-heading-for-the-arctic/#comment-213202
The DMI 80N temperature chart is back in action today!
Maybe that’s got something to do with it?
Blowtorch
Two comments from ASIB that made Reggie smile…
http://bit.ly/1qk4rav
Blowtorch certainly was a fitting description of the Arctic this past winter. I owe heller one for all the good publicity. Was it one of his minions that posted that taunt at WUWT?