We speculated a few days ago about whether the “Son of Storm Frank” might have battered Britain by now, and be sending a 10 meter swell past Svalbard towards the Arctic sea ice edge. That’s not quite how things have worked out in practice however! We haven’t had another named storm affecting the United Kingdom directly, but we have received a series of long distance swells from a sequence of hurricane force storms further out in the North Atlantic. I even managed to test my Arctic surfing equipment by personally partaking in the swell generated by Hurricane Alex!
Moving from the water into the air, here’s the Danish Meteorological Institute’s forecast for Greenland tomorrow:
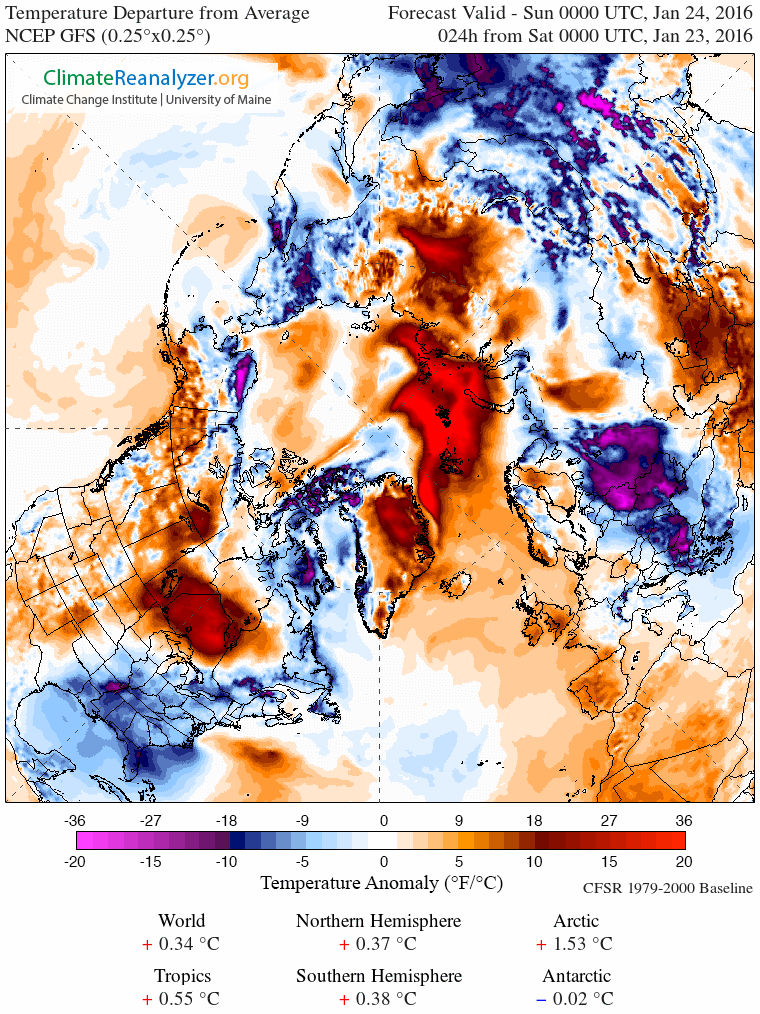
If you’re at all familiar with isobars you’ll note yet another storm off Southern Greenland and that comparatively warm, moist air will be heading up the east coast of Greenland towards the Fram Strait, albeit not at the speeds generated by Storm Frank! As a consequence here is Climate Reanalyzer’s surface temperature anomaly map for first thing tomorrow:
and here is how it looks by Wednesday lunchtime:
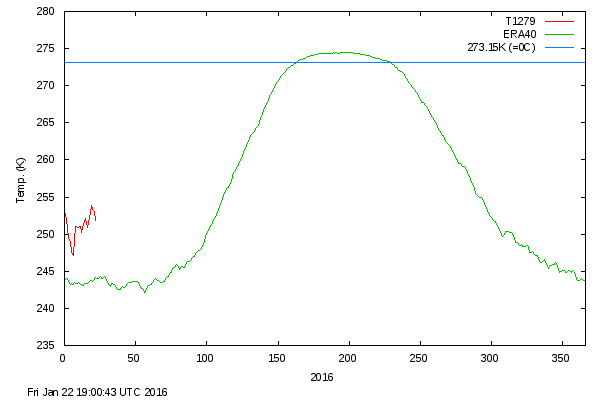
As you can see, the ultimate effect of the recent hurricane force storms in both the Atlantic and the Pacific is to attack the Arctic with warm, moist air from both sides. Whilst we wait to see exactly how this much shorter term forecast pans out, particularly at the North Pole itself, the DMI’s graph of temperatures in the central Arctic has burst back into life after a “brief hiatus” in the New Year. Here’s how it looks at the moment:
Our regular reader(s) may recall that this time last year we took umbrage at an article by David Rose in the Mail on Sunday about the joint NASA/NOAA press briefing outlining their findings about global surface temperatures in 2014.
We’ve been discussing Mr. Rose’s recent misleading “Tweets” about the Arctic with him:
As a consequence we also found ourselves in conversation with Gavin Schmidt of NASA about this year’s NASA/NOAA press briefing about global surface temperatures in 2015, which takes place on January 20th. Pencil it into your diary:
Climate experts from NASA and the National Oceanic and Atmospheric Administration (NOAA) will discuss the release of new data on 2015 global temperatures, and the most important weather and climate events of the year, during a media teleconference at 11 a.m. EST Wednesday, Jan. 20.
The teleconference panelists are:
Gavin Schmidt, director of NASA’s Goddard Institute for Space Studies in New York
Thomas R. Karl, director of NOAA’s National Centers for Environmental Information in Asheville, North Carolina, and chair of the Subcommittee on Global Change Research for the U.S. Global Change Research Program in Washington
Media can participate in the teleconference by calling 888-790-1804 (toll-free in the United States and Canada) or 415-228-4885 (international) and use the passcode “climate.”
Audio of the briefing, as well as supporting graphics, will stream live.
Whilst we wait with bated breath for the NASA/NOAA announcement, here’s how the Gavin, David & Snow show has been going over on Twitter:
You will note from the exchange on Twitter that the Berkeley Earth Surface Temperature project are one of the organisations that have already declared 2015 “The Warmest Year in the Modern Record”, which brings me to the Arctic connection. Tamino explains over at “Open Mind”, in an article entitled “Hottest Year On Record“:
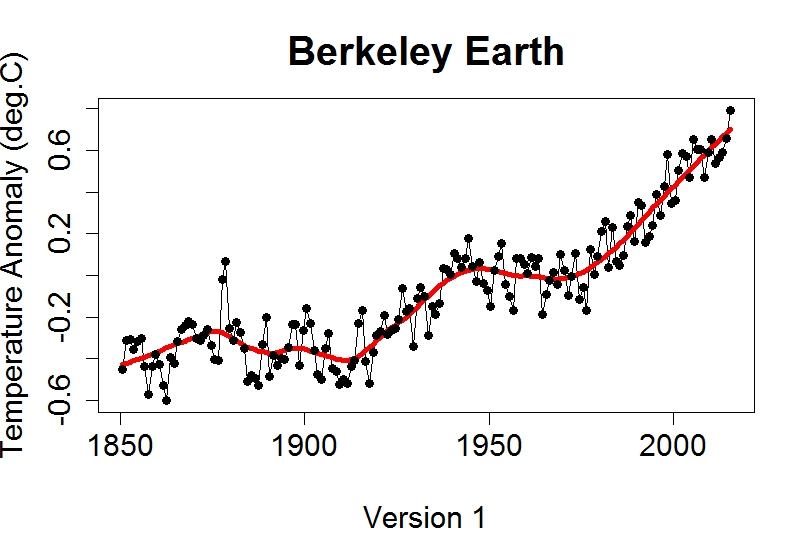
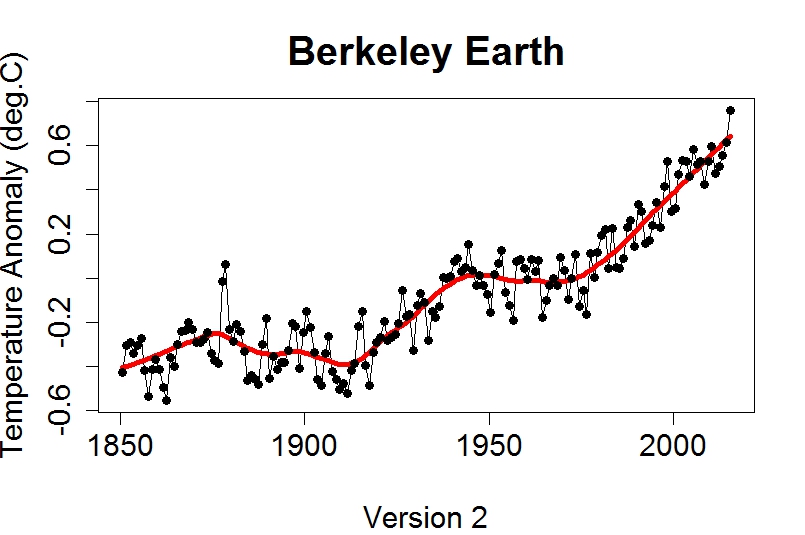
When it comes to global temperature over land and sea, Berkeley produces two versions, different in the way they treat areas covered with sea ice. Version 1 uses air temperature estimates for sea-ice covered regions, version 2 uses ocean temperature estimates.
and quotes BEST as follows:
For most of the ocean, sea-surface temperatures are similar to near-surface air temperatures; however, air temperatures above sea ice can differ substantially from the water below the sea ice. The air temperature version of this average shows larger changes in the recent period, in part this is because water temperature changes are limited by the freezing point of ocean water. We believe that the use of air temperatures above sea ice provides a more natural means of describing changes in Earth’s surface temperature.
As Tamino puts it:
Let’s not keep you in suspense any longer. Here are annual averages through 2015 (which is now complete) according to version 1:
Here it is according to version 2:
Any way you look at it, 2015 is the hottest. Any way you look at it, there was no “pause” in global temperature.
[Edit – 17:30 UTC on January 20th 2016]
The joint NASA/NOAA media briefing on 2015 global average surface temperatures has just finished. The recording of the event is due to go online “in 2 hours” or so from:
I waited patiently in the NASA/NOAA queue to ask some Arctic related questions, but never received the call. I’ll let you know when I receive the promised answers by email.
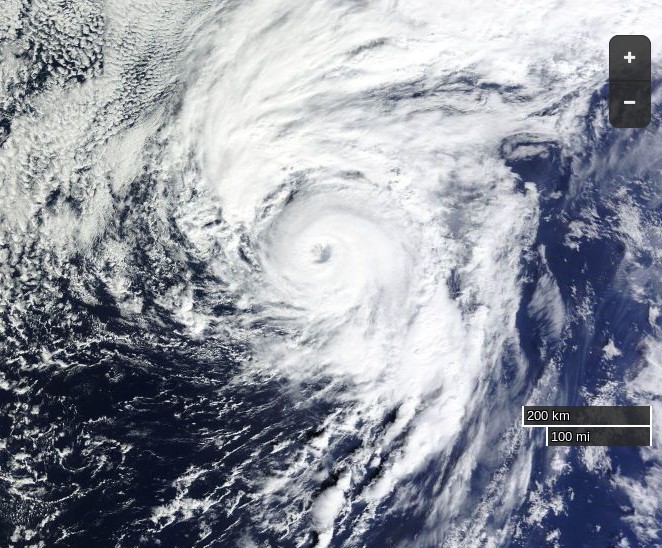
Strange things are happening in the North Atlantic at the moment. It’s the middle of January, and currently Hurricane Alex is heading straight for Greenland:
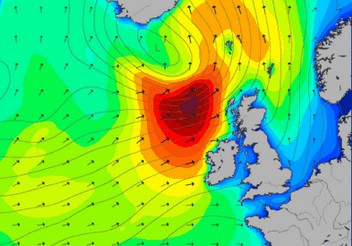
By the time he gets there Alex is due to meet another strong storm already spinning north of Newfoundland:
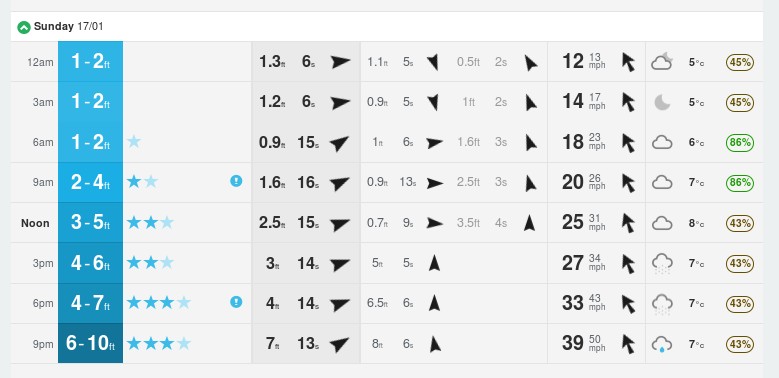
That combination is forecast by Magic Seaweed to bring some interesting surfing conditions to my local beach break here in Soggy South West England this coming weekend:
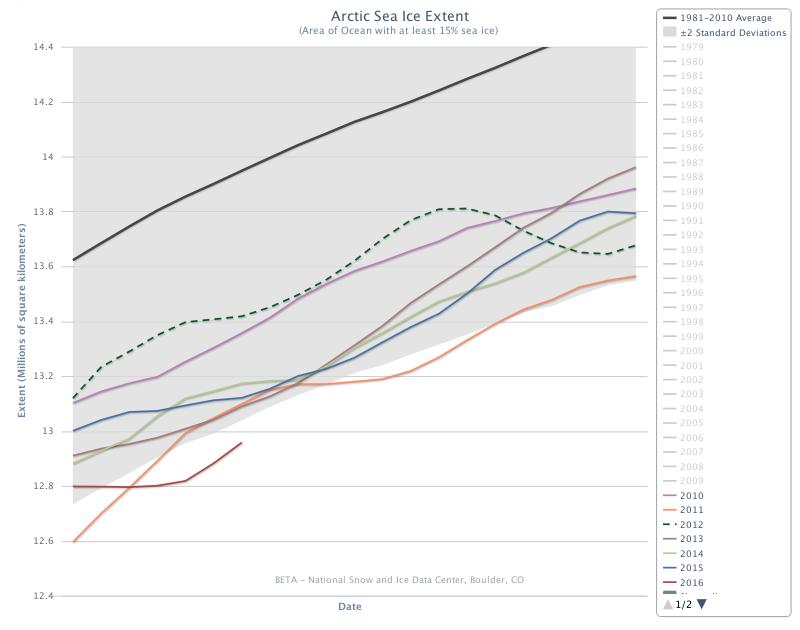
On January 1st 2016 the 15% concentration threshold daily Arctic sea ice extent metric reported by the United States National Snow and Ice Data Centre reached the lowest ever level for the first day of any year since their satellite derived records began in 1979. A couple of days later the more familiar 5 day trailing averaged extent also reached the lowest ever level for the date:
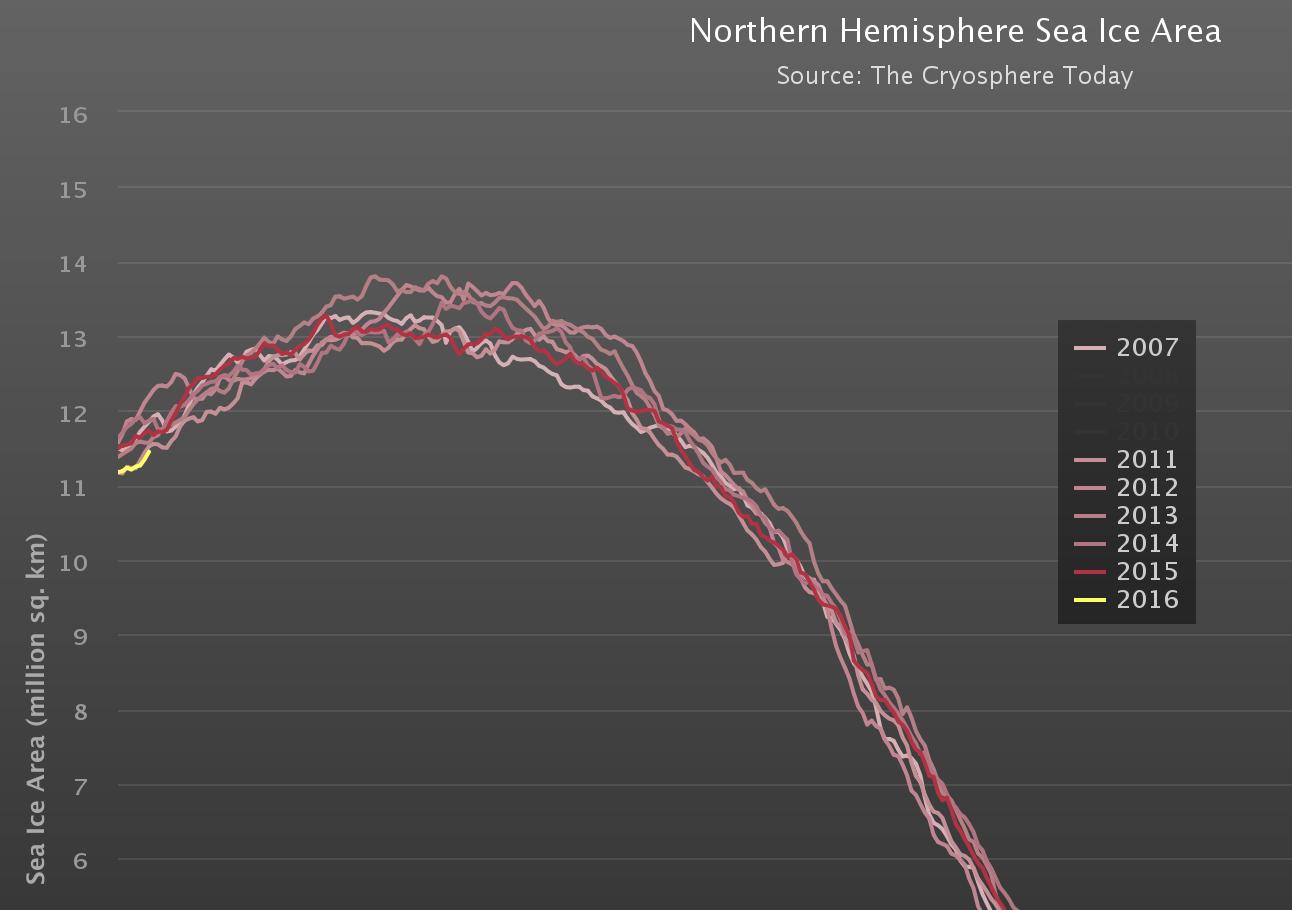
Cryosphere Today have been somewhat sluggish about updating their records of Arctic sea ice area, but have at long last revealed that their metric is now also at the lowest ever level for the date:
Meanwhile Great White Con commenter “Just A Thought” states that:
I find it hard, with what I do have access to, to see why everyone is so worried that the Arctic is melting.
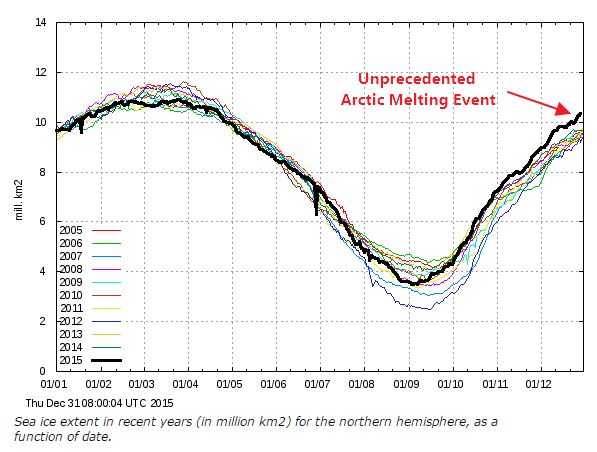
He or she has evidently only had access to the propaganda perpetrated by Tony Heller (AKA “Steve Goddard”) on his so called “Real Climate Science” blog. Mr. Heller’s latest Arctic pronouncement on December 31st 2015 is entitled “Arctic Meltdown Update” and claims that:
Experts say that a terrifying storm melted the North Pole yesterday. This unprecedented melting event has caused Arctic ice to reach its highest December extent in over a decade.
justifying that comment with the following graph of his beloved (albeit deprecated) 30% concentration threshold DMI extent metric:
Here’s a video revealing the effect of the recent “terrifying storm” on the sea ice on the North Atlantic side of the Arctic:
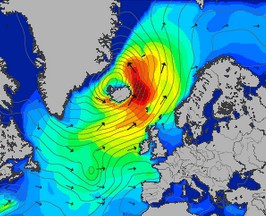
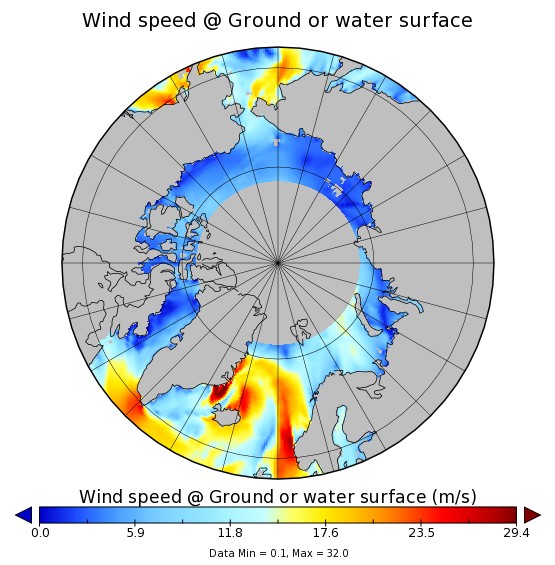
As you can see the ice at the North Pole didn’t melt away. However the ice edge did retreat in the immediate aftermath of what is referred to here in the United Kingdom as “Storm Frank“. Frank led to lots of flooding in the North of the nation, and also to some strong winds inside the Arctic Circle:
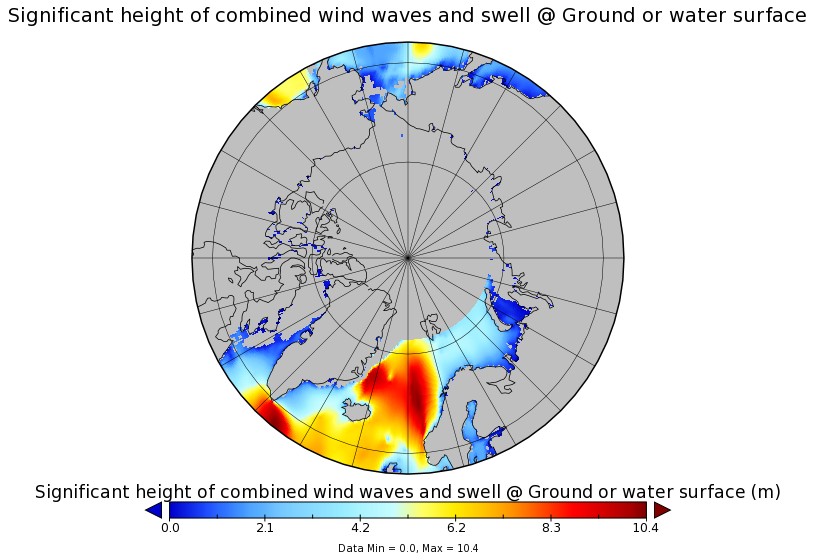
Those winds, travelling over a long stretch of open ocean, produced some pretty significant waves, speeding in the direction of the sea ice edge:
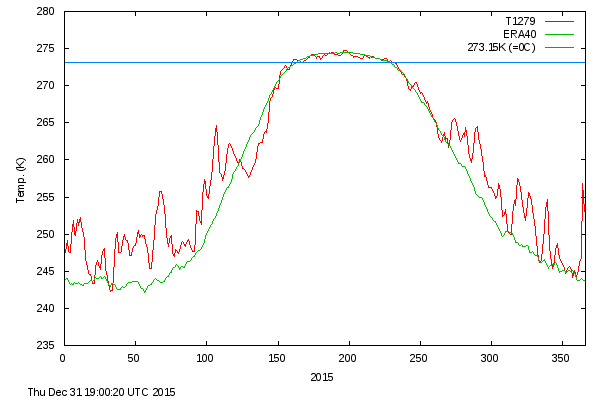
Meanwhile temperatures near the North Pole did briefly rise above the freezing point of sea ice in the middle of the Arctic winter. Here’s the Danish Meteorological Institute’s view of the air temperatures in the central Arctic:
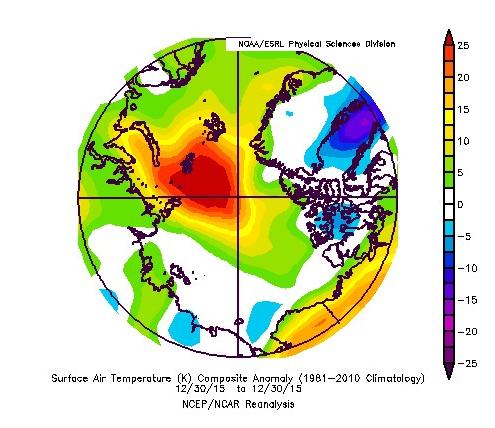
and here is NOAA’s temperature anomaly reanalysis for December 30th 2015:
Personally I reckon the 25 m/s winds and resulting 10 meter waves had more effect on the sea ice metrics than the 25 °C above normal air temperatures, but your mileage may of course vary, especially if your pseudonym is “Steve Goddard”!
This website uses cookies to improve your experience. We'll assume you're ok with this, but you can opt-out if you wish. Cookie settingsACCEPT
Privacy & Cookies Policy
Privacy Overview
This website uses cookies to improve your experience while you navigate through the website. Out of these, the cookies that are categorized as necessary are stored on your browser as they are essential for the working of basic functionalities of the website. We also use third-party cookies that help us analyze and understand how you use this website. These cookies will be stored in your browser only with your consent. You also have the option to opt-out of these cookies. But opting out of some of these cookies may affect your browsing experience.
Necessary cookies are absolutely essential for the website to function properly. This category only includes cookies that ensures basic functionalities and security features of the website. These cookies do not store any personal information.
Any cookies that may not be particularly necessary for the website to function and is used specifically to collect user personal data via analytics, ads, other embedded contents are termed as non-necessary cookies. It is mandatory to procure user consent prior to running these cookies on your website.