Monthly Archives: March 2015

Sea Ice and Swells in the Beaufort Sea in the Summer of 2014

Today we’re going to delve into the application of surf science in the Arctic. If you’re not already familiar with the basics of how the best surf is created then perhaps you might first wish to take a detour to the StormSurf “Wave Basics” article:

Wind waves, though rideable, are not the optimal type of wave one likes to ride. Swells are much better. Wind waves are only the raw material that swells are made from. But, the more energy wind waves accumulate while being driven by wind, the greater the likelihood they will transform into a swell. Enough energy and the swell can travel the entire circumference of the globe with only a slow decay in size!

During a typical open ocean winter storm, one could expect to see winds of 45-55 kts blowing over 600-1000 nautical miles for 36 hours. In such a storm, the average highest wind waves (or ‘seas’) commonly reach 30-35 ft towards the center of the fetch area and produce a swell with a period of 17-20 secs.

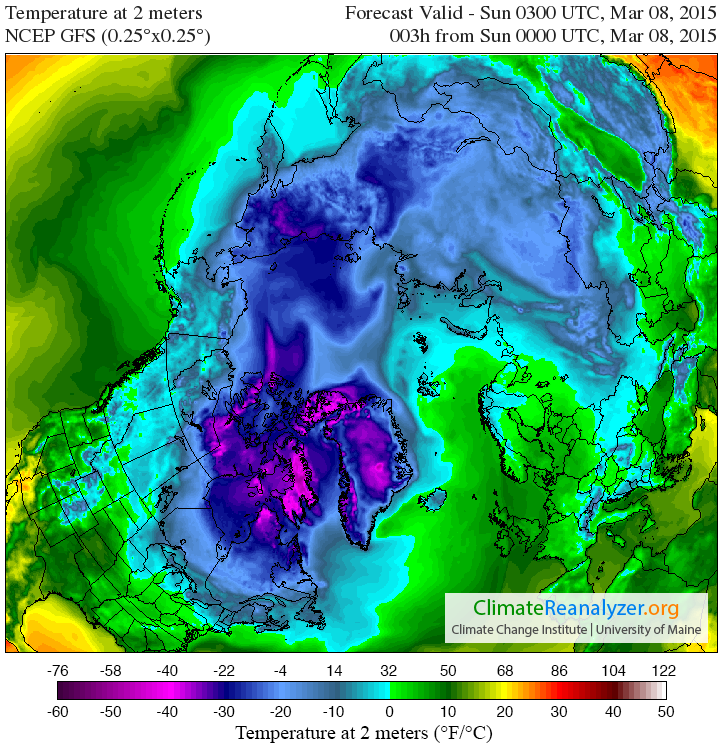
Regular readers may recall that on August 24th 2014 we revealed this WaveWatch III “surf forecast” for the Beaufort Sea, which lies off the north coast of Alaska and the Canadian Northwest Territories (i.e. top center of the map):
alaska.hs.f009h-20140824
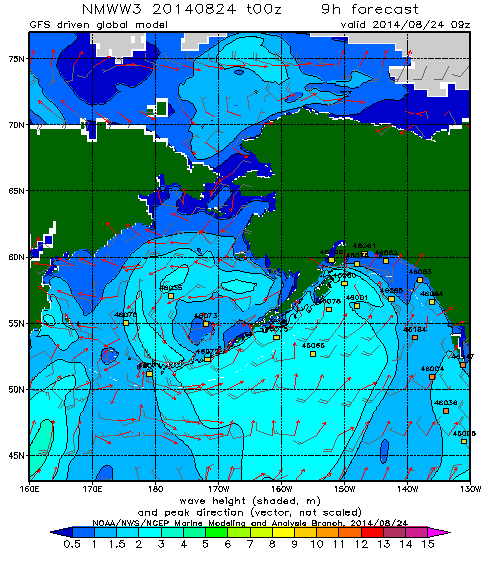
and noted that the 2 meter waves depicted:

Have blasted past Point Barrow and are currently heading straight for the Beaufort Sea Marginal Ice Zone.

Here’s a video from the University of Washington’s Applied Physics Laboratory which explains that the Marginal Ice Zone is:

The area between declining unbroken sea ice and the expanding area of open water.

The theoretical significance of such swells has been discussed in a number of academic papers recently. Take for example these extracts from “Swell and sea in the emerging Arctic Ocean” by Jim Thomson from the University of Washington and W. Erick Rogers from the US Naval Research Laboratory. Note first of all that the authors distinguish between “wind seas” and “swells” as follows:

Pure wind seas have a wave age less than one, indicating that the wind is driving the waves, and these points cluster largely below the Pierson–Moskowitz limit. Swells have a wave age greater than one, indicating that the waves are outrunning the wind.

They then go on to use some more terms very familiar to the average surfer:

Ocean surface waves (sea and swell) are generated by winds blowing over a distance (fetch) for a duration of time. In the Arctic Ocean, fetch varies seasonally from essentially zero in winter to hundreds of kilometers in recent summers. Using in situ observations of waves in the central Beaufort Sea, combined with a numerical wave model and satellite sea ice observations, we show that wave energy scales with fetch throughout the seasonal ice cycle. Furthermore, we show that the increased open water of 2012 allowed waves to develop beyond pure wind seas and evolve into swells. The swells remain tied to the available fetch, however, because fetch is a proxy for the basin size in which the wave evolution occurs. Thus, both sea and swell depend on the open water fetch in the Arctic, because the swell is regionally driven. This suggests that further reductions in seasonal ice cover in the future will result in larger waves, which in turn provide a mechanism to break up sea ice and accelerate ice retreat.

It is possible that the increased wave activity will be the feedback mechanism which drives the Arctic system toward an ice-free summer. This would be a remarkable departure from historical conditions in the Arctic, with potentially wide-ranging implications for the air-water-ice system and the humans attempting to operate there.

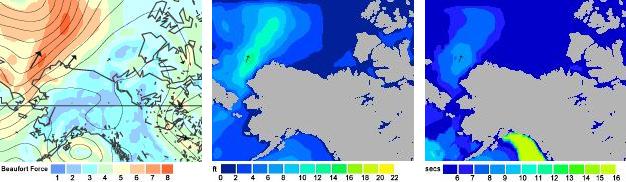
In practice there were several more swells that impacted the Beaufort Sea marginal ice zone over the course of the next couple of weeks. Here’s what the charts looked like, as visualised by MagicSeaweed.com rather than NOAA:

Beaufort Sea on August 27th 2014 - Winds / Wave Height / Wave Period
Beaufort Sea on August 27th 2014 – Winds / Wave Height / Wave Period
Beaufort Sea on September 1st 2014 - Wind / Swell / Period
Beaufort Sea on September 1st 2014 – Winds / Wave Height / Wave Period
Beaufort Sea on September 7th 2014 - Wind / Swell / Period
Beaufort Sea on September 7th 2014 – Winds / Wave Height / Wave Period

Note that on the right of each set of three is a depiction of the period of the waves in question. As StormSurf points out:

Chop tends to have a period ranging from 3-8 seconds. That is, there is anywhere from 3-8 seconds between each wave crest. Wind waves range from 9-12 seconds. Ground swells range from 13-15 seconds, and strong ground swells have a period anywhere from 16-25 or more seconds.

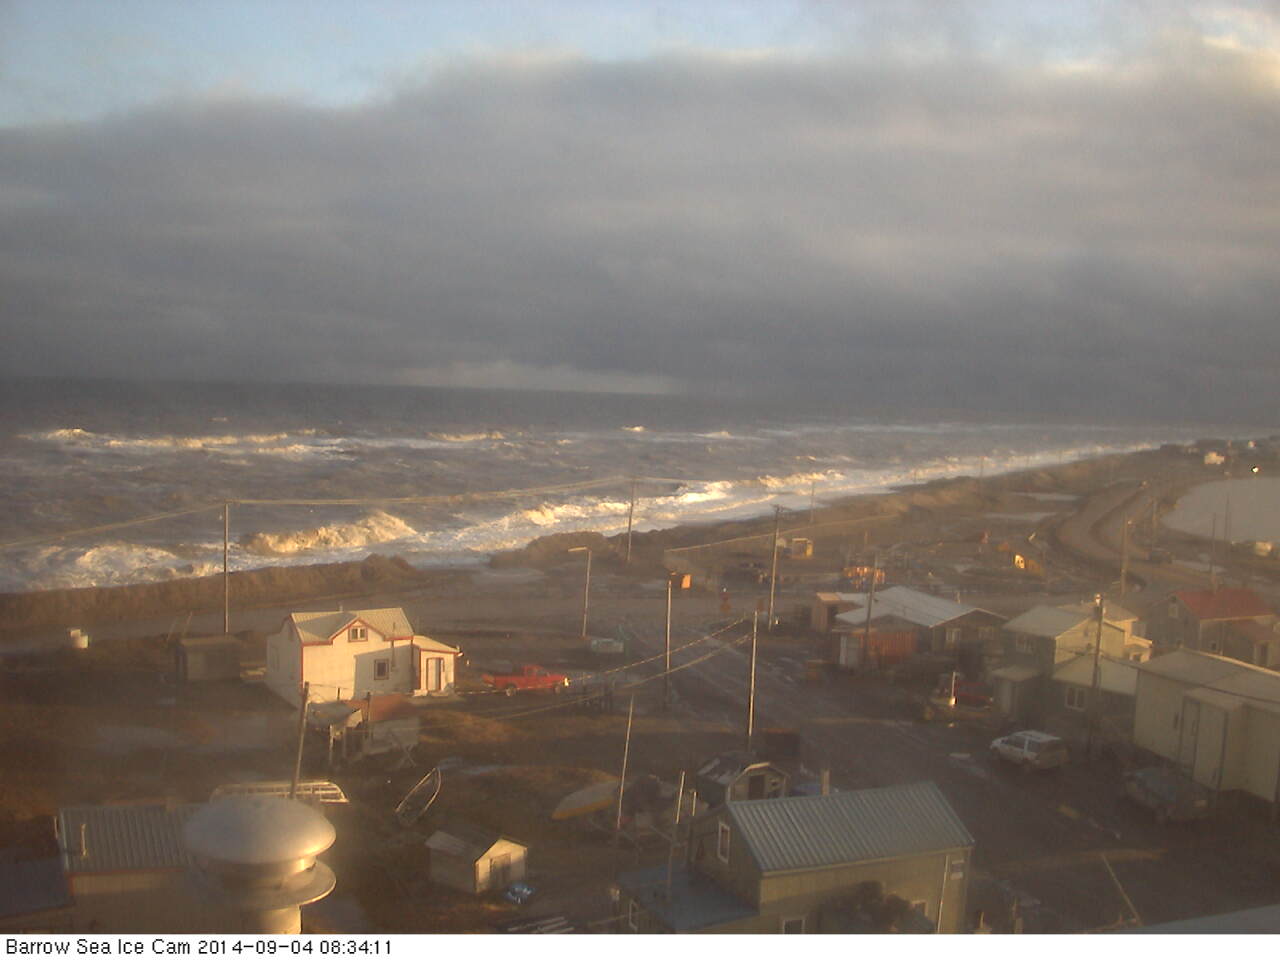
Thus the final swell on September 7th was actually the best of the bunch, with a small area of waves over 10 feet in height and with a period of over 9 seconds. According to StormSurf those are merely “wind waves” and not yet a full blown “swell”. To give you a feel for such waves here’s what some “wind waves” hitting the beach at Barrow looked like on September 4th 2014:

BarrowCam_20140904_0834


Next here’s another video that reveals what effect those series of waves had on the sea ice in the Beaufort Sea:

For future reference here also is the same swell described by Thomson and Rogers, but illustrated in an identical “surfer friendly” format to the 2014 swells we’ve been looking at:

Beaufort Sea on September 18th 2012 - Wind / Swell / Period
Beaufort Sea on September 18th 2012 – Winds / Wave Height / Wave Period

whilst here is the swell produced by the “Great Arctic Cyclone” of early August 2012, also mentioned in passing by Thomson and Rogers:

Beaufort Sea on August 5th 2012 - Winds / Wave Height / Wave Period
Beaufort Sea on August 5th 2012 – Winds / Wave Height / Wave Period

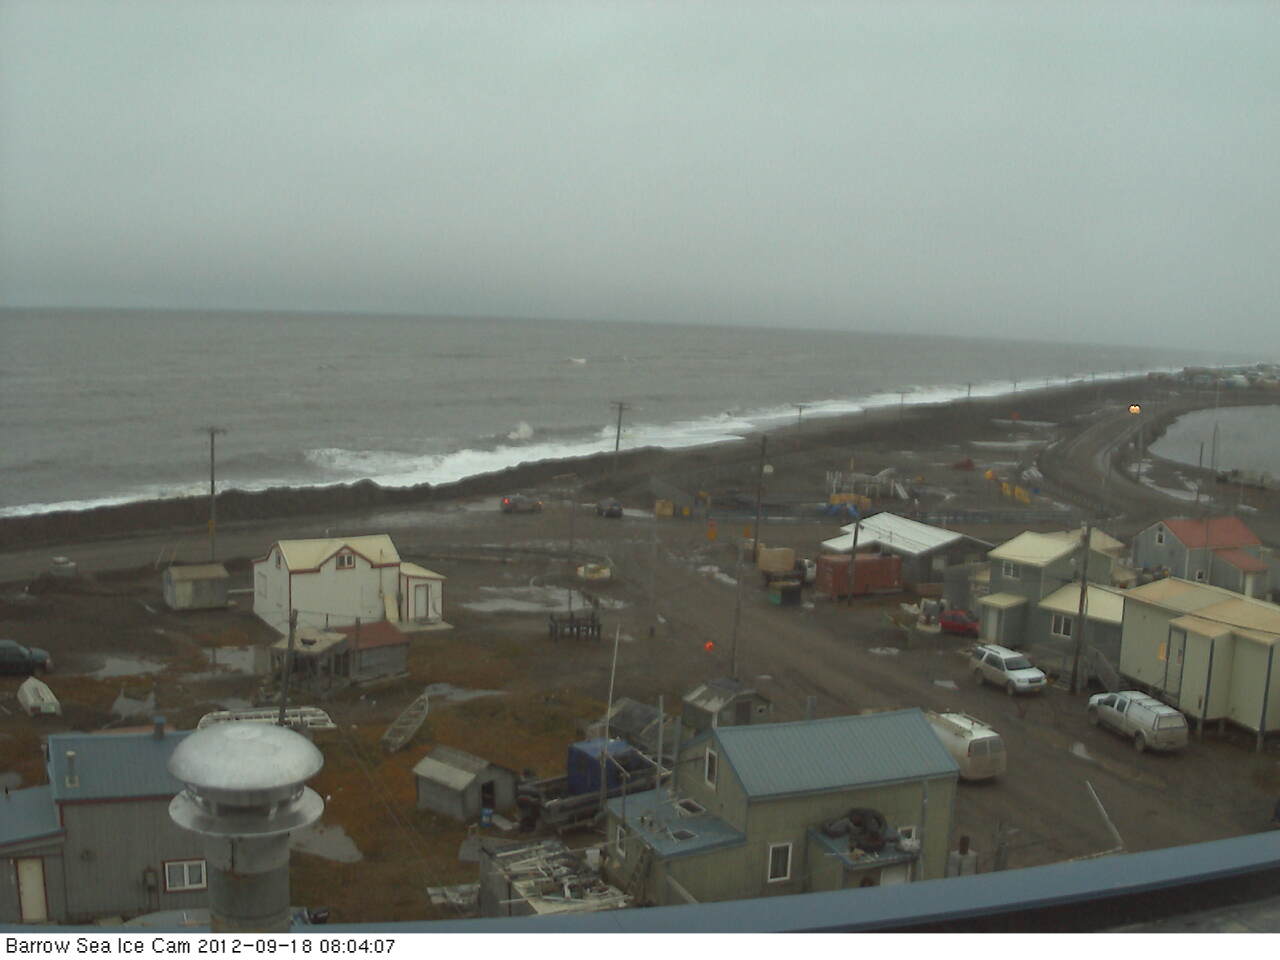
As you can see, if you’re a surfer used to tracking swells across the world’s oceans at least, whilst the September 2012 swell was indeed rather more substantial than those we have looked at in 2014, with a height in excess of 20 feet, the period was too short to qualify as a full blown swell and it was in fact directed away from the ice edge rather than towards it. Here’s what that 2012 swell looked like once it reached Barrow:

BarrowCam_20120918_0804

All of which does rather make one wonder what might happen if a slightly longer period swell directed at the ice edge in the Beaufort Sea were to occur at some point in the not too distant future? Whilst we all wait with bated breath to discover what that future holds for the sea ice in the Arctic, not to mention the beach at Barrow, here’s another video about the 2014 Marginal Ice Zone Program, which summarises the year’s campaign as a whole:

Note that Craig Lee says that:

We had very little wave activity. It was surprisingly calm when we were out there in the Araon, both when we were in the ice and in the open water. There just wasn’t much wind, and so there weren’t very many surface waves.

However at least one of the “robots” he refers to did discover some significant wave activity. Here’s a visualisation of SWIFT 11‘s record of significant wave height as it floated across the Beaufort Sea in the summer of 2014:

2014-Swift11-WaveHeight

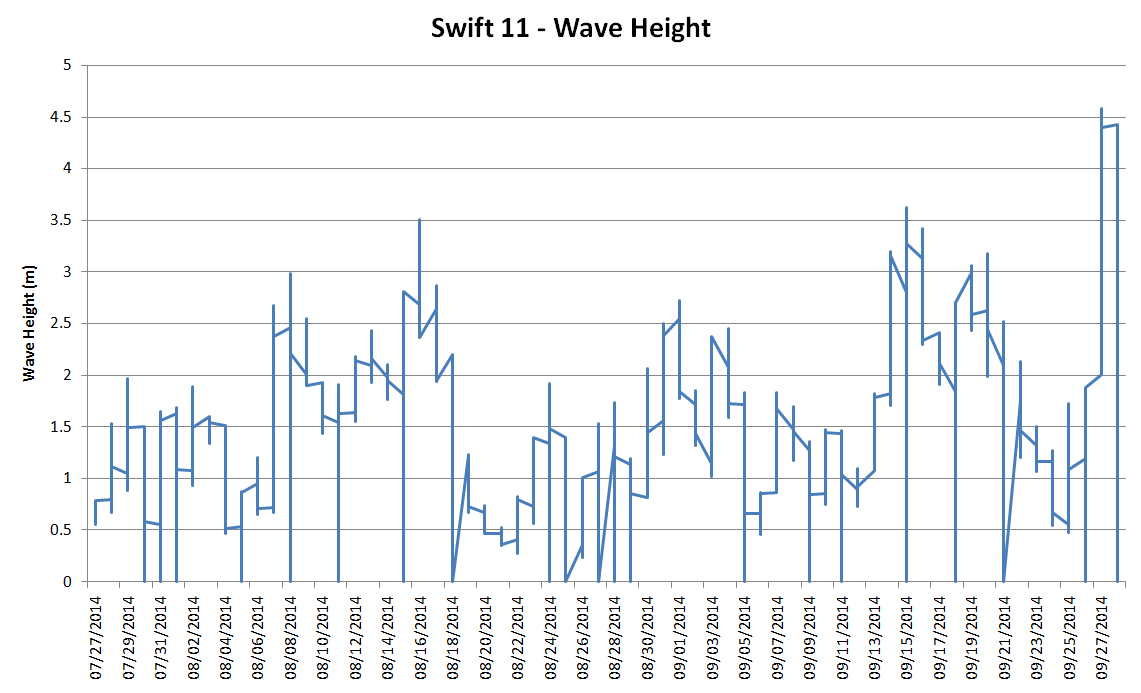
I don’t know about you, but I don’t think I would describe 4.5 meter waves as “surprisingly calm”, especially in the Arctic!


Arctic Basin Big Wave Surfing Contest Equipment Evaluation 2

A week after our first equipment evaluation expedition for our 2015 Arctic Basin Big Wave Surfing Contest the signs were looking good once again, albeit with a southwesterly wind once again. Here’s how our compact format surf forecast looked for noon on March 7th, courtesy of some copying and pasting from Magic Seaweed’s global surf outlook:

The North Atlantic surf forecast for March 7th 2015. Wind / Waves / Period
The North Atlantic surf forecast for March 7th 2015. Winds / Wave Height / Wave Period

You’ll no doubt note that the swell height out in mid Atlantic was off the top of the truncated scale. That’s because it’s designed for use in the Arctic Basin, where 40 foot waves are very hard to come by! Take a look at the last link below to see what I mean.

Given the wind the shelter of Putsborough was the order of the day when it came to spot selection. Water temperatures hadn’t changed significantly in a week, but the sun was shining on this occasion, which is undoubtedly preferable to the rain we experienced last time:

Eyeball-puts-20150307-2

Donning the same gear as last time even my fingers didn’t feel cold this time around, although my partner for the day (encased in a standard winter wet suit plus separate hood) described conditions as “f…. cold!” even after warming up thoroughly, as you can see here:

Eat your heart out Anastasia Ashley! After the session considerably more energy was expended by the two of us extracting yours truly from his Tiki Prodigy 6/5/4 suit. After that I started chatting to Simon, who happened to be parked next to us in the car park at Putsborough Sands, as dusk started to descend. Here’s what happened next:

Towards the end of our conversation I explained the rationale behind our Arctic Basin big wave surfing contest, and briefly touched on some of the associated Arctic surf science. For the scientifically inclined amongst you, there’s a much longer explanation available in this companion article!

Sea Ice and Swells in the Beaufort Sea in the Summer of 2014

Some Statistics for the 2015 Economist Arctic Summit

Professor Jason Box was good enough to add some expert commentary to our recent story about a large calving of the Jakobshavn Glacier last month. Consequently we have just watched his presentation to the 2015 Economist Arctic Summit at the Hotel Bristol in Oslo with much interest. Here are our edited highlights from the conference’s Twitter feed:


Here are some relevant Arctic sea ice metrics. We will continue to update them as the latest figures arrive throughout the rest of today:

IJIS/JAXA daily extent: 13,648,280 km² – Lowest ever level for the date in records going back to 2003

vishop_sic_20150311
 

DMI “30%” daily extent: 10,676,900 km² – Lowest ever level for the date in records going back to 2005

DMI-30-icecover_20150312
 

NSIDC daily extent: 14,330,000 km² – Lowest ever level for the date
NSIDC 5 day average extent: 14,280,000 km² – Lowest ever level for the date in records going back to 1979
Charctic-201503011Crop
 

Cryosphere Today daily area: 12,984,410 km² – Lowest ever level for the date in records going back to 1979
CTArea-2015-Day69

Arctic Sea Ice Area Lowest Ever (For the Date!)

As we reported on February 18th, some of the Arctic sea ice extent metrics reached the lowest levels for the date in their respective histories quite some time ago. Today though, we’re looking at a full house. The daily NSIDC and IJIS extent numbers have both been at all time lows for the date for quite some time now. Here’s how the NSIDC 5 day average extent looks at the moment:

2015-03-06_NSIDC

and here’s the IJIS/JAXA daily extent:

vishop_sic_extent-20150307

Meanwhile a series of storms in the North Atlantic have been bringing large surf to the shores of the Western United Kingdom, and battering the edge of the sea ice in the Greenland and Barents Seas. Here’s how GFS looks currently, as visualised by MeteoCiel:

gfsnh-20150308-6

In addition this has  resulted in warm air from further south being funnelled into the high Arctic, so much so that the surface temperature anomalies currently look like this:

CCI-AnomT-20150308+003

whilst the temperatures 2 metres above the surface of the Arctic look like this:

CCI-Temp2m-20150308+003

If you look closely you’ll see that air temperatures 2 metres above the North Pole are currently similar to those around the shores of the Great Lakes of North America.  As a result of all this atmospheric activity today we bring you news that both the Danish Meteorological Institute “new” 15% extent:

DMI-15-icecover_20150307

and “old” 30% metrics:

DMI-30-icecover_20150308

have now joined the club.

The Cryosphere Today area metric has been holding out against the trend in sea ice extent for weeks, but we can confidently predict that when their next update is released it too will also reveal the lowest ever Arctic sea ice area for the 65th day of the year, in records going back to 1979. Here’s how their graph looks currently:

CTArea-2015-Day64


Arctic Basin Big Wave Surfing Contest Equipment Evaluation 1

Great White Con fantasy big wave team rider Andrew Cotton was interviewed on BBC Radio Devon last week by none other than Simon Bates! Cotty was on a trip to Hawaii at the time and pointed out to Simon that:

The thing with surf… is it’s the tides, the waves, the wind. The surf tells you when to surf. It’s not around chores or work, you have to have surf that looks good.

As luck would have it all that came together for North Devon surfers at Putsborough Sands on Saturday. Things looked promising to us a couple of days beforehand, and plans were hatched on Twitter for our first equipment evaluation expedition of 2015:


We took the heaven sent opportunity to test out our thickest winter wetsuit in the following conditions:

MSW-SST-UK-2015-03-01
 
According to Magic Seaweed sea surface temperatures are currently around 8 °C off the coast of North Devon, and it doesn’t get much colder than that in this neck of the woods, which may have had something to do with at least one “no show” on Saturday. Simon had “volunteered” Richard Green for a “cold and dangerous” surf trip:

but Richard had a good excuse for being unable to make it since he was broadcasting on Radio Devon, and chatting to Pete Waterman amongst other things, that afternoon. We did invite Simon Bates along too, but it seems he had a previous engagement in London:

Prior to setting off for the north coast I got in touch with Trev Lumley, who is the proprietor of the Eyeball Surfcheck web site where we had discovered this enticing looking image on the Putsborough surfcam earlier that morning:

Eyeball-puts-20150228-2

Trev told me he would be elsewhere by the time we arrived at “Spot P”, so I quickly tested out my little quiz for the day on him. He claimed never to have heard of Richard Green, whilst Simon Bates did ring a bell and the name Andrew Cotton was very familiar. When I explained the reason for my call Trev told me that he had actually heard Andrew being interviewed by Simon on BBC Radio Devon a few days previously. When pressed to decide who amongst the three names I had mentioned was most famous Trev told me that as far as he was concerned Cotty was the man, since he had known him since he was a boy. However Trev thought that Simon’s name would probably be more familiar to the average Devonian.

When we eventually arrived at the car park above the beach some heavy showers had already set in. However before plunging into the chilly North Atlantic, I took advantage of a break between the downpours and wandered around the car park at Putsborough with a cameraman in tow to discover the reaction of some of the locals to my Tiki Prodigy 6/5/4 suit, whilst also killing two birds with one stone by doing some research into the nature of fame and celebrity in the 21st century. Here’s my first interview, with a local lifeguard:

As you can see, our first interviewee thought the Tiki Prodigy “Looks warm”, which was comforting in all the circumstances. In addition out of our list of six celebrities Andrew Cotton was overwhelmingly the most famous. DJs Simon Bates and Richard Green, and journalists Andrew Neil, Christopher Booker and David Rose failed to achieve even the merest flicker of recognition.
 
More videos are on the way, but are currently still stuck in the editing suite here in the basement of the Great White Con Ivory Towers. In the meantime here are my own findings after a couple of hours at sea on my yellow sponge performing our first Arctic equipment evaluation test:

Apart from my Prodigy I was also wearing Tiki 5mm socks and 2mm bodyboarding gloves. I suffered none of the “brain freeze” reported by my even more intrepid companion, who entered the water hoodless beside me:

vlcsnap-2015-03-02-18h07m00s170

Because I didn’t want to lose my contact lenses I did very little duck diving. On only one occasion did I experience the thrill of cold water flushing down my back. My fingers started to feel a bit chilly as I was bobbing about out the back after my initial paddle out, but once I got into the swing of things even they were toasty for the duration. Whilst I do wonder if Tiki could be persuaded to produce some thicker gloves with webs between the fingers, my biggest problem proved to be extracting myself from my soggy suit in the pouring rain that had set in by the time I arrived back in the car park as the light was fading. To give you an idea of the problem I faced here is Andrew Cotton explaining the virtues of the chest zip version of the Zepha, which has replaced the Prodigy in Tiki’s range of cold water winter wetsuits:

Watch this space!