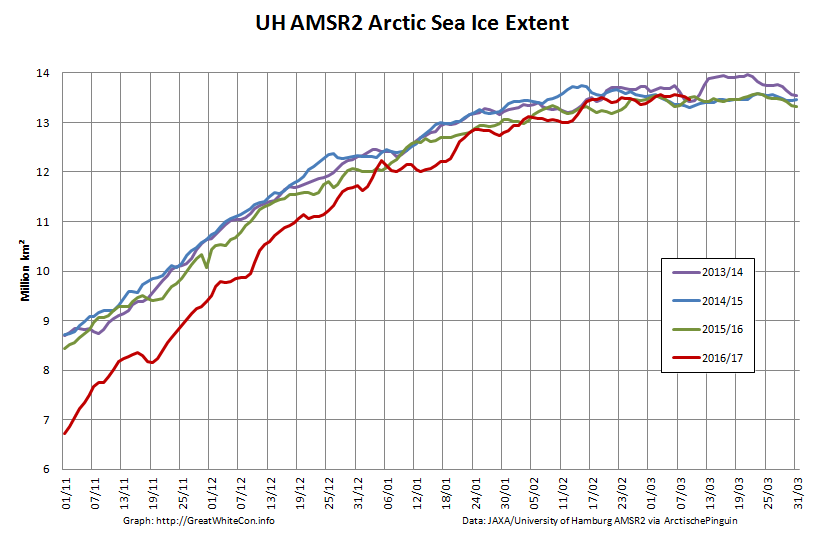
It’s far too early to be sure about this yet, but it’s not beyond the bounds of possibility that the 2017 maximum is already in place. Here’s our favourite high resolution extent graph calculated by “Wipneus” from University of Hamburg/JAXA AMSR2 data:
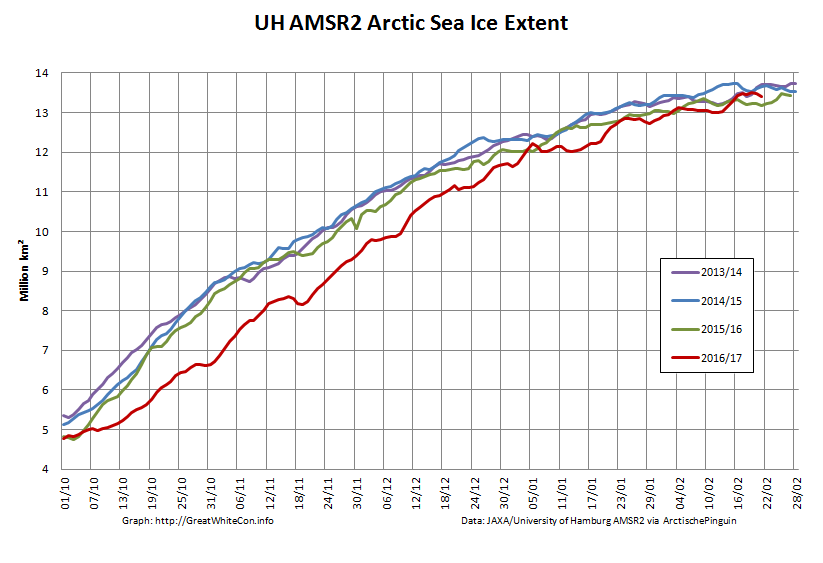
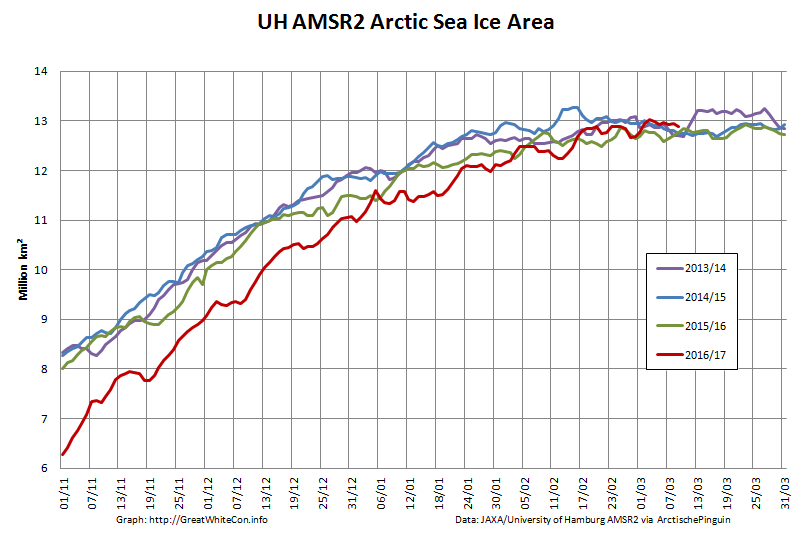
The current maximum Arctic sea ice extent for 2017 is 13.49 million square kilometers on February 19th. Here’s Arctic sea ice area for good measure:
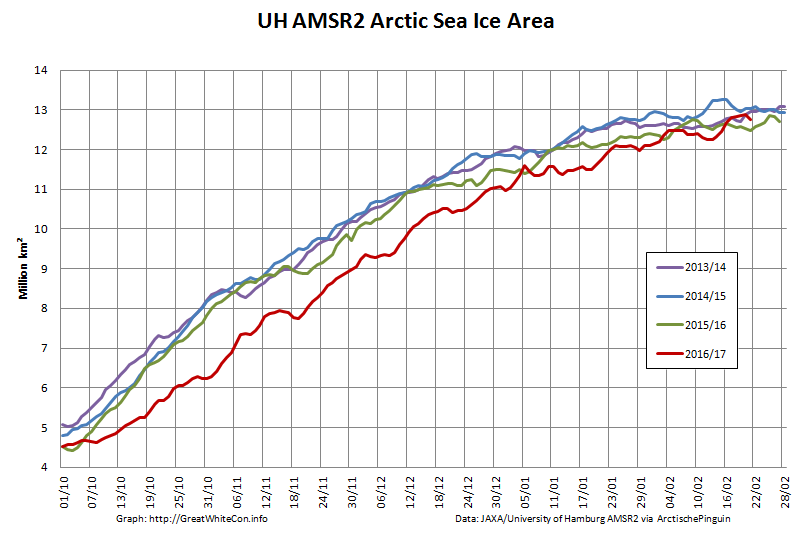
The current maximum area for 2017 is 12.88 million square kilometers on February 20th. Here also is the NSIDC’s 5 day averaged extent:

This reveals a current maximum extent for 2017 of 14.302 million square kilometers on February 20th.
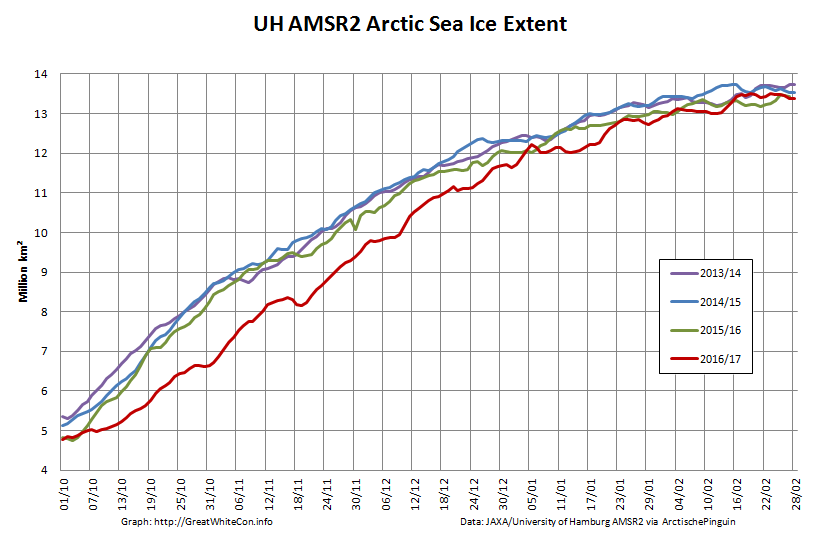
Here are the high resolution AMSR2 area and extent graphs for the end of February:
With each day that passes the highs of February 19th/20th look more likely to have been this years maximum. Nonetheless past experience suggests it’s still far to soon to be sure about that.
Arctic sea ice area and extent are declining again, having reached new heights for the year on March 3rd:
However the 2013/14 winter showed a late surge is still possible.
A “late surge” is looking increasingly unlikely. That being the case, here is our provisional long term graph of NSIDC daily Arctic sea ice extent:
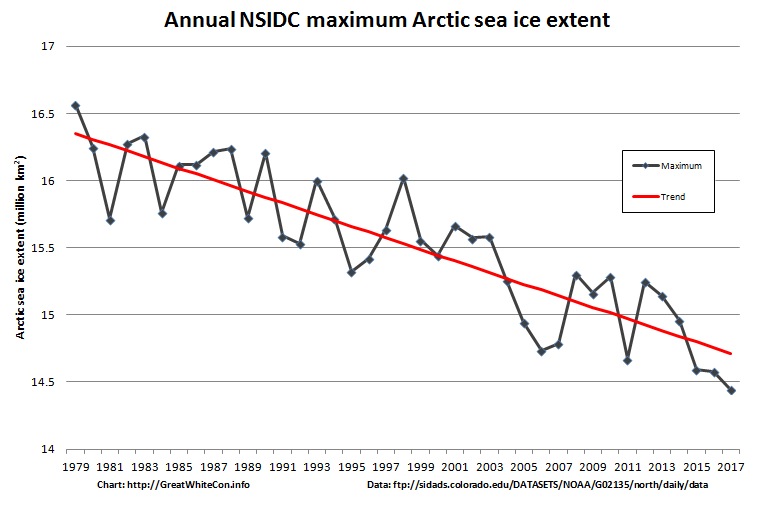
Subject to an unanticipated “surge” the 2017 maximum of 14.447 million square kilometers occurred on March 5th.
JAXA extent has dropped steeply over the last couple of days, and it is now once again “lowest for the date since records began”:
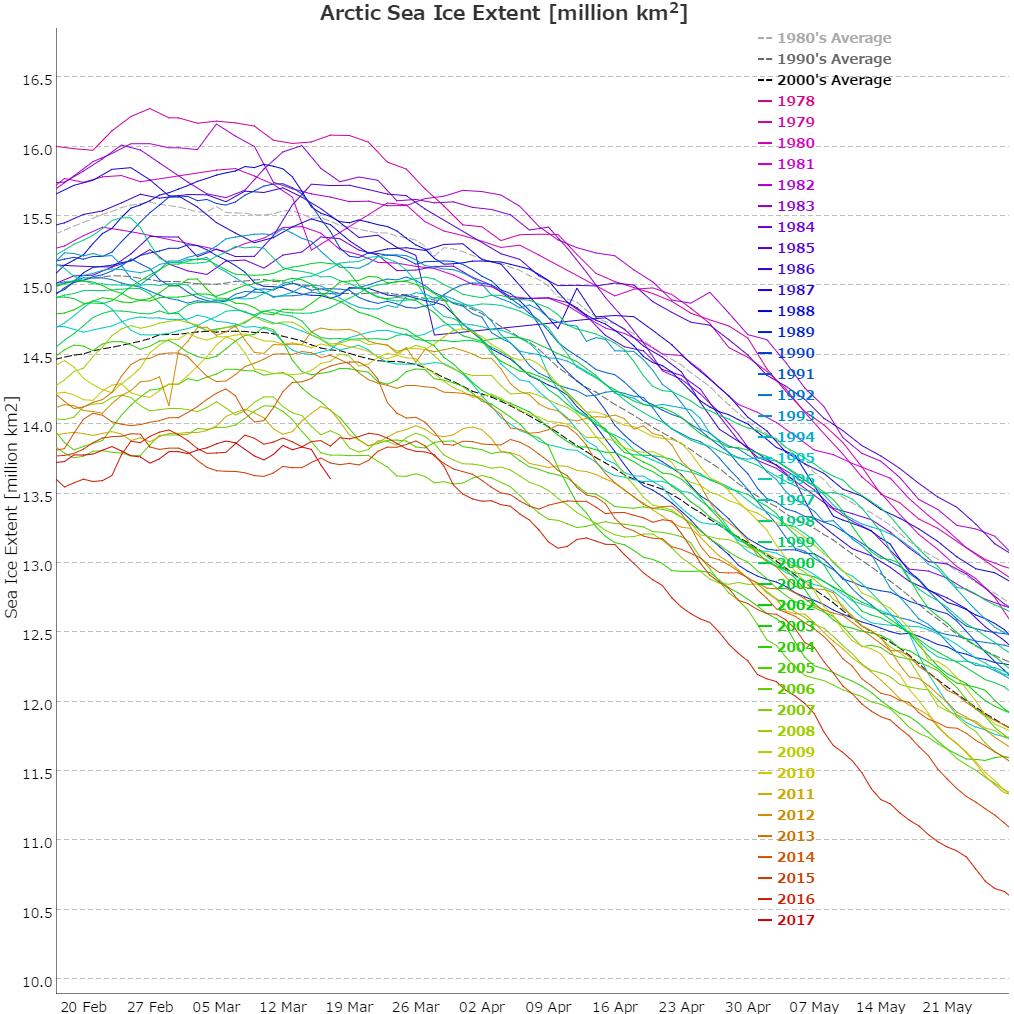
The 2017 JAXA maximum of 13.878 million square kilometers occurred on March 6th.
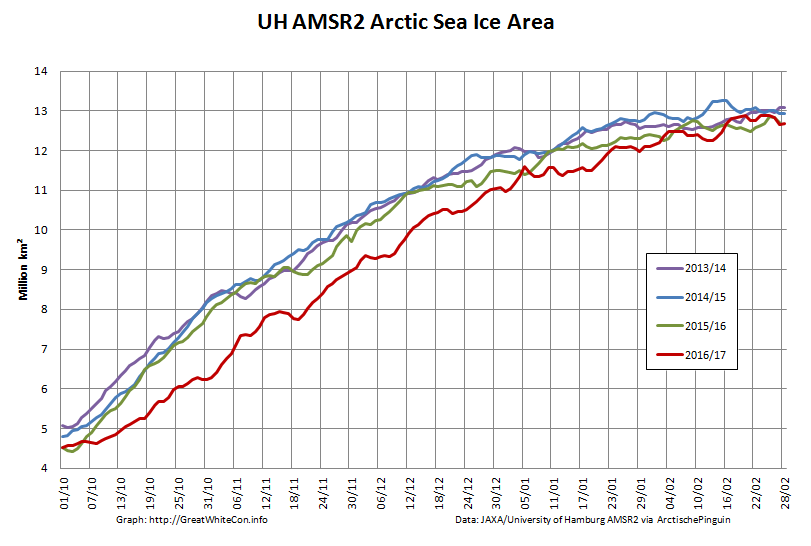
In the continuing absence of updates to Cryosphere Today area, here’s the high resolution Arctic sea ice area graph calculated by “Wipneus” from University of Hamburg/JAXA AMSR2 data:
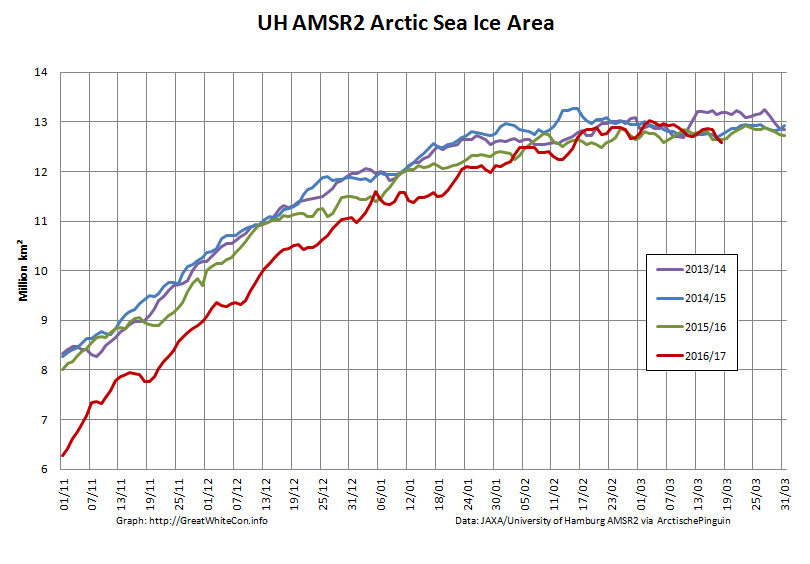
The maximum for that particular metric was 13.03 million square kilometers on March 3rd.
Watch this space!
Jim, I was trying to explain what’s going on- or indeed see evidence of all this being reflected in other indicators- by looking into moulins on Greenland.
The moulins are all on/near the coast when you look at google maps so therefore I shouldn’t be worried about the moulins at all as they are relatively small fry: is that right?
Also a near step change seems to happen in those top two graphs around mid-November… is mid-November itself changing in the Arctic or is that the normal timetable of events?
Are you sure that what you refer to as “moulins” aren’t simply areas of surface melt?
The mid November “hiatus” then “spurt” in area/extent is merely this year’s “weather”. I don’t think you can attribute any more significance to it than that.
Ok, I know nothing about moulins…I’ll get back to that subject one day.
I think you might like this:
Check it out especially around 25:20 .
That new guy, 5to10, on the ASIF posted a 12 minute version of the same thing (…that starts around the 15 minute range I think…)
It’s to do with lakes and, well… I’ll just let you interpret it! I know you like lakes!!
[Embedded video – Jim]
(..and don’t forget to wait for the horrible analogy at the end of question time!)
Thanks SML – I’ve seen it before, but it never hurts to reinforce the message:
UH AMSR2 extent has posted a marginal new high of 13.50 million square kilometres on February 22nd. The previous area maximum hasn’t been exceeded though, and both area and extent are heading down again as we speak:
So is JAXA extent:
Watch this space!
Cool, I am watching this space.
>>
Shared Humanity
ASIF Upper Class
And we must keep in mind that, despite all of the very thick ice in the Beaufort last year, it melted out completely. This melt season will be riveting.
<<
This poster from ASIF says that 2016 WAS (as in, factually!) bad for the multi year sea ice in the arctic.
If my Dad told me in Jan/Feb last year that this year (2016) could be the end of the multi year sea ice in the arctic- because that was obviously the subject of our conversation for the previous, ya know, coupl'a' years: HOW DID HE KNOW THAT?
HOW DID GOVERNMENT DEPARTMENTS WORLDWIDE KNOW THAT 2016 WAS GOING TO BE BAD FOR THE MULTI YEAR SEA ICE IN THE ARCTIC,… (..BECAUSE I'M SAYING THAT THEY ALL SEEMED TO KNOW IT AS A TRUTH!!)
{..obviously I place some small element of faith in my dad: <frustrated plus, lol !??! }
((ha not!!))
Hello Jim, I think you’re right. I posted my blog on the new arctic SIE record low maximum today (March 18). I’ve been checking against the JAXA Vishop page, and at this point over 75% of the SIE maximums for previous years have already passed, but the real clincher was that as of (actually 15/3) there has been no year in the past 17 years where the SIE has risen from this date by more than the SIE for 2017 has fallen since its maximum on 06/03. For the figures up to 16/03, the 2017 fall from its maximum is around twice that of the maximum rise in every previous year since 2000 from 16/03.
Therefore the maximum can be called.
Mornin’ Julian (UTC)
Your analysis parallels my own. JAXA extent dropped another ~50k or so this morning.
I clicked through to your site and I’m intrigued. Apart from programming mainframes in FORTRAN I learnt my craft using Z80 assembler on a Nascom 1!
I thought I’d add the current state of play of DMI extent too, but they seem to be working on their site this weekend?
http://ocean.dmi.dk/arctic/icecover.uk.php
The DMI web site is back up and running, so without further ado here’s DMI temperature:
followed by DMI extent:
We’ll need to wait a while for the red “operational” line to turn black, but it looks as though DMI (or OSI-SAF in actual fact) has posted a much later maximum than the other metrics we’ve looked at so far.
Last but not least here’s the University of Bremen’s AMSR2 based extent:
The NSIDC have officially called the 2017 maximum extent. In a press release they say that: