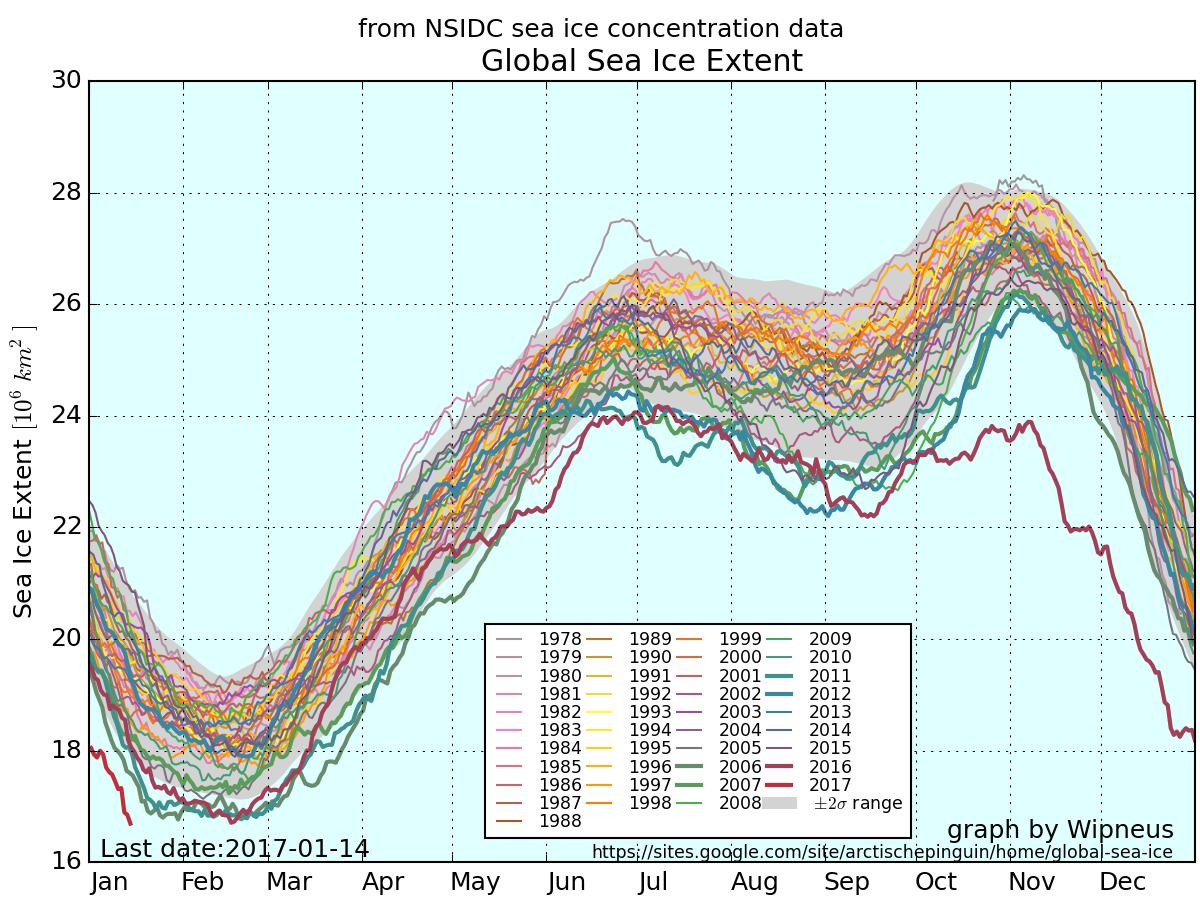
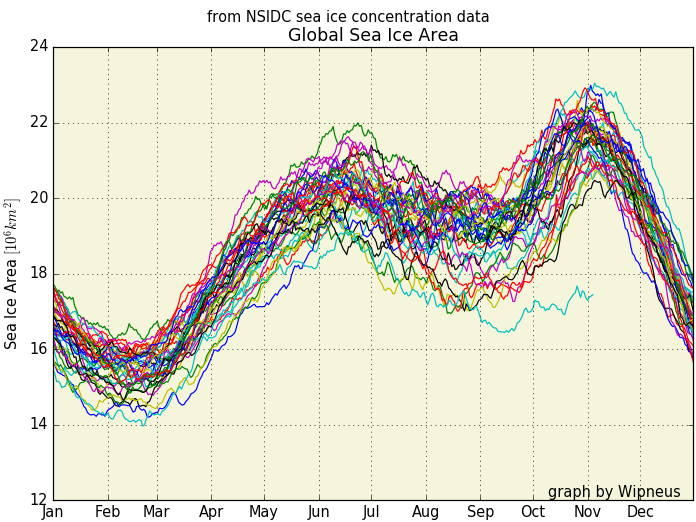
Here once again is the up to date version of Wipneus’ graphic graphic, this time of global sea ice extent:
As you can see, global sea ice extent has just reached the lowest ever level in the National Snow and Ice Data Center’s satellite records going back to 1979. It was over a month later when the previous record was broken in February 2016, so there is plenty of time for the metric to fall further.
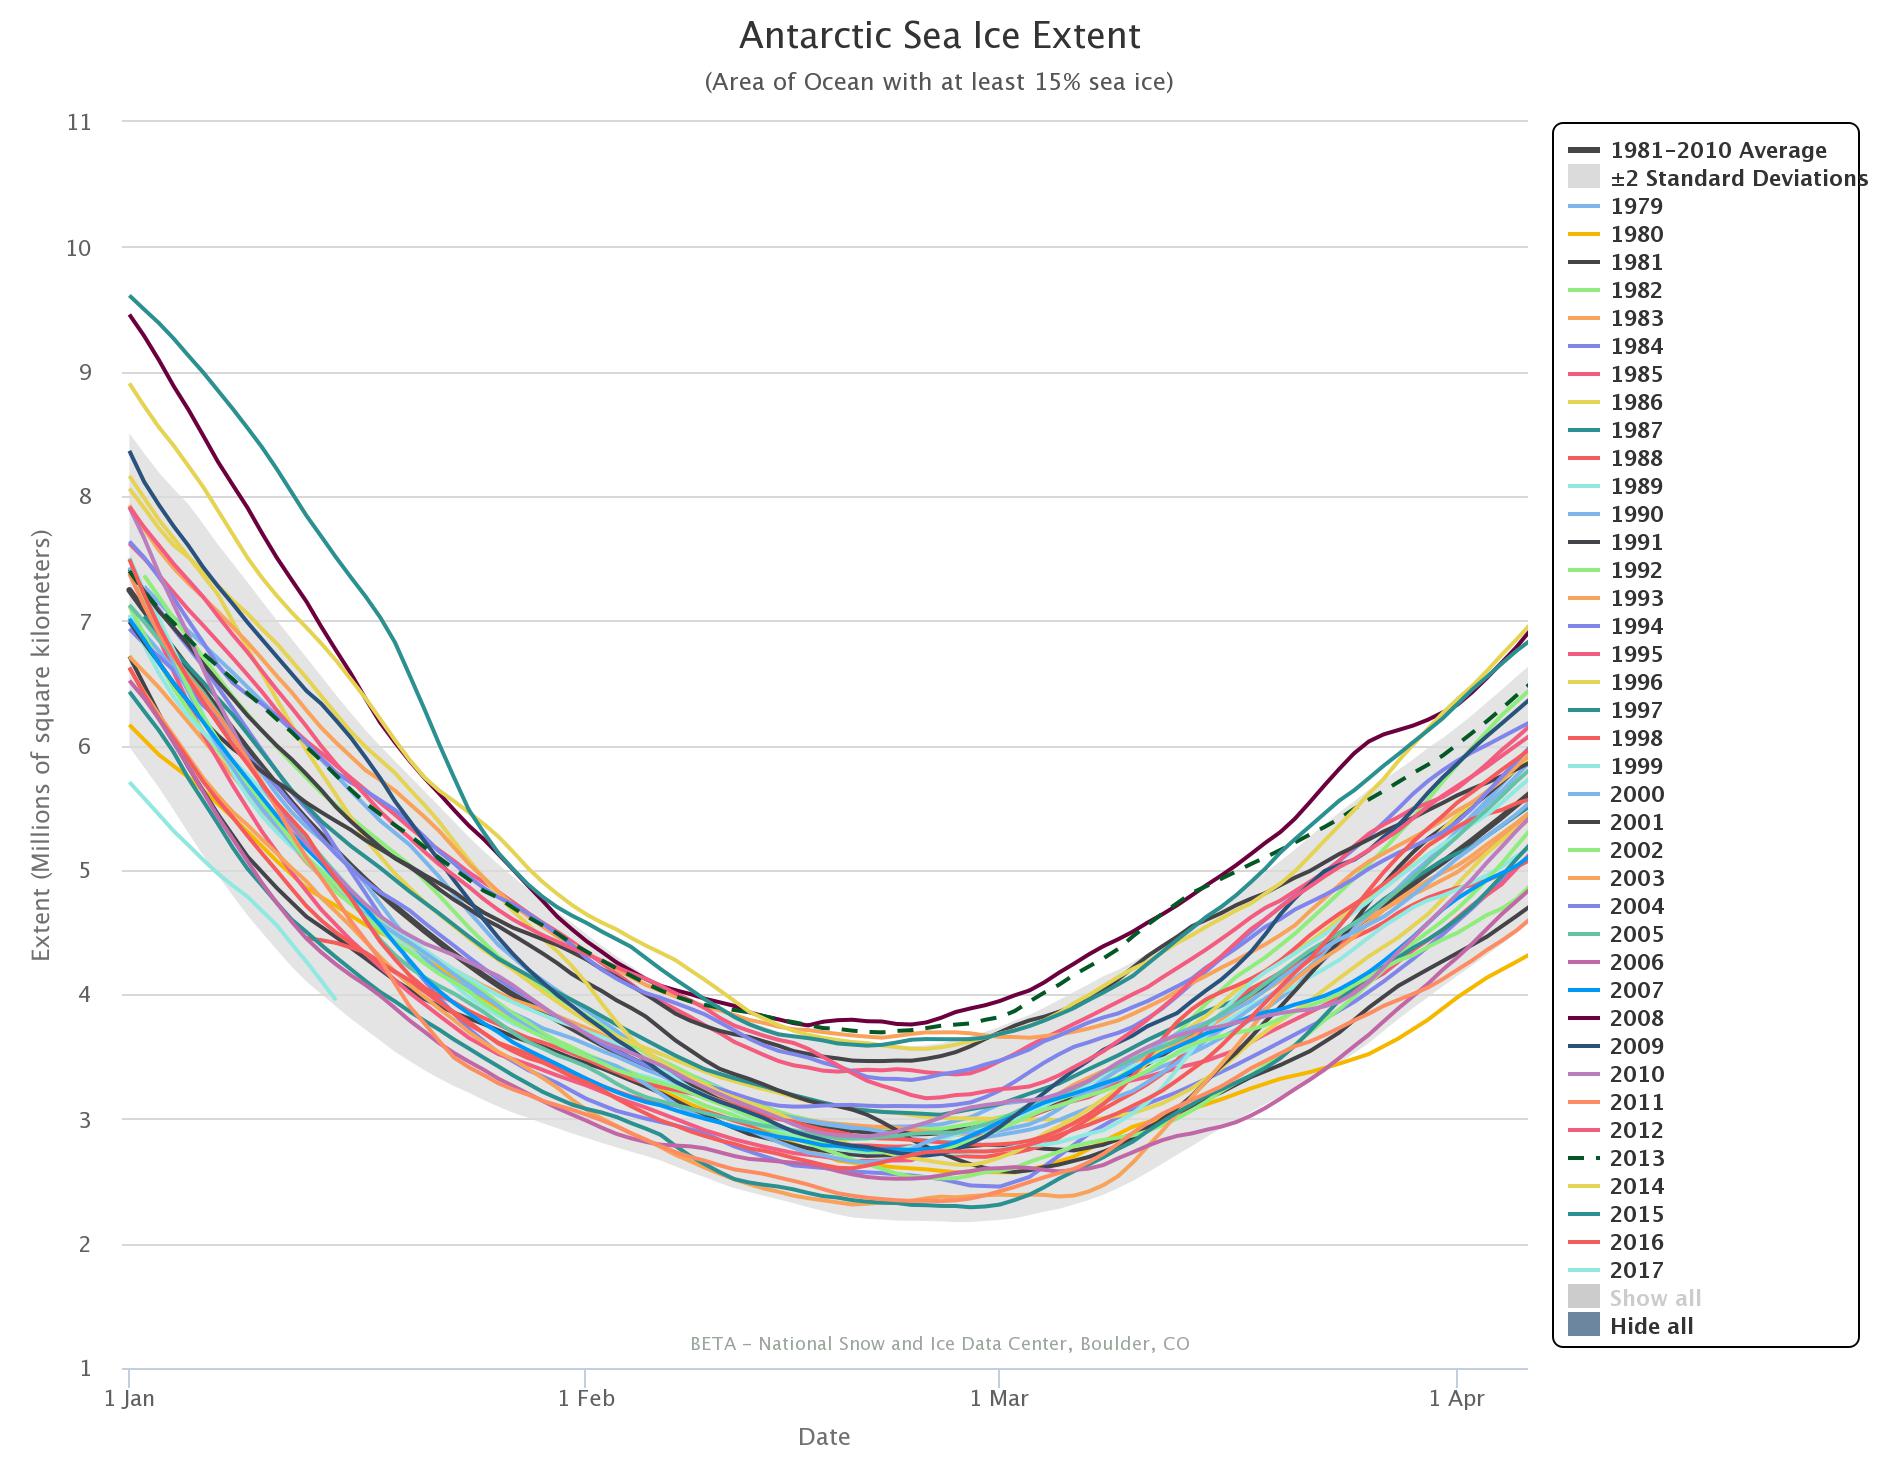
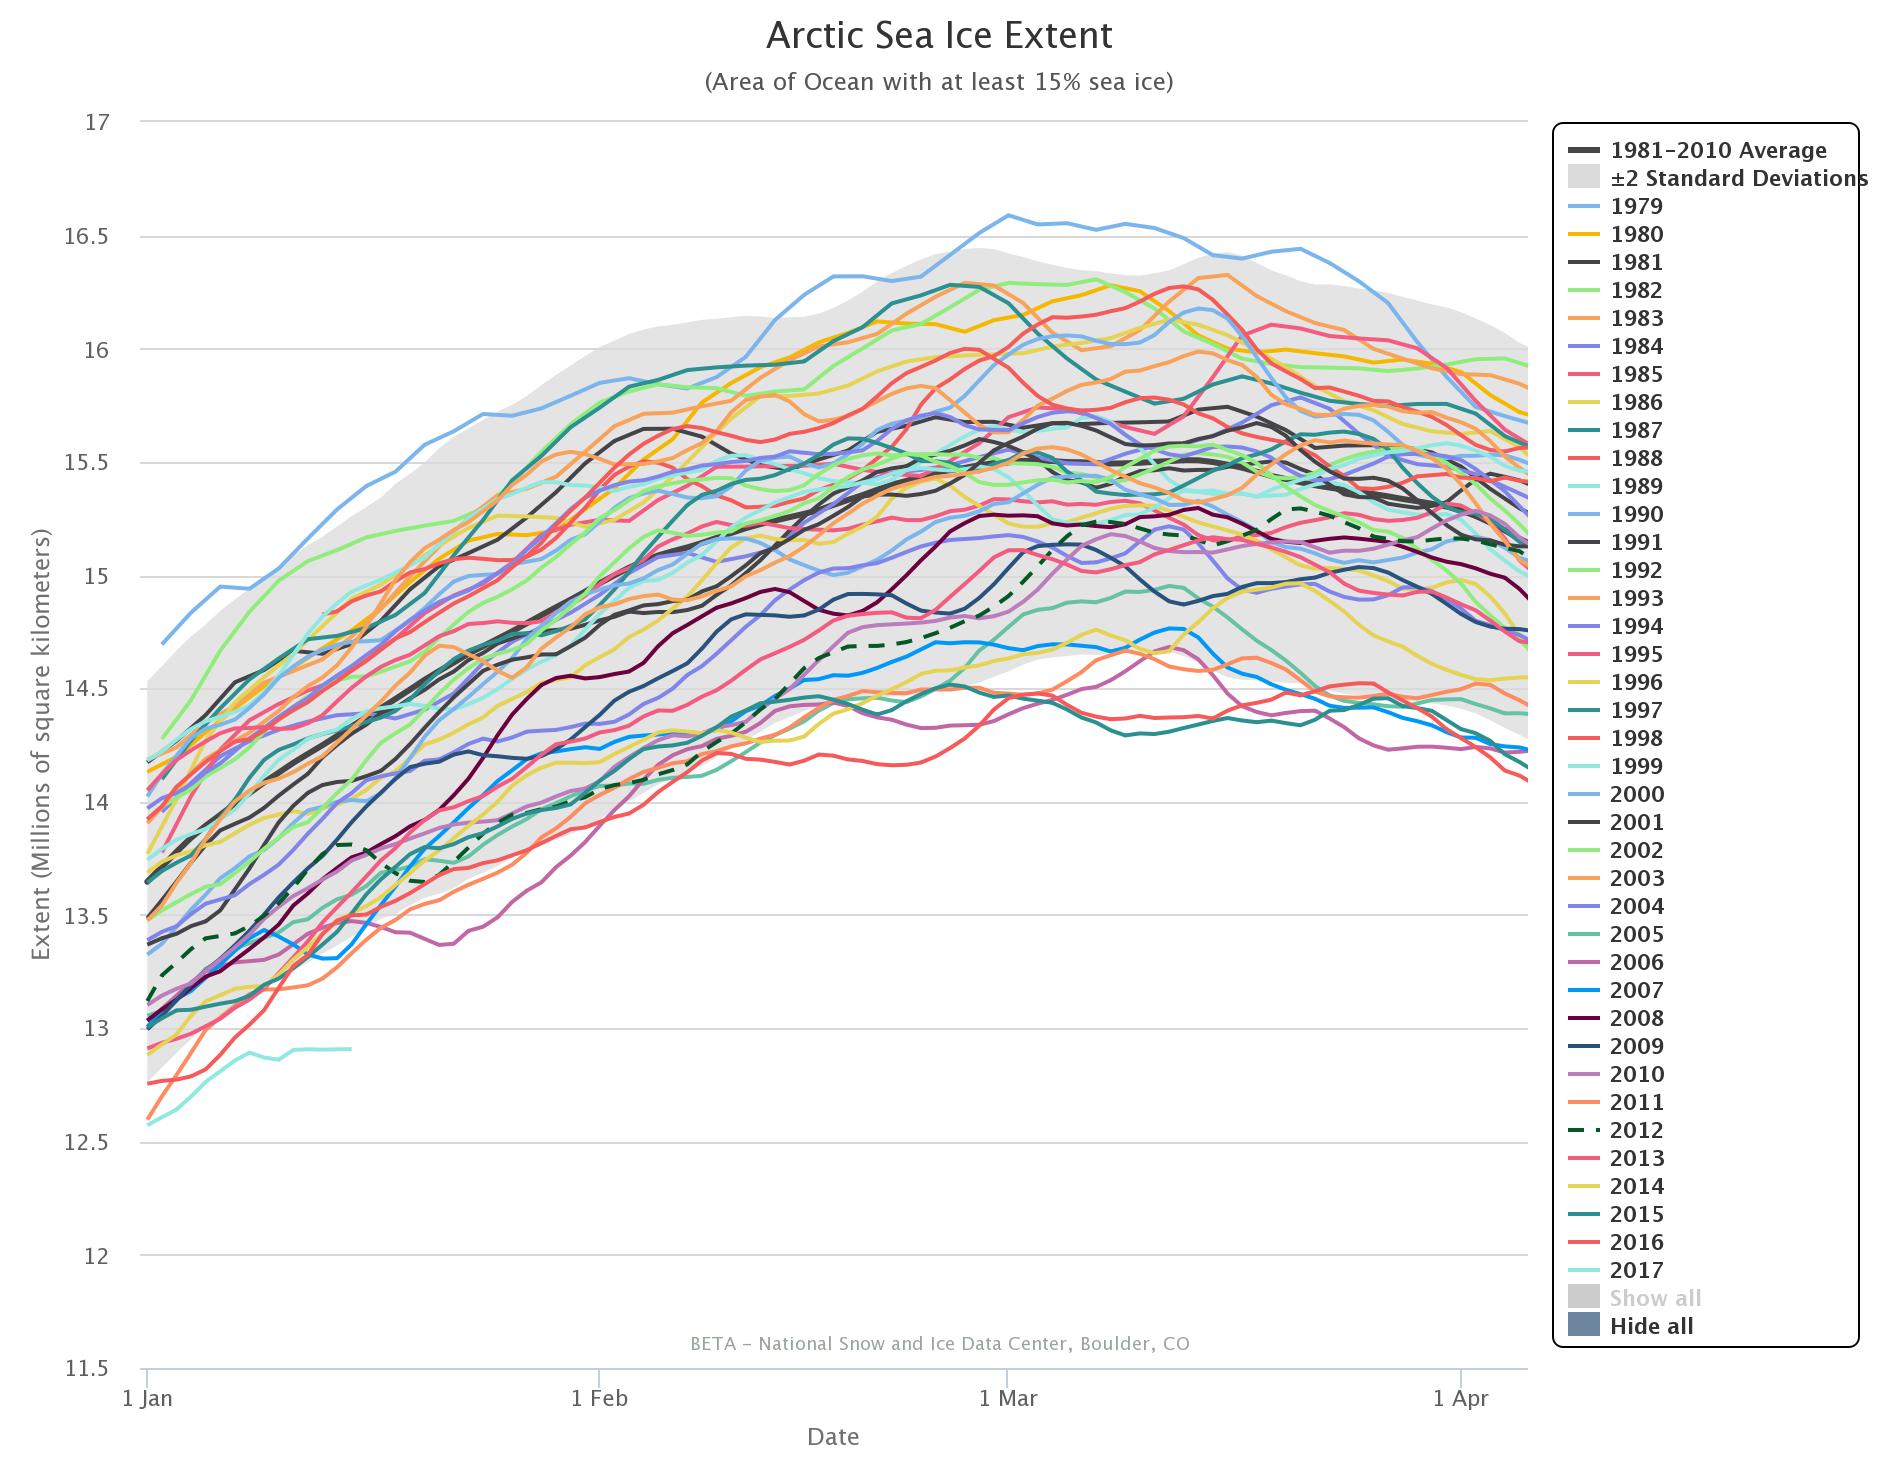
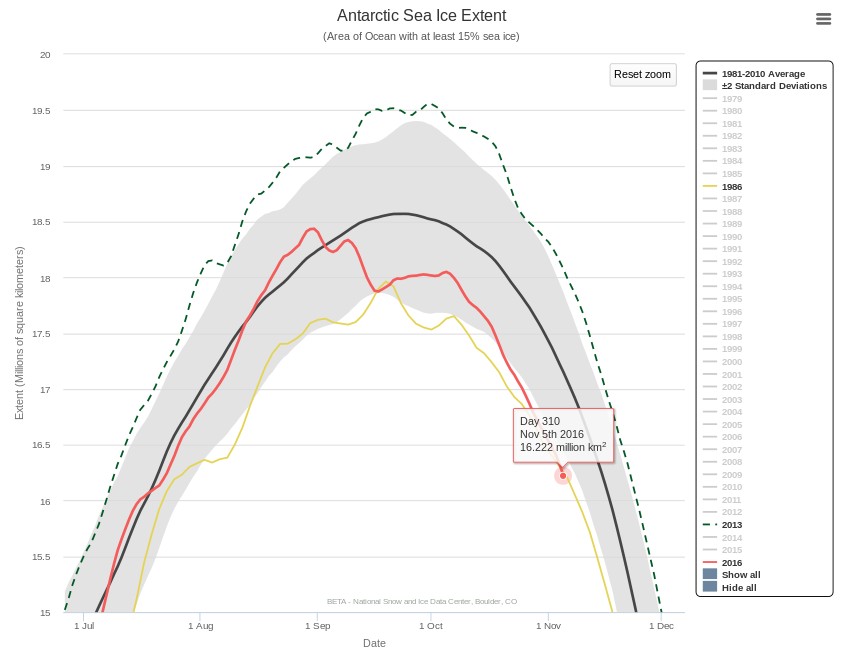
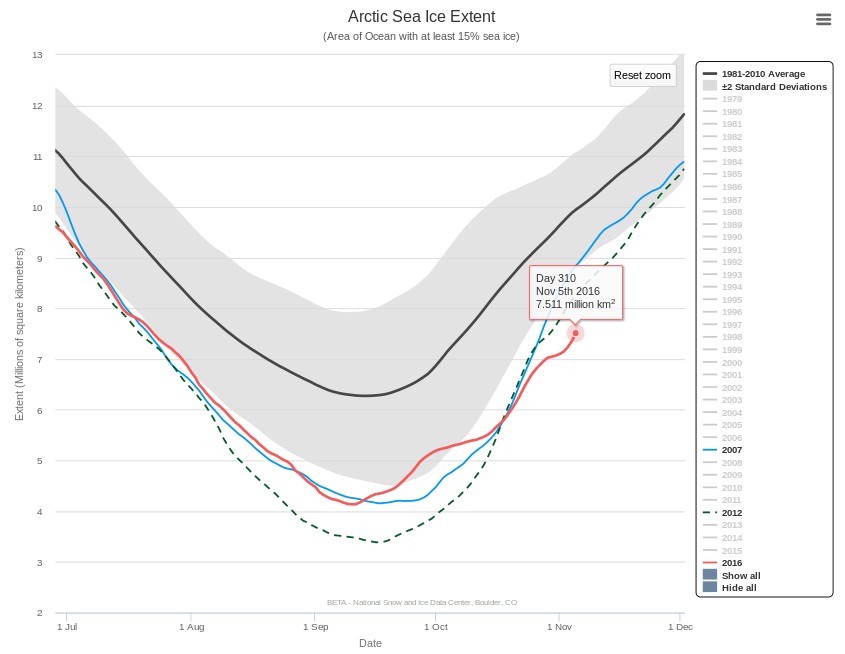
The 2017 curves in the NSIDC’s own extent graphs are coloured in a pale shade of blue. Even so they’re easy to pick out since both Antarctic and Arctic extent are at the lowest level for the date in NSIDC’s records by a considerable margin:
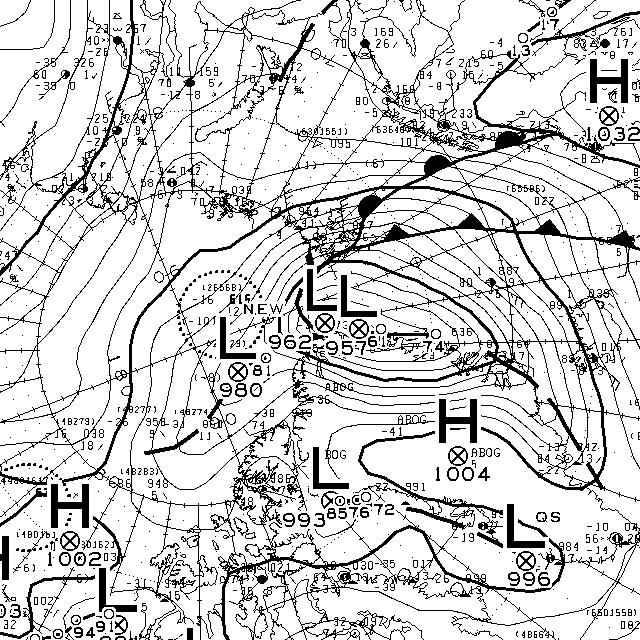
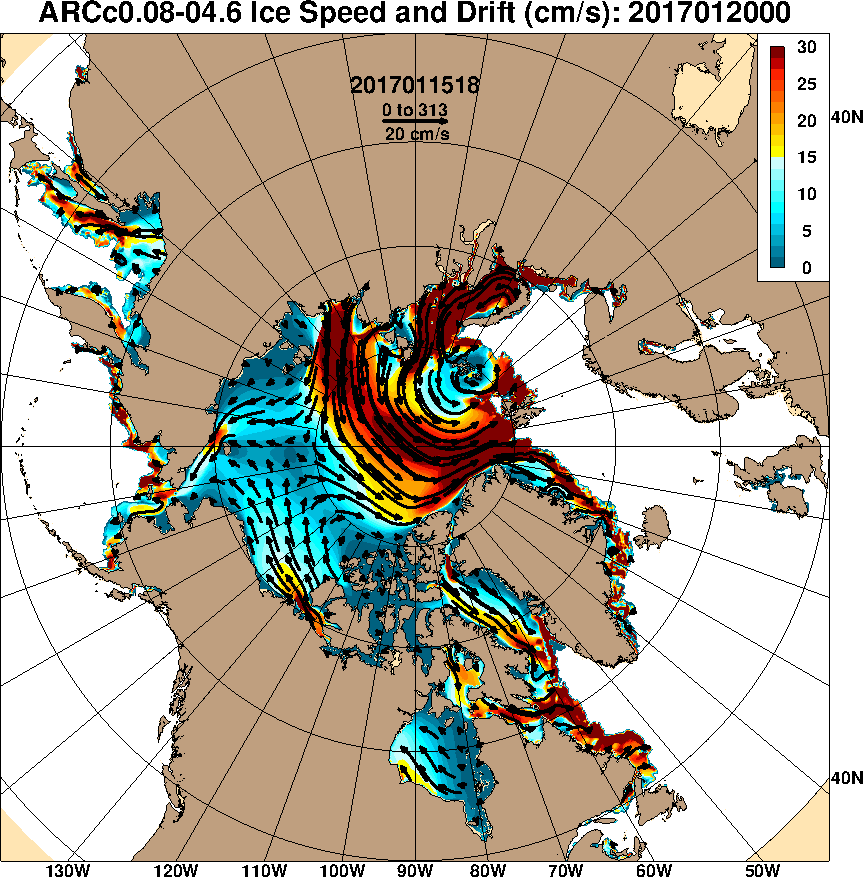
Antarctic sea ice extent is still falling, and the Arctic has been flatlining for several days now and more trouble is heading its way. Another Fram Strait cyclone is brewing, and this time around the storm’s minimum central pressure is already down to 957 hPa according to Environment Canada:
According to the current forecasts it will continue to spin over the central Arctic for several more days, driving export of sea ice via the Fram Strait:
NSIDC 5 day averaged Antarctic sea ice extent is now at a record low level for the date, since satellite measurements began in 1979:
NSIDC 5 day averaged Arctic sea ice extent has been at a record low level for the date for quite a while:
Combining those two facts means that global sea ice extent is also at a record low level for the date by a considerable margin. The gap with all previous years in the satellite record is even more stark if you look at global sea ice area:
Regular readers will recall that we recently announced this “Shock News!” in a comment below our “Arctic Sea Ice Area and Extent Lowest ^Ever” article. Here is the graphic evidence again:
And here is a story about what it takes to convince a “climate change skeptic” about the crysopheric facts of life:
This measure doesn’t tell us all that much about the health of either Arctic or Antarctic regions, if only because the seasons move in opposite directions (nevertheless, the Global sea ice trend is down). It’s just an interesting statistical factoid.
However, climate risk deniers often use the Global sea ice metric as an argument that nothing is wrong and AGW is a hoax. In other words, the recent growth in Antarctic sea ice offsets the loss of Arctic sea ice (it doesn’t), even though the poles are literally worlds apart and are pretty much incomparable (except for the sea ice bit).
Using this logic, it would seem that this new record minimum means there is something wrong with sea ice and AGW isn’t a hoax. I wonder how they will spin this one. If they report it to their loyal readers, that is.
So far none of the “climate risk deniers” I’ve pinged on Twitter have brought this “interesting statistical factoid” to the attention of “their loyal readers”.
* Since satellite records began
^ For the day of the year
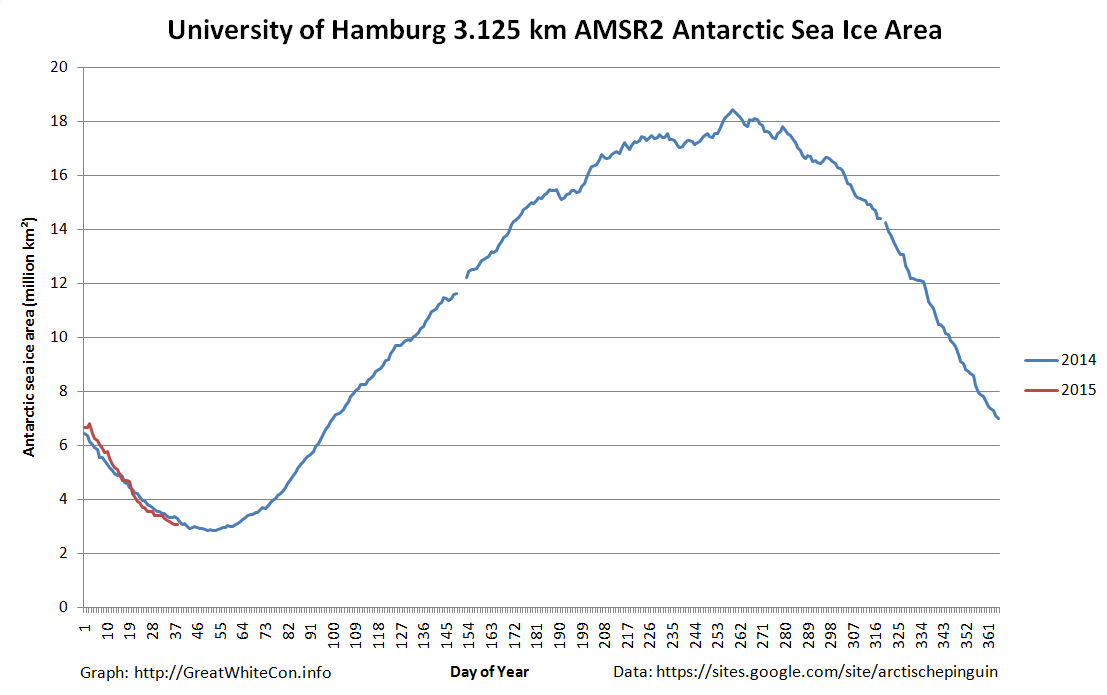
In the Arctic the refreeze is slowing down as the March maximum extent approaches. Meanwhile in the southern hemisphere Antarctic sea ice extent has taken a tumble as the annual minimum extent approaches.
Over the long cold Arctic winter “Wipneus” of ArctischePinguin fame has been porting his northern hemisphere regional sea ice area/extent methodology to cover the South Pole as well. We are pleased to be able to reveal the fruits of his labours on our new regional Antarctic Sea Ice Graphs page. The ultimate source of the information is the University of Hamburg’s sea ice concentration data based on a 3.125 km grid that uses data from the from the AMSR2 instrument on board the Japan Aerospace Exploration Agency’s SHIZUKU satellite. Here’s an overview of Antarctic sea ice area:
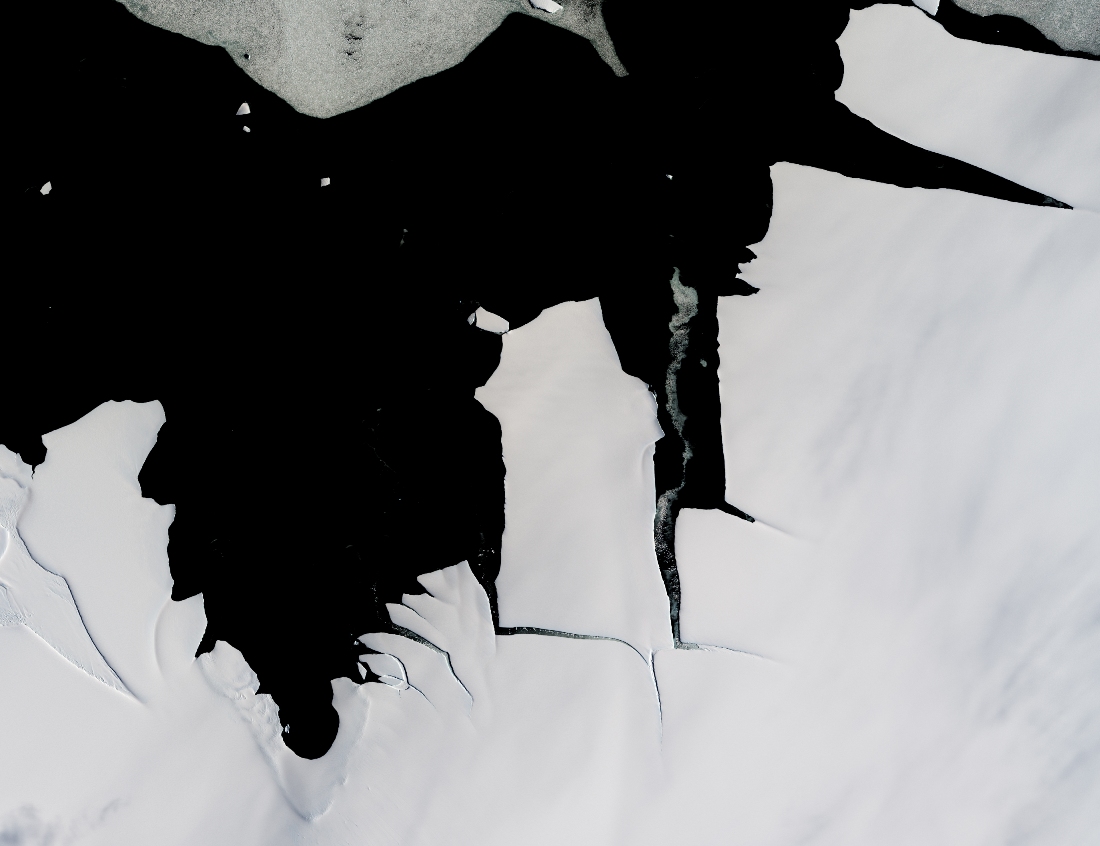
and here’s a close up on the sea ice extent in the Bellingshausen and Amundsen Seas region, where what sea ice there is helps buttress the West Antarctic Ice Sheet:
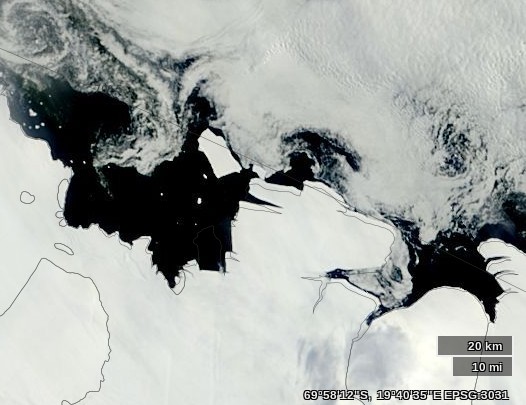
In future we will also be bringing you satellite images from Antarctica. By way of example, here’s the latest “Shock News!!!” from the Antarctic, courtesy of LandSat 8:
NASA report that:
While large icebergs calve regularly from fast-flowing ice shelves in West Antarctica, the coast of cooler, drier East Antarctica tends to be less active. That made it a mild surprise when a 70-square-kilometer chunk of ice broke off from the King Baudouin Ice Shelf in January 2015. The last time that part of King Baudouin calved such a large iceberg was in the 1960s.
and you can track the current position of the latest large chunk of ex ice shelf on their WorldView web site:
The recently calved King Baudouin Ice Shelf on February 3rd 2015
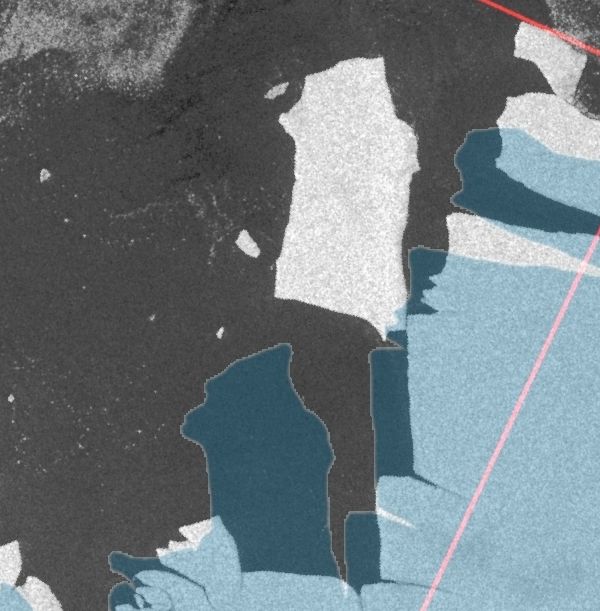
Thanks also to “Arcticio” from the Arctic Sea Ice Blog who pointed me in the direction of PolarView, where it was remarkably easy to locate this Sentinel-1A synthetic aperture radar image of the large iceberg in question on January 30th 2015:
Perhaps “conversation” is somewhat too strong a word? We have somehow managed to engage the Mail on Sunday’s top investigative journalist (AKA David Rose) in a debate about sea ice on Twitter. For some strange reason he tried to change the topic from the Arctic to the Antarctic!
Now seems like an entirely appropriate time to bring the latest “Shock News!” from the Arctic to the attention of the “mass media” here in once Great Britain. Here’s a copy of an email I sent to John Wellington over at The Mail earlier today:
Us:
Re: PCC – Global cooling in an ideal world
Hello again John,
Further to our previous correspondence on this controversial topic here is the latest “shock news” from the Arctic, hot off the presses down here at Ivory Towers:
In view of the recent inclement weather in this neck of the woods, perhaps you could forward it on to one of your finest investigative reporters for me?
Best wishes,
Jim Hunt
Them:
It’s now March 15th 2014, and this morning I received a “Dear Jim” note from John:
Dear Jim,
Nice to hear from you and I trust you were not hit by the West Country floods, climate-influenced or not.
I have discussed your message with a colleague who is interested in these things and we conclude that March is a little early in the year to be drawing significant conclusions. I have been shown some different graphs that appear to show 2014 is not dissimilar to the last few years. I am attaching these for your information.
Best regards
John
Us:
Dear John,
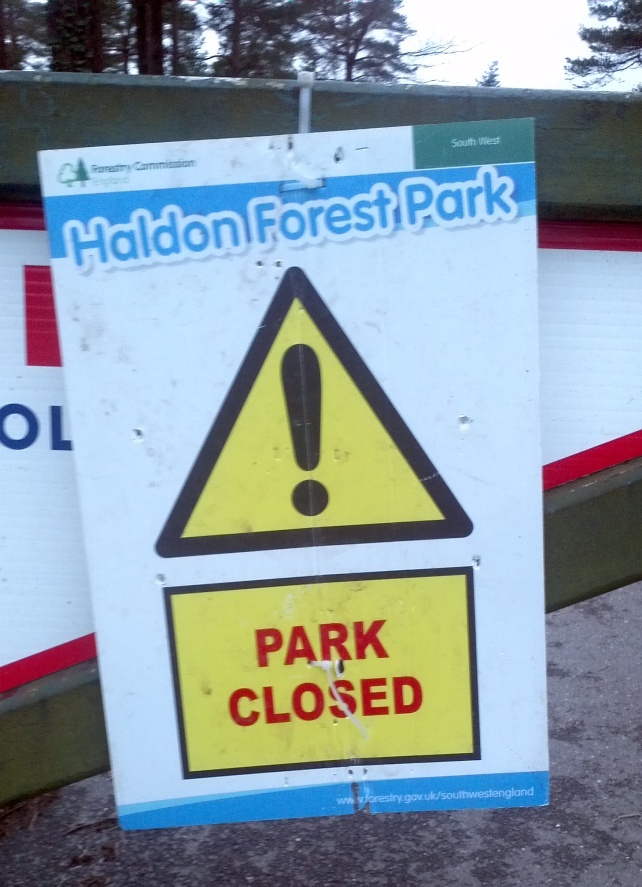
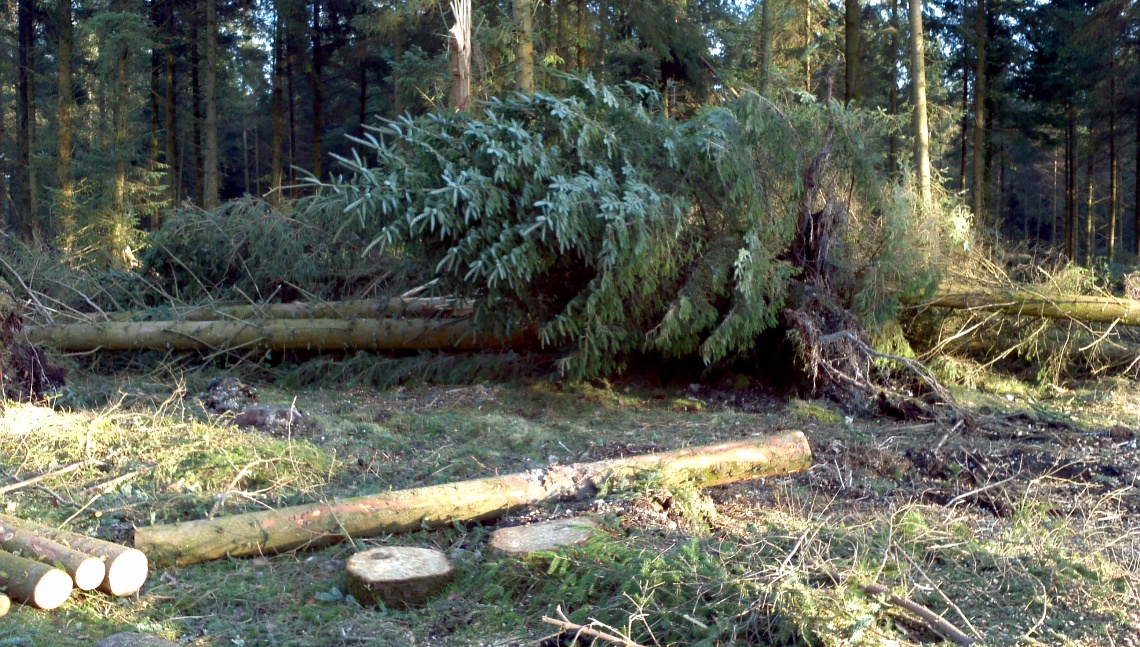
Thank you for your kind words. We’re situated halfway up Haldon, so we avoided the worst of the inclement weather. The top of the hill took a bit of a battering however.
The entrance to Haldon Forest Park on February 24th 2014Haldon Forest Park on March 8th 2014
Our garden suffered a bit too, but thankfully the house was OK.
A new spring gushes from the side of Haldon Hill on Valentine’s Day 2014
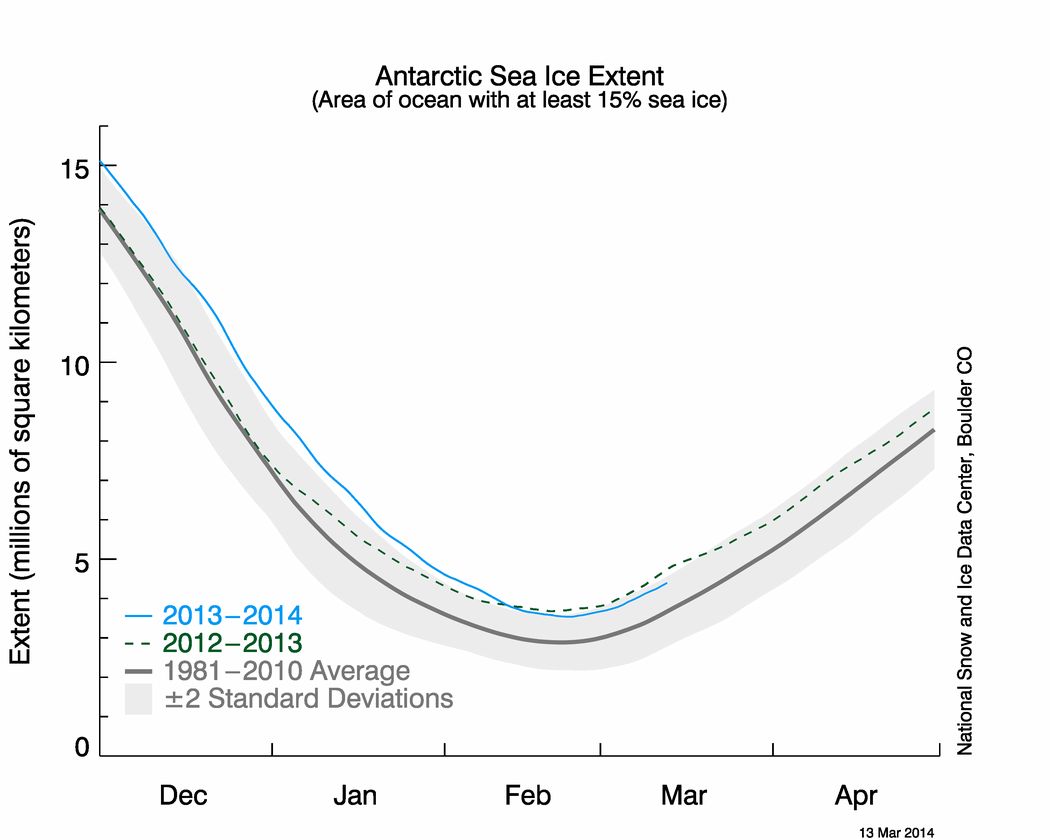
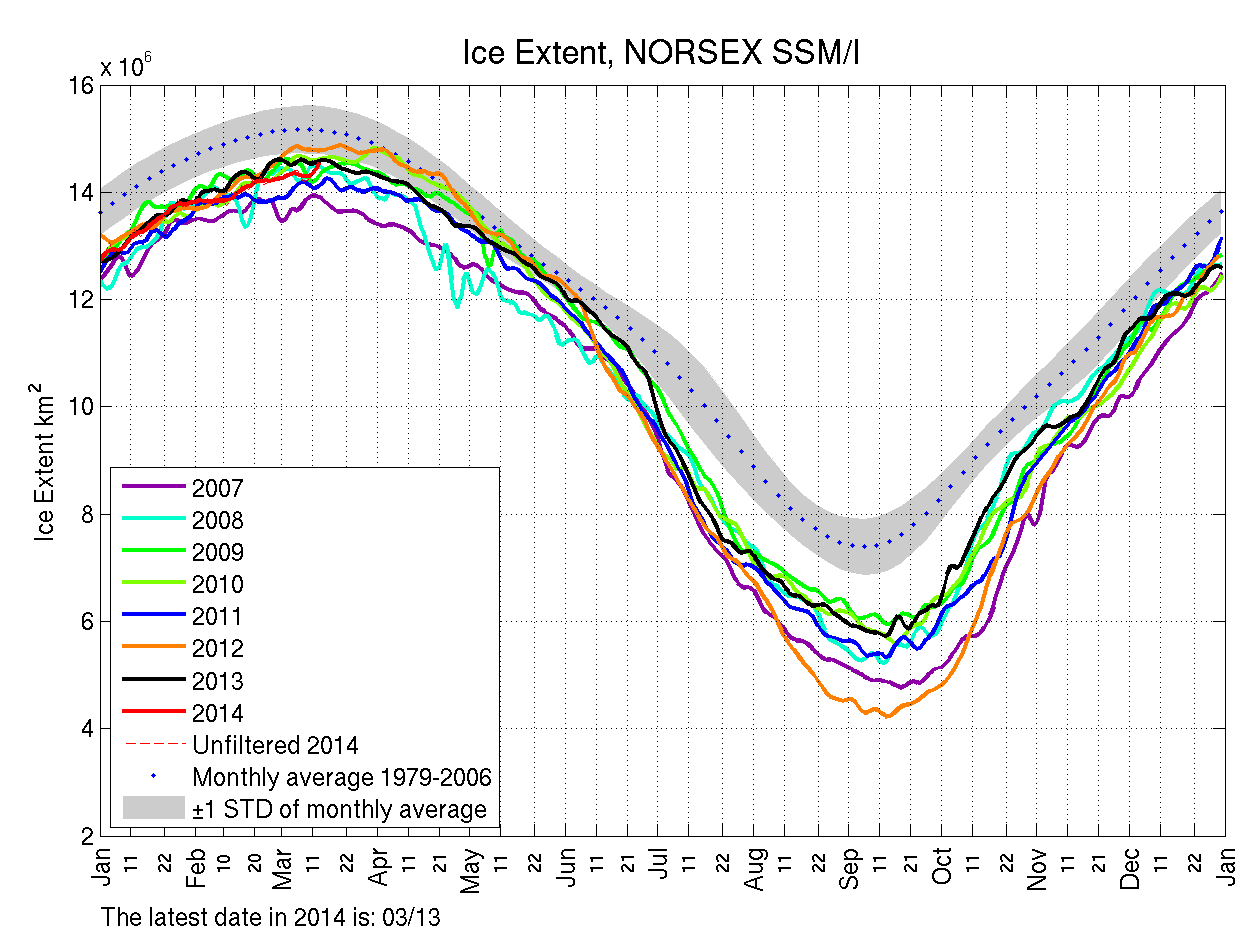
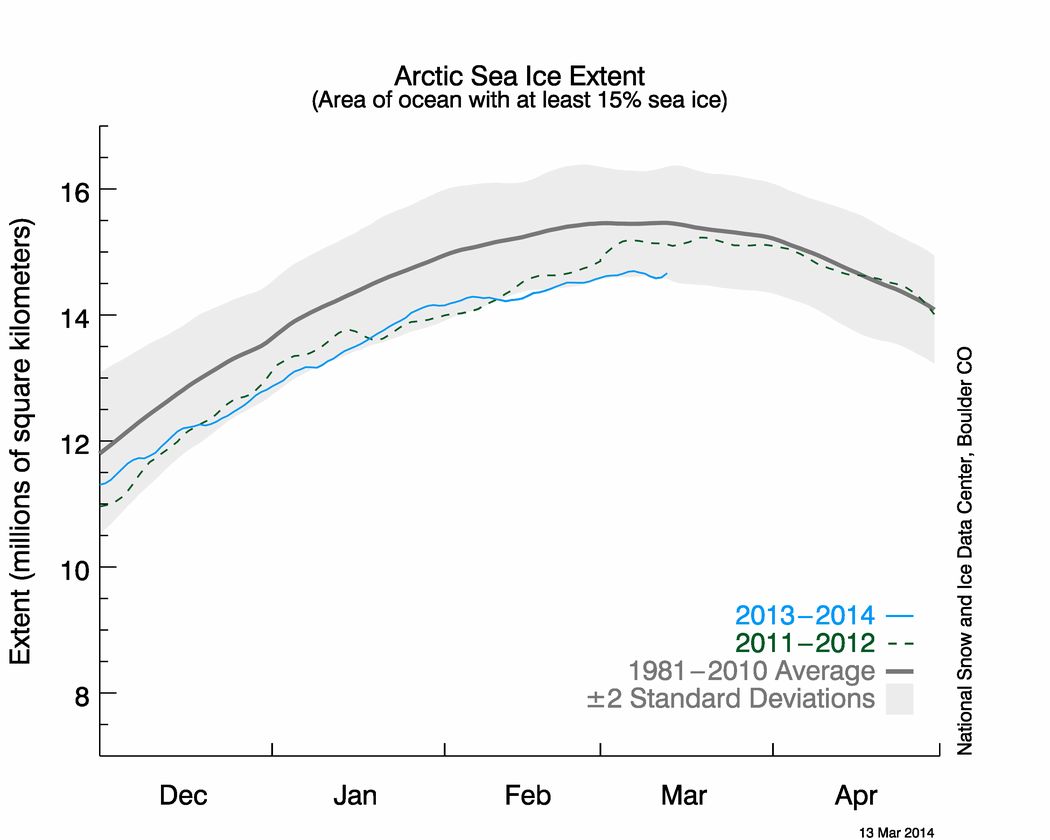
Regarding your own attachments, perhaps in the first instance you might ask your colleague to explain why he or she chooses to send you a NORSEX Arctic sea ice extent graph rather than one from the NSIDC, which I believe we established last summer is The Mail’s oracle on such matters? Please take a good look at the latest NSIDC equivalent to the Antarctic extent graph you sent me, which I attach for your convenience.
NSIDC Arctic sea ice extent graph for March 13th 2014
Whilst you’re at it perhaps you could also ask your colleague to answer at least the first three of these simple questions:
You may also wish to pass on to your colleague the shock news that earlier this week the daily atmospheric carbon dioxide readings from Mauna Loa rose above 400 ppm almost 2 months earlier than last year?
This website uses cookies to improve your experience. We'll assume you're ok with this, but you can opt-out if you wish. Cookie settingsACCEPT
Privacy & Cookies Policy
Privacy Overview
This website uses cookies to improve your experience while you navigate through the website. Out of these, the cookies that are categorized as necessary are stored on your browser as they are essential for the working of basic functionalities of the website. We also use third-party cookies that help us analyze and understand how you use this website. These cookies will be stored in your browser only with your consent. You also have the option to opt-out of these cookies. But opting out of some of these cookies may affect your browsing experience.
Necessary cookies are absolutely essential for the website to function properly. This category only includes cookies that ensures basic functionalities and security features of the website. These cookies do not store any personal information.
Any cookies that may not be particularly necessary for the website to function and is used specifically to collect user personal data via analytics, ads, other embedded contents are termed as non-necessary cookies. It is mandatory to procure user consent prior to running these cookies on your website.