A Happy New Year to our loyal reader(s) from the shores of (the now frozen) Santa’s Summer Swimming Pool:
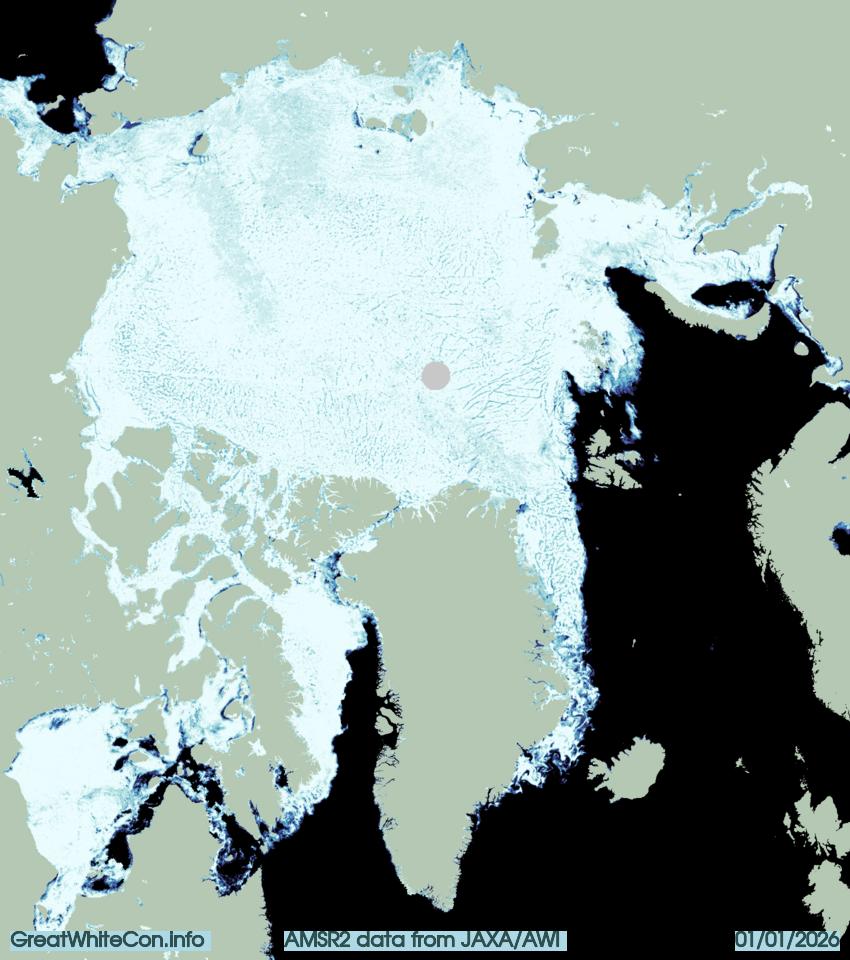
Note that for the hardy, swimming is still possible north of Svalbard, in parts of Hudson Bay and the North Water Polynya.
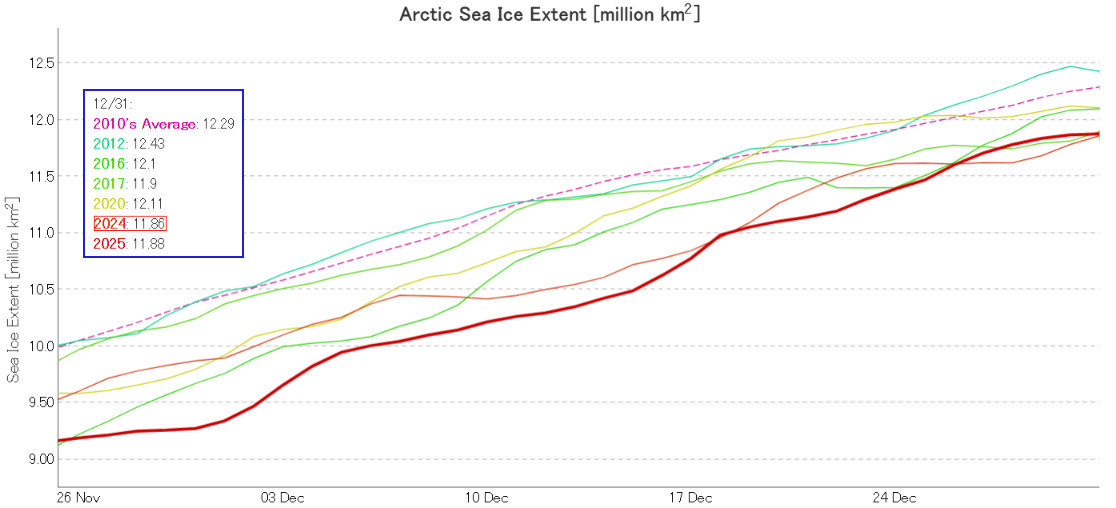
At the end of 2025 JAXA extent was 2nd lowest for the date, albeit in a “statistical tie” with 2024 and 2017:
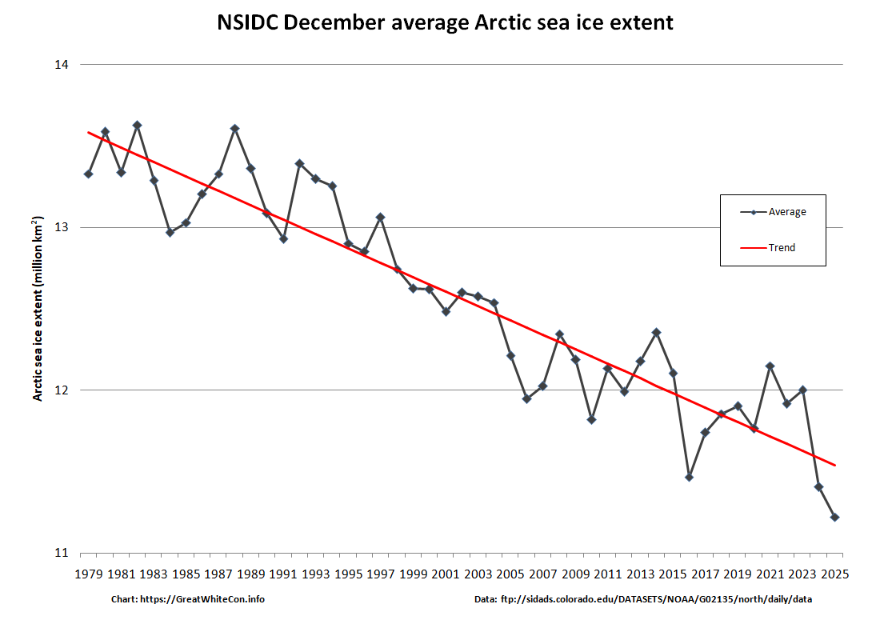
NSIDC average extent for December is lowest in the satellite era by a considerable margin:
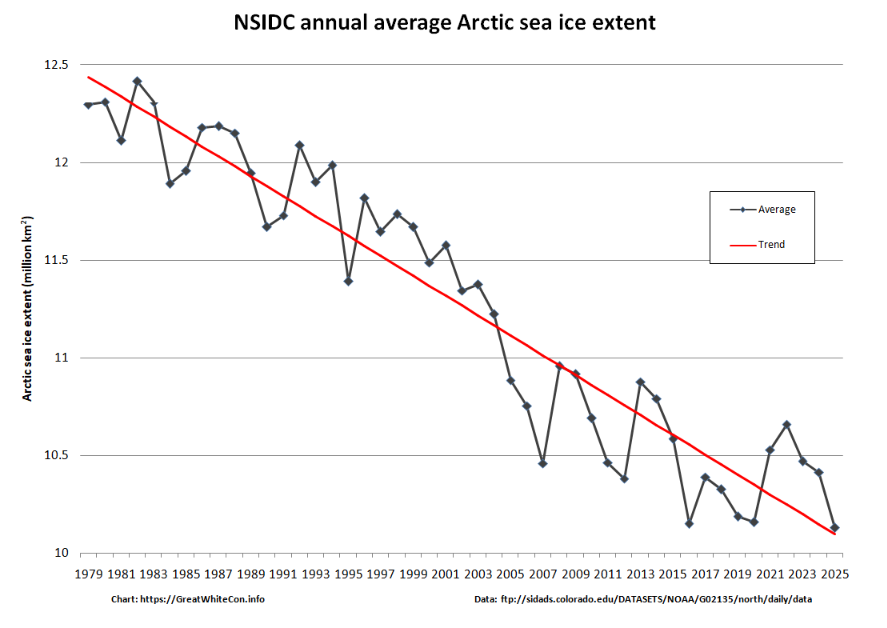
NSIDC annual average extent for 2025 is also record lowest:
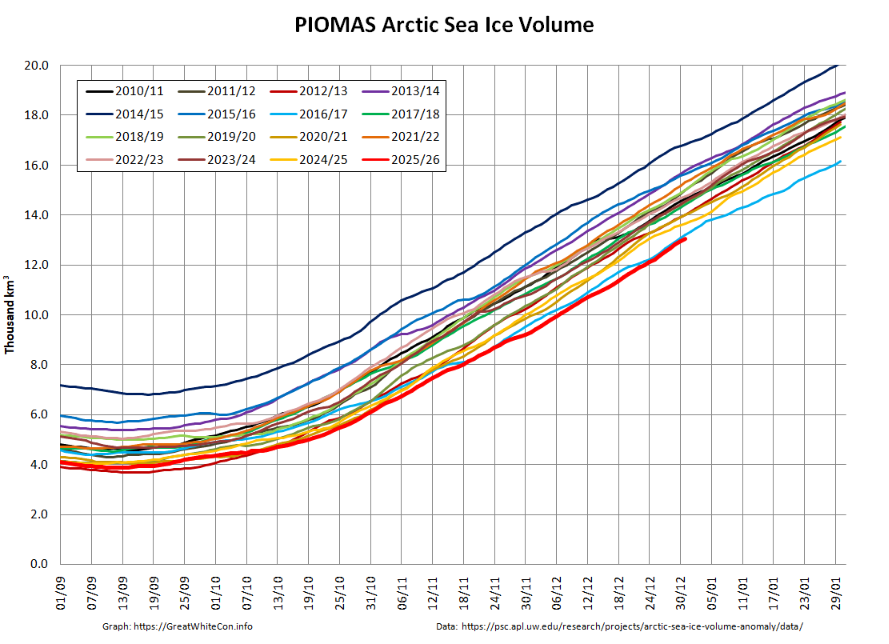
At the end of December PIOMAS volume was still lowest for the date (in the satellite era):
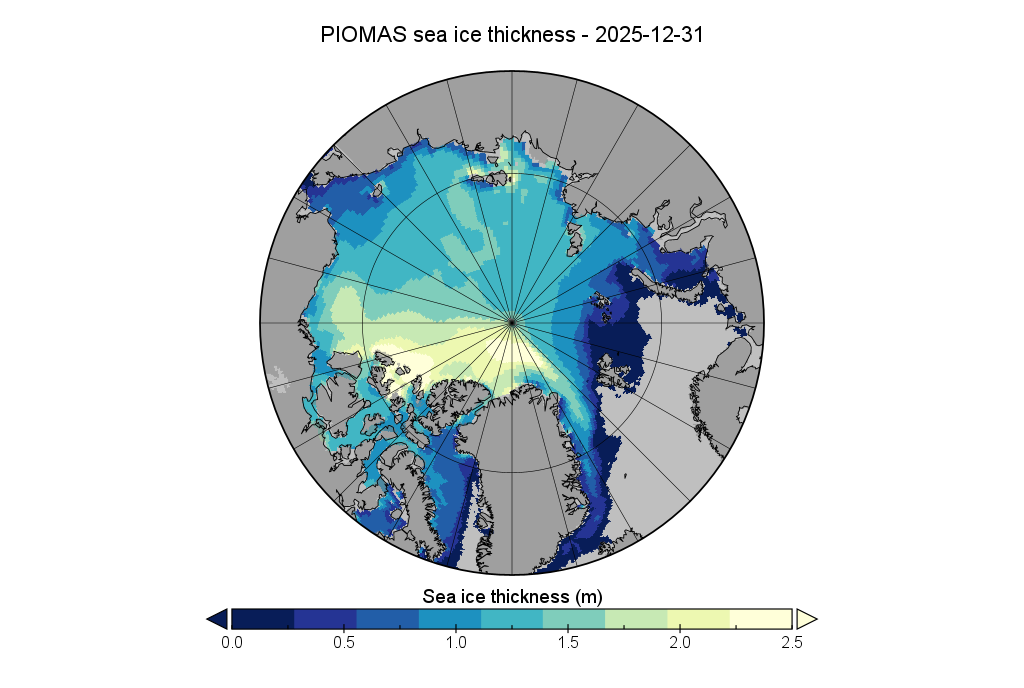
Here’s the associated sea ice thickness map:
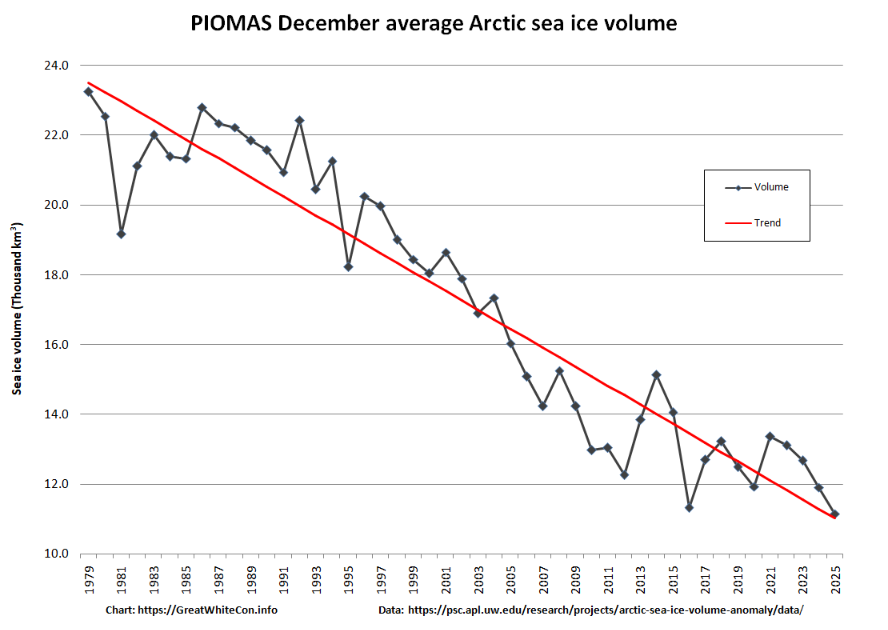
What’s more the PIOMAS monthly average volume for December is lowest in the record going back to 1979:
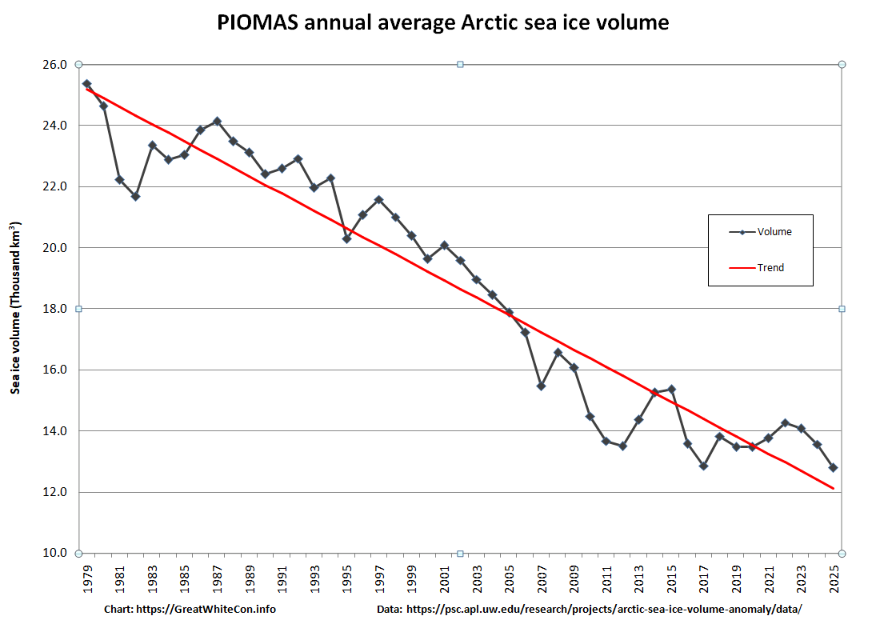
So is the annual average for 2025:
Shock News!!!
The NCEP is currently forecasting a proverbial “blue ocean event” in September 2026:
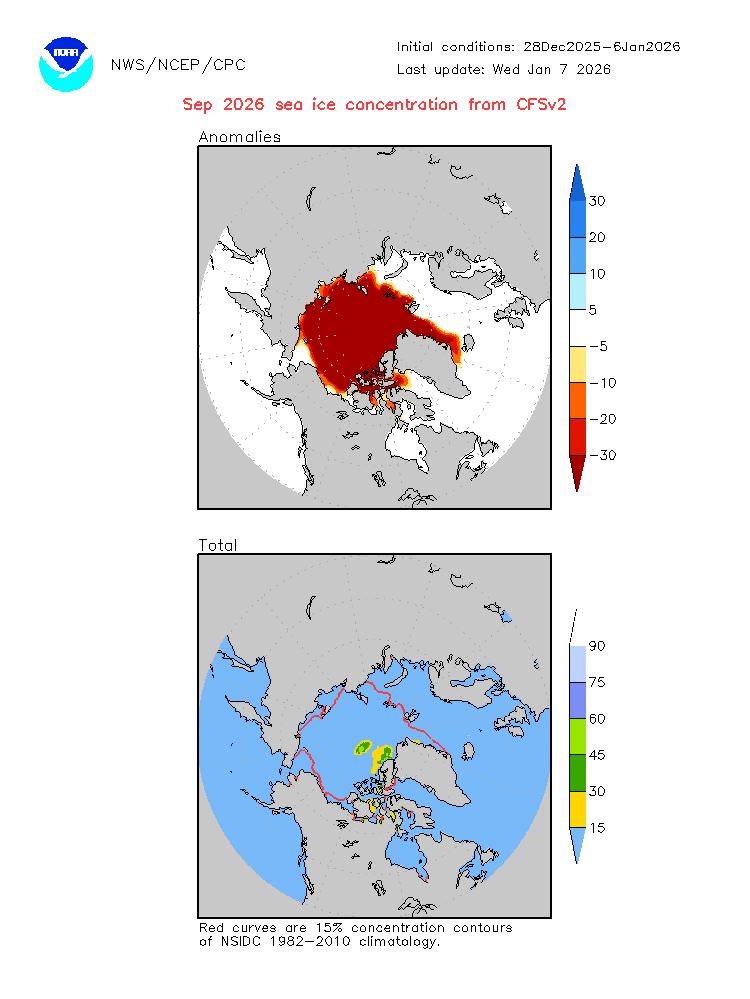
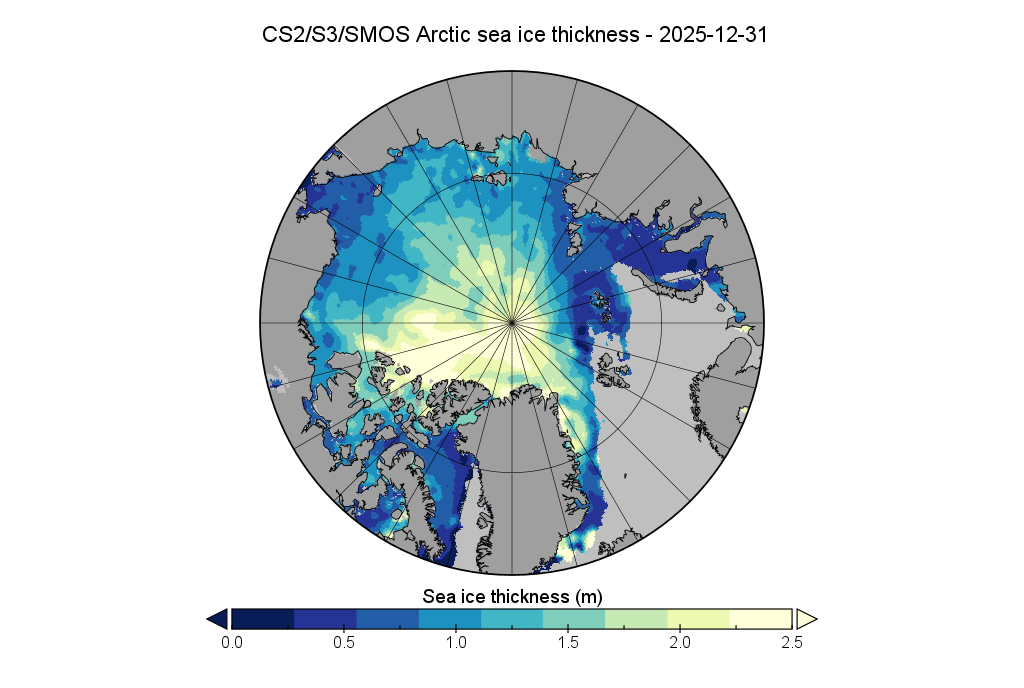
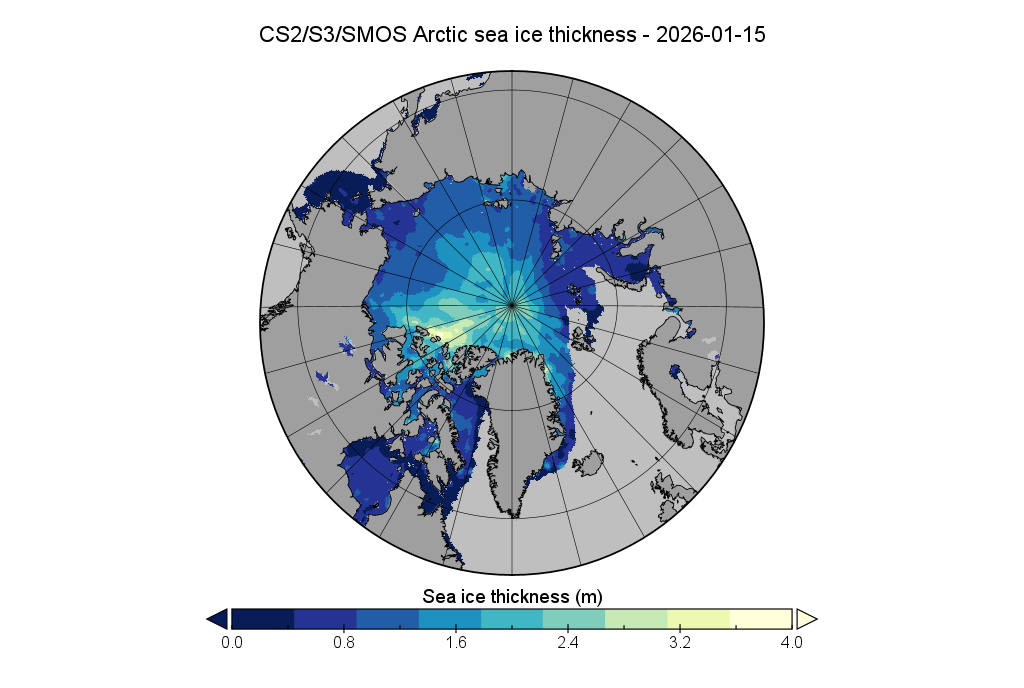
I’ll believe it when (if!) I see it. In slightly less shocking news, here is the Alfred Wegener Institute’s CryoSat-2/Sentinel 3/SMOS Arctic sea ice thickness map at the end of December 2025:
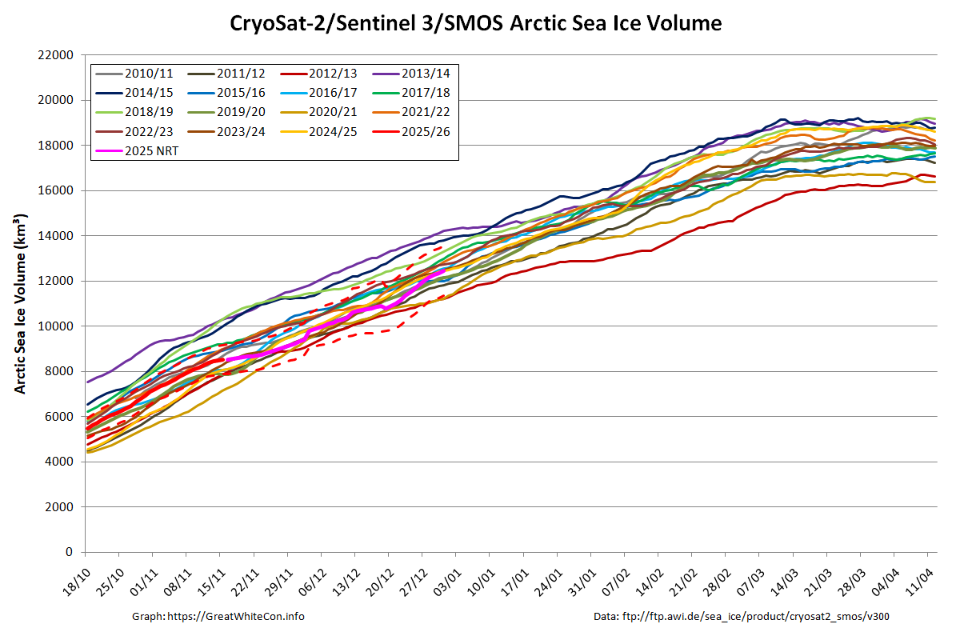
plus the associated volume graph:
The ERA5 data for December took longer than usual to make its way on to WRIT over the festive season. It’s there now, so here are the MSLP and 925 hPa air temperature anomaly maps for December 2025:
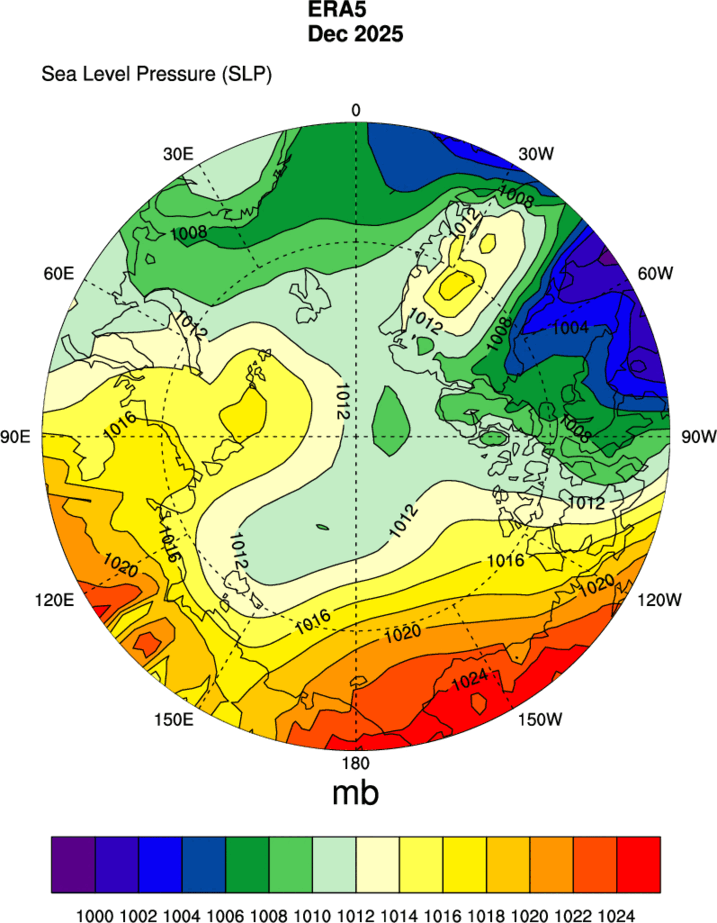
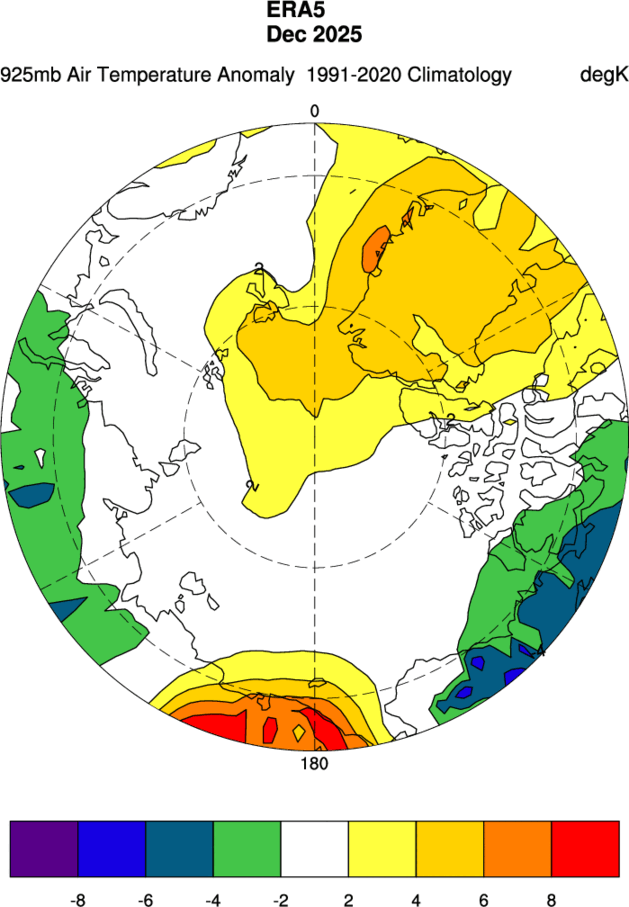
The isobars are much less tightly packed than in November!
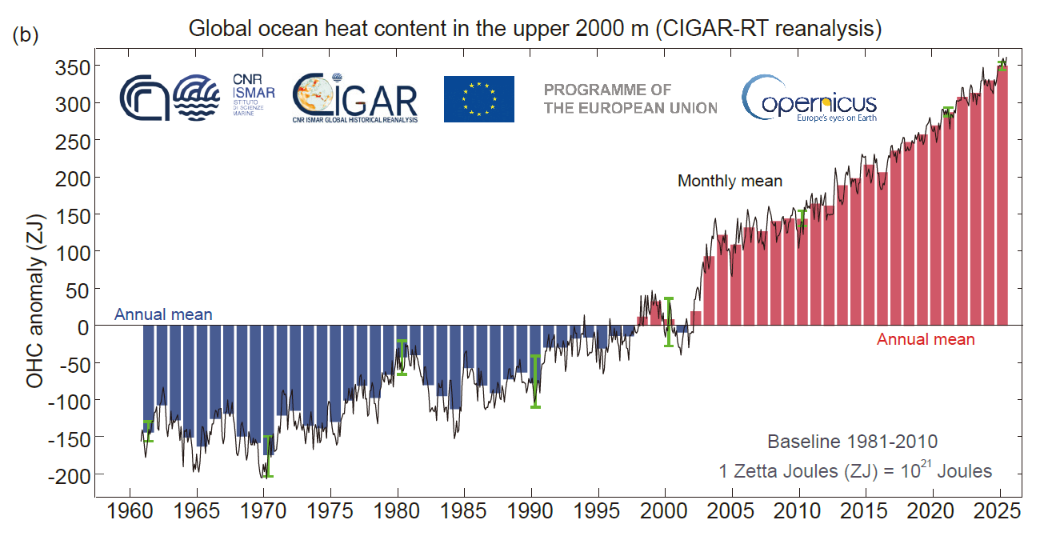
In other news, ocean heat content went up once again in 2025. According to an open access paper in Advances in Atmospheric Sciences:
Global ocean warming continued unabated in 2025 in response to increased greenhouse gas concentrations and recent reductions in sulfate aerosols, reflecting the long-term accumulation of heat within the climate system, with conditions evolving toward La Niña during the year. In 2025, global upper 2000 m ocean heat content (OHC) increased by ∼23 ± 8 ZJ relative to 2024 according to IAP/CAS estimates. CIGAR-RT, and Copernicus Marine data confirm the continued ocean heat gain.
You must have noticed that there has been lots of “geopolitical” news concerning Greenland over the last few days? You can read all about that over on the “US National Security Strategy 2025” thread, where amongst numerous other videos you will also find another copy of this excellent AI generated “recording” of the “Greenland Defense Front” in action:
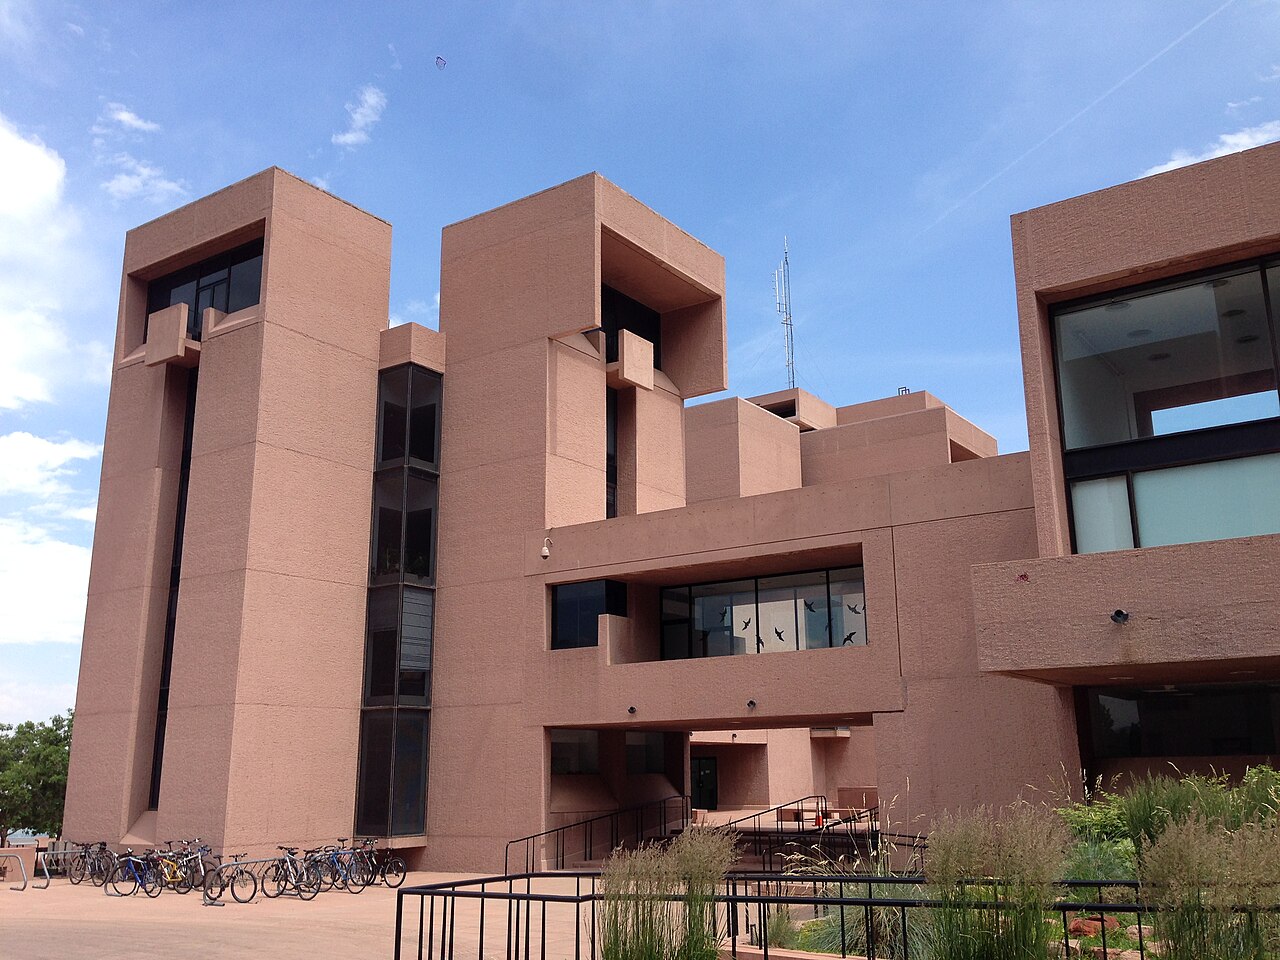
Whilst we’re on the topic of politics, see also the “The Sixth US National Climate Assessment” article on the Trump/Vance administration’s decimation of the US National Center for Atmospheric Research in Boulder, and some of the implications of that action:
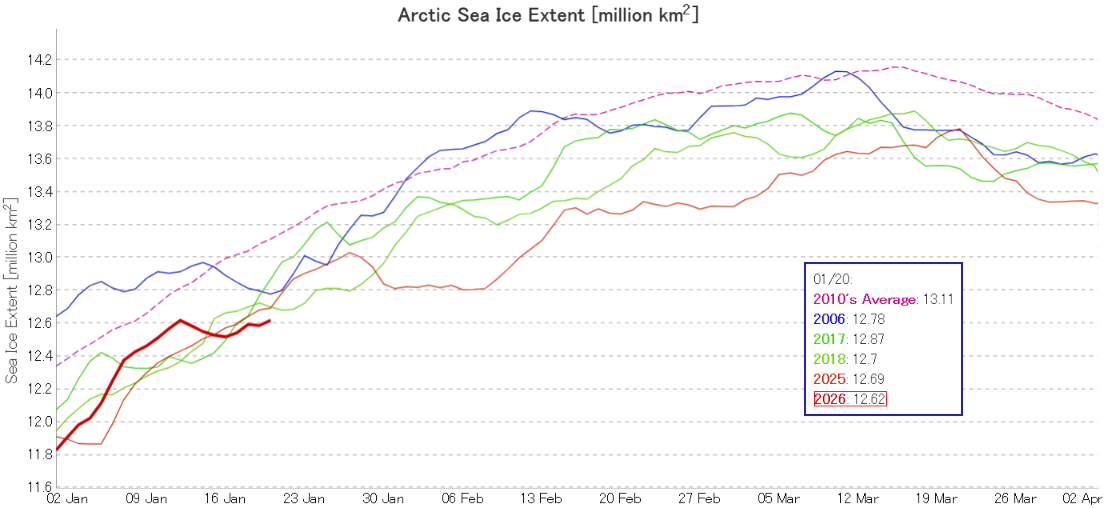
Getting back to the sea ice, the mid month JAXA extent graph reveals 2026 back in the “lowest for the date” position after a brief spurt earlier in January:
Looking at the third dimension, here is the AWI’s CryoSat-2/Sentinel 3/SMOS thickness map for January 15th. Note the change in scale and areal coverage compared to the Dec 31st map above:
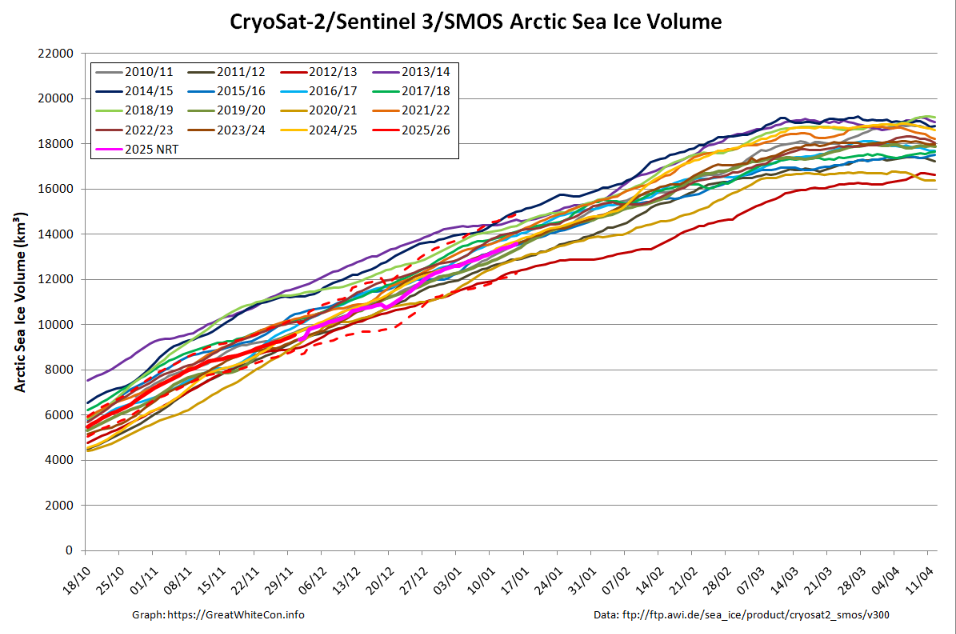
Here too is the associated volume graph:
The conversation continues over on the February open thread.
New Piomas figures at Polar Python, Jim
Of the top 10 lowest, note 8 fell in the preceding 10 years
I like this (general) comment from user ‘subgeometer’ today:
> Given the lags in the climate system I find it hard to imagine that the sea ice won’t melt out in the next few decades sometime. (EDIT: Atmospheric and SSTs will continue to warm under the extra insulation) The ice is more mobile now, and disperses in the melt season, so the minimum record hasn’t been broken since 2012. But any year the weather could first open large areas of water to warm in May, like the Beaufort does some years, and then the ice could go pouffe after sustained clear skies and high pressure, as well as being dispersed into already open areas with warmish SSTs. I wouldn’t read too much into the apparent lag in minimum extents since 2012, the blue water event could happen any year if the weather ducks line up. The increasing variability of minima I see as being like bifurcation in a chaotic system
Maybe it’s fair enough not to read to much into the apparent lag in minimum extents since 2012 – but the reasdings of the average so called hoi poloi are as still as valid as anyone.
Are we not?
Me, I have my nose accutely pointed to economic indicators.
In Perth, Western Australia, the bus fares came down a staggering amount from last year.. Now you can actually do something before forking out a small fortune to get home – (lol, what home??!!??)
I find this very, very interesting as to why that is .. and what exactly it is admitting.
Also – I might also add, “funnily enough” in the most non comedic sense of course – I was talking to a girl from Papua New Guinea at flight centre the other day. She was born in Goroka and my Dad trained up there so I lived there when I was very young, ..so we chatted.
She reckons climate change is on like Donkey Kong. Sorry, they were my Dads words from atleast ten years ago but she confirmed that it was indeed on and that my Dads sentiments had actually hit the mark.
She, of course, coming from the lay persons point of view.
I smell planet alcohol is about to be getting that wake up call very, very much sooner than later.
“So is the annual average for 2025:”
We did it, Jim!
Opening champagne stored from 2017 now
Global sea ice is also lowest volume on record.
Guy McPherson posted a vid a couple days ago admitting he was wrong so the Blue Ocean Event better not happen! What if it unleashes the “abrupt eruption” of the 50 gigatons of methane since the taliks have already melted? That was prove Guy McPherson correct and he would not be happy.
The so called ‘blue ocean event’ concerns extent.. the thickness is what tells the story but is oh so conveniently that oh so famous detail that nature doesn’t easily give up.
Such inconveniences force science, being method, to better itself.
I am keenly interested in watching the economic picture aswell to see what interesing little easter eggs that may produce for us all to gaze and ponder about most wonderously.
(Using CryoSat daily volume deltas to estimate current month Piomas)
Extent is lowest in satellite record, 48k below 2025 in #2 and 52k below 2017 in #3
(binntho/ASIF)
Yup. Waiting for the mid month CS2 data before my next update.
Sure. In addition to the real-deal volume, I do the extent record-position where I get, right now, for the year so far:
(Using CryoSat daily volume deltas to estimate current month Piomas)