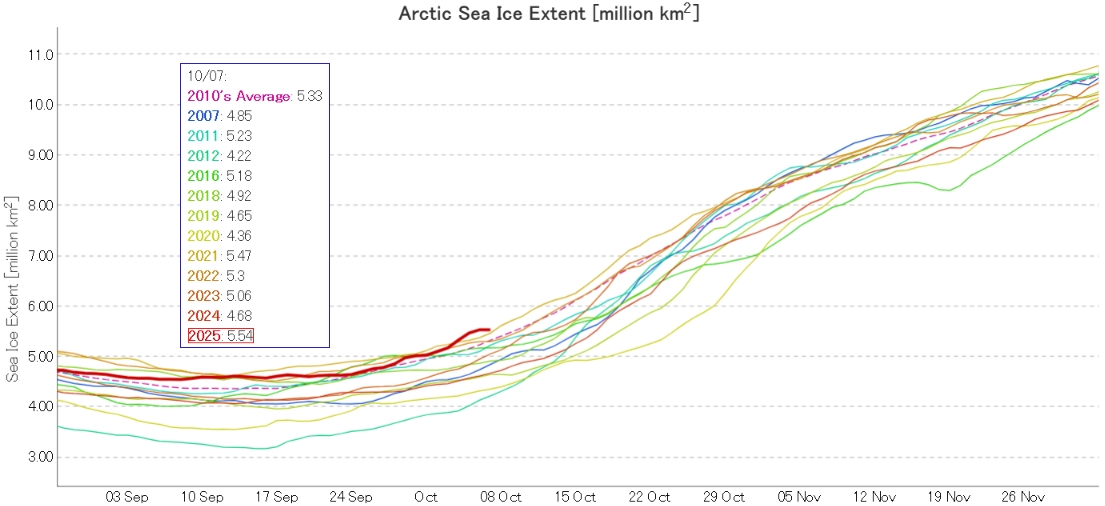
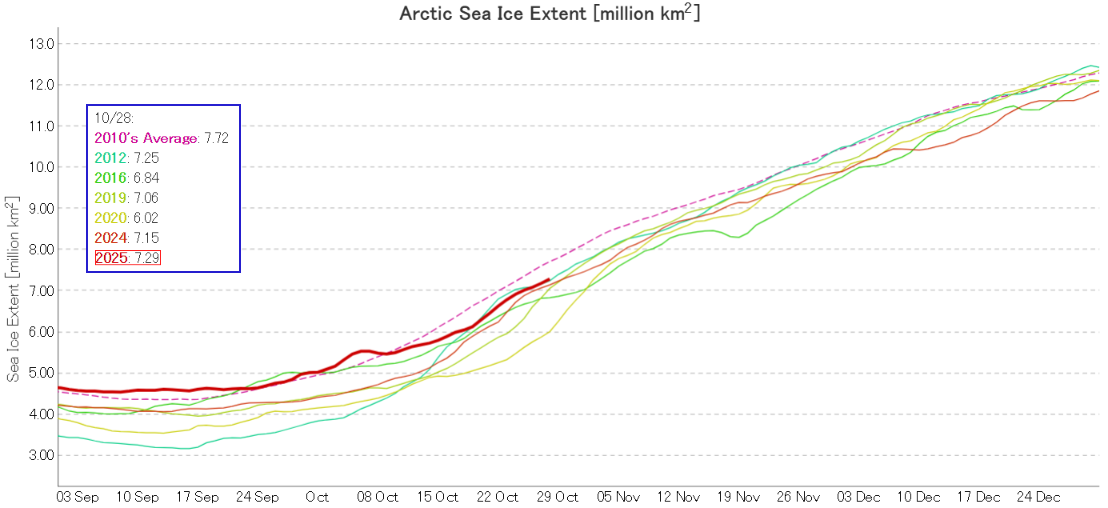
I was hoping that the September PIOMAS gridded thickness data would have been published by now, but no such luck. Reverting to JAXA/ViSHOP extent, after flatlining for most of September the refreeze has started in earnest over the last two weeks. Extent is currently 12th lowest in the satellite era:
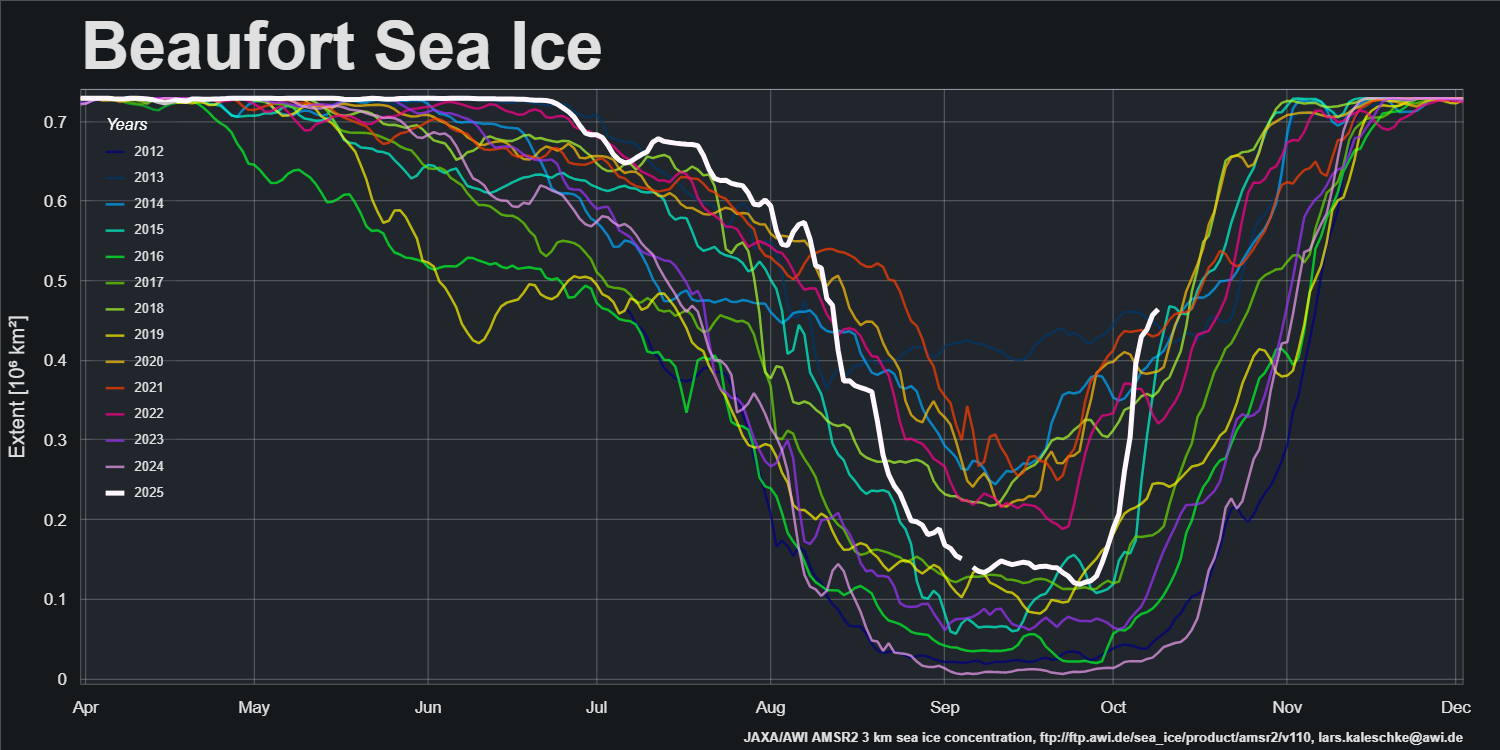
The latest sea ice concentration map from Lars Kaleschke of the Alfred Wegener Institute, based on AMSR2 data, reveals plenty of new ice in the Beaufort Sea, plus a bit more to the north of the Laptev Sea:
The latest sea ice “stage of development” charts from the Canadian Ice Service confirm that, and reveal more new ice that has yet to show up in the AMSR2 data:
In the continuing absence of PIOMAS gridded thickness data (see below), here’s the latest SMOS/SMAP “thin ice thickness” map:
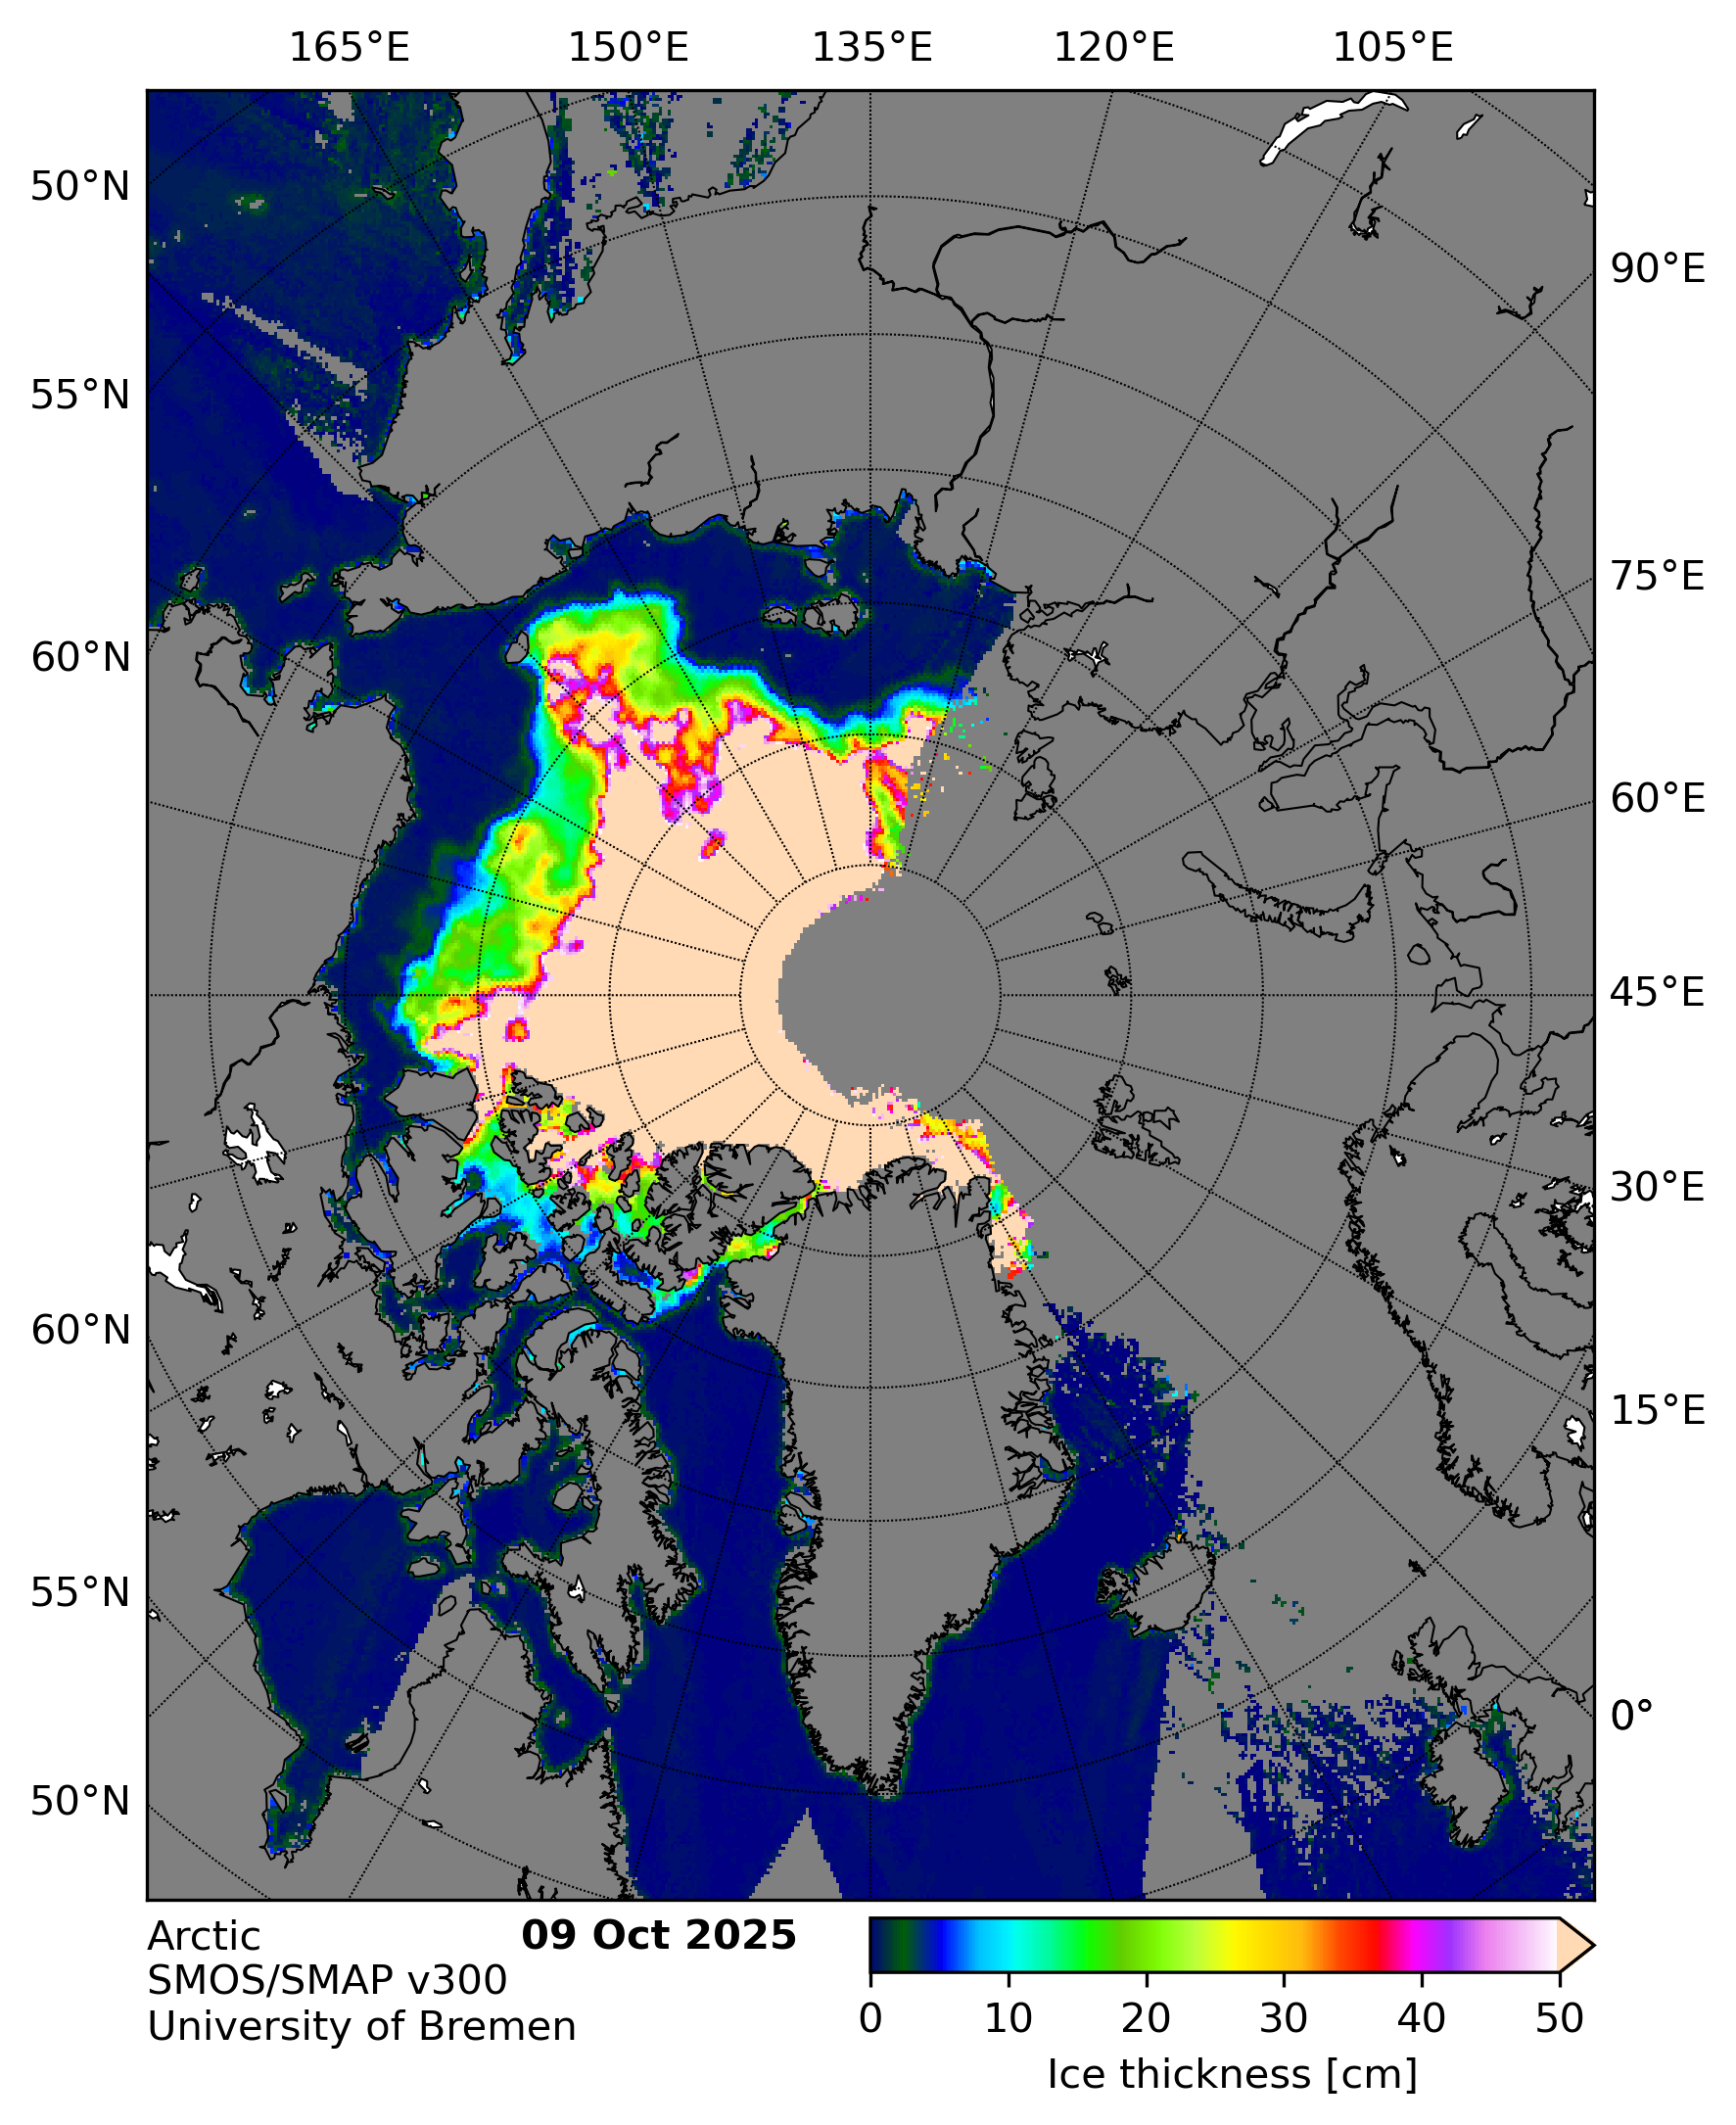
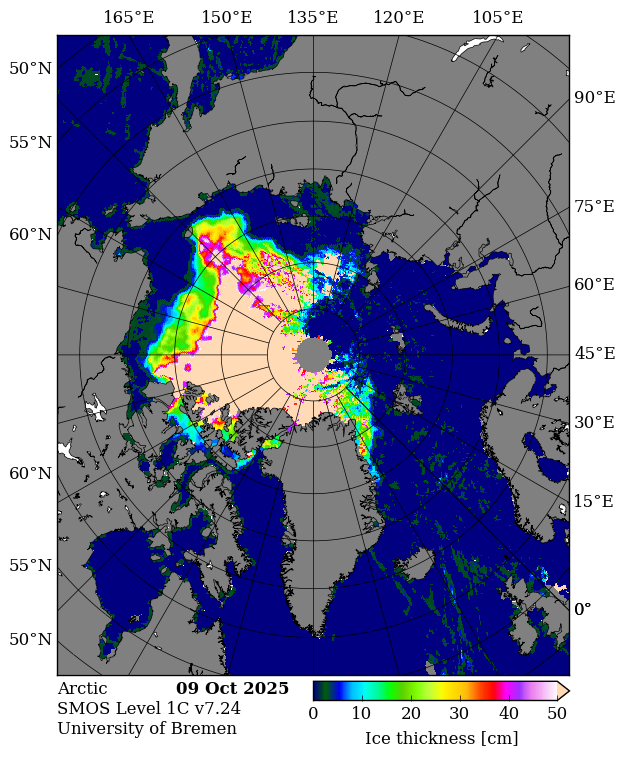
It appears to be badly affected by radio frequency interference on the Atlantic side of the Arctic. Here’s the raw SMOS map:
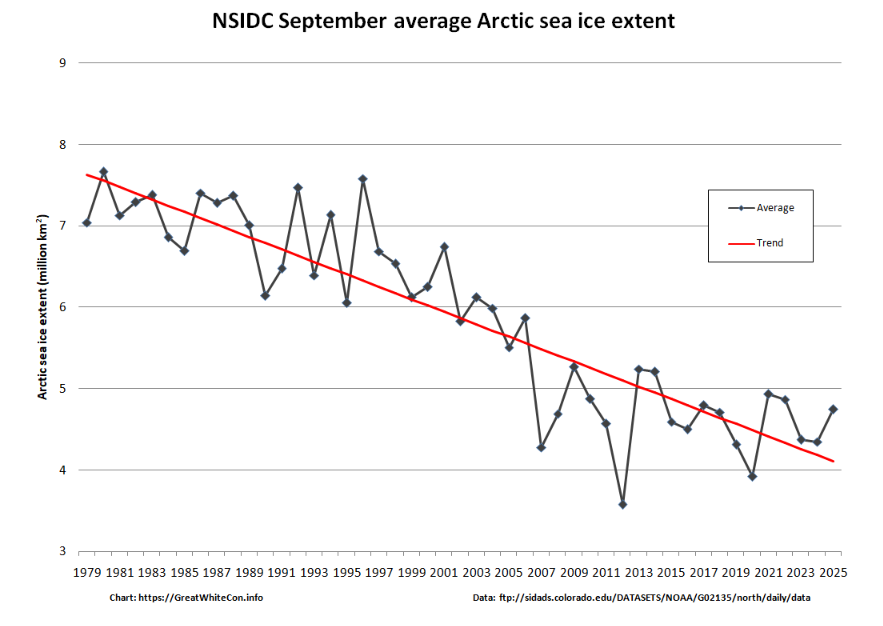
Further to a previous conversation on the subject, here’s the final NSIDC annual average extent graph for September:

As anticipated, 2025 annual average extent has proved to be the lowest in the satellite era.
[Update – October 16th]I was hoping that the September edition of the NSIDC’s “Sea Ice Today” analysis would have been published by now, but no such luck. Here’s the latest data announcement from the NSIDC:
Effective October 15, 2025, due to non-renewed funding, NSIDC has suspended or reduced several Sea Ice Today tools and services.
Discontinued:
- New monthly and mid-month analysis posts
- Sea ice analysis tool
- Sea Ice Volume
- Sea ice extent spatial comparison tool
Persisting:
- Daily Arctic and Antarctic sea ice images
- ChArctic Interactive Sea Ice Graph
- Links to Sea ice analysis data spreadsheets from the NOAA Sea Ice Index
- Reduced user support
- Sea ice annual maximum and minimum announcements (typically occurring in March and September)
Previously-published Sea Ice Today analysis posts will remain online. The discontinued Sea Ice Today products will no longer update or be maintained, and will be removed in the next several weeks.
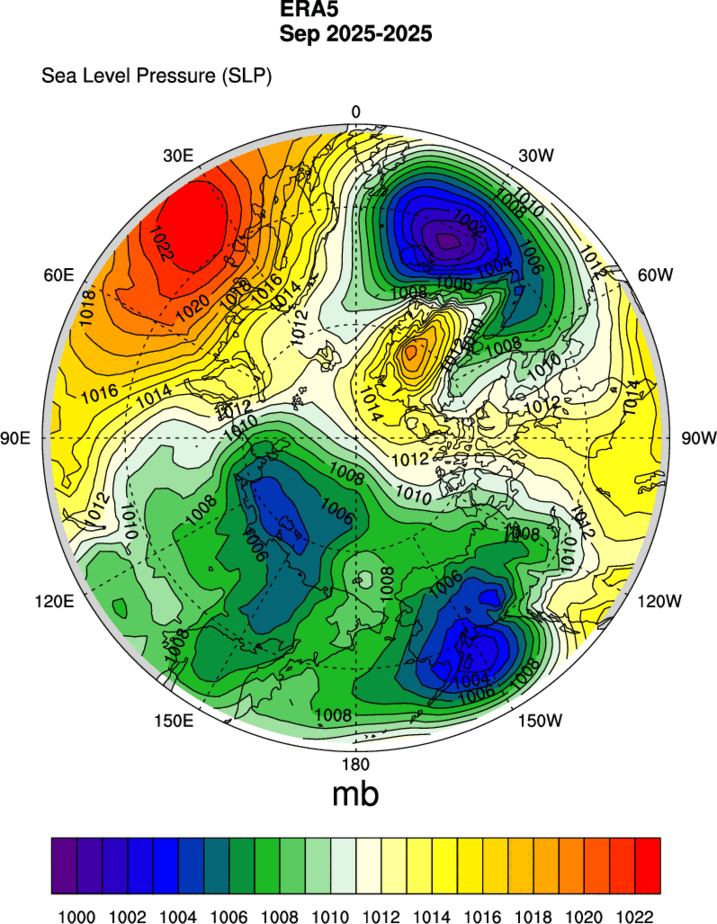
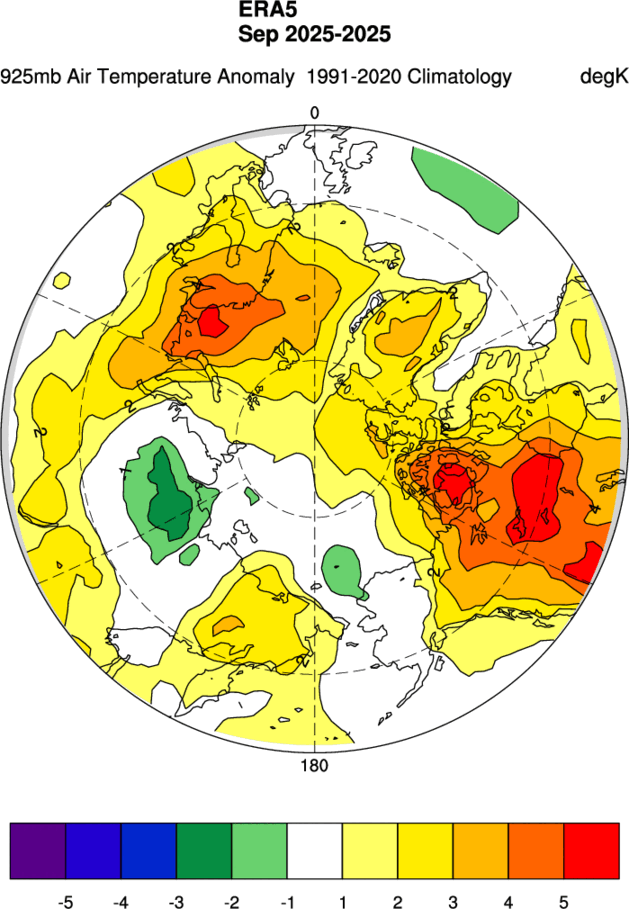
In Sea Ice Today’s absence, here’s the MSLP and 925 hPa temperature maps for September, usually contained in the monthly analysis articles:
Plus a hastily constructed graph of the monthly average extent for September:
The Alfred Wegener Institute has published the first CryoSat-2/Sentinel 3/SMOS merged Arctic sea ice thickness data of Autumn 2025:
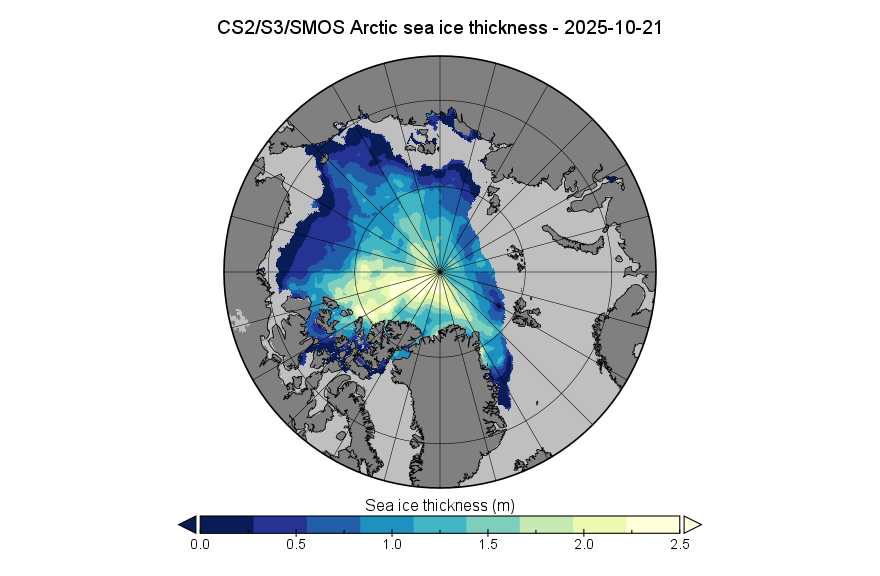
The Arctic sea ice volume derived therefrom is 5.43 thousand km³. The data is accompanied by the following “Product Degradation Warning”:
[Update – October 27th]SMOS input data continues to be affected by persistent and frequent radio-frequency interference (RFI) in the Barents, Kara, and Laptev Seas, resulting in missing thin ice thickness measurements. Consequently, sea ice thickness estimates for this region in the product will rely exclusively on radar altimeter data, which may lead to higher reported values than would have been obtained using SMOS.
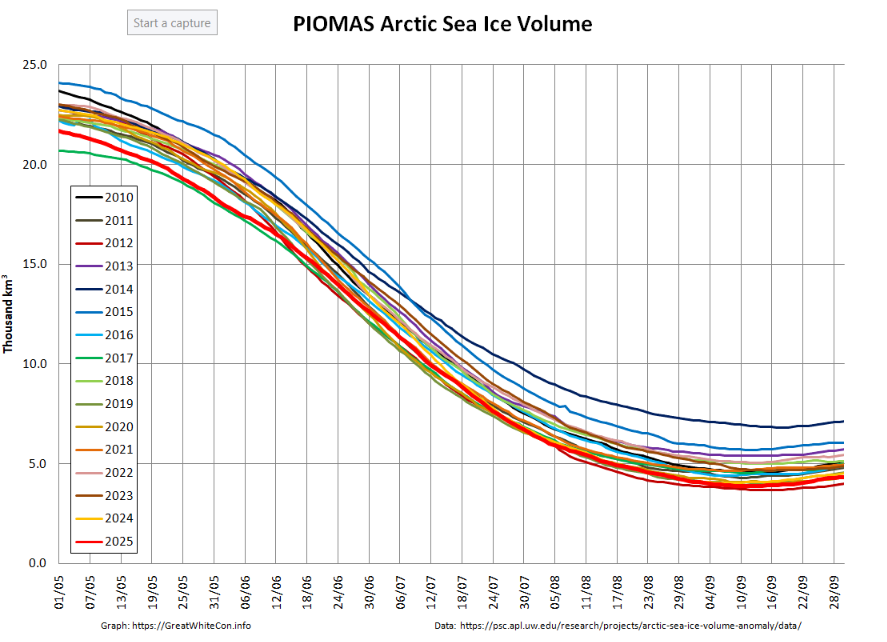
The PIOMAS gridded thickness data for September 2025 has been belatedly released:
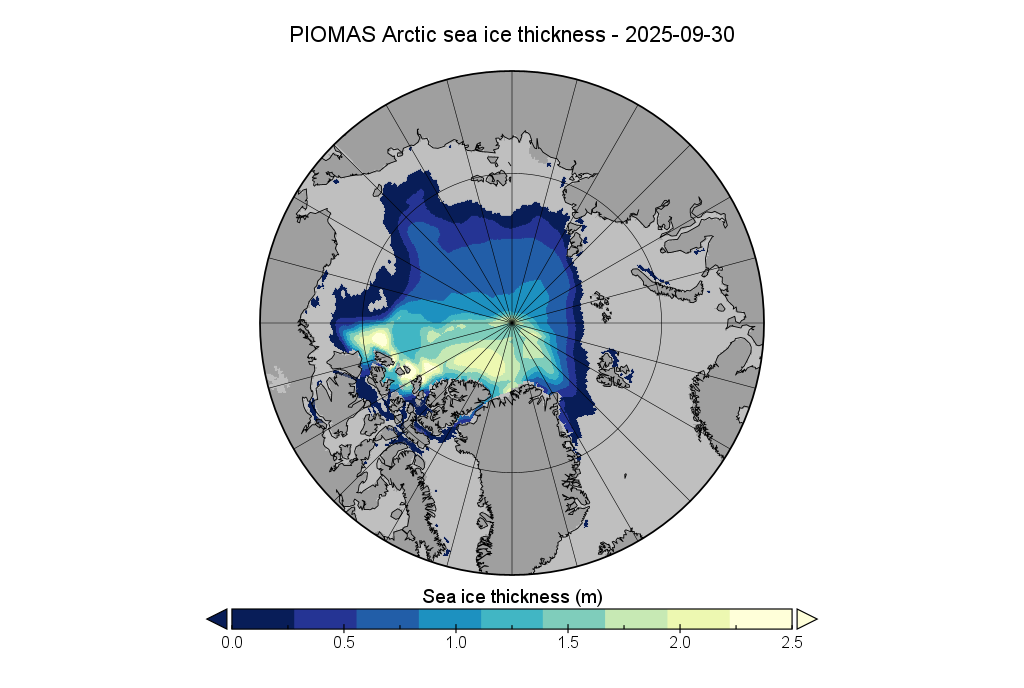
The associated volume graph reveals that the 2025 minimum modelled Arctic sea ice volume was 3.87 thousand km³ on September 12th, which is the 2nd lowest minimum in the PIOMAS record going back to 1979:
Whilst we’re on the topic of sea ice volume, here’s the latest “measured” volume graph:
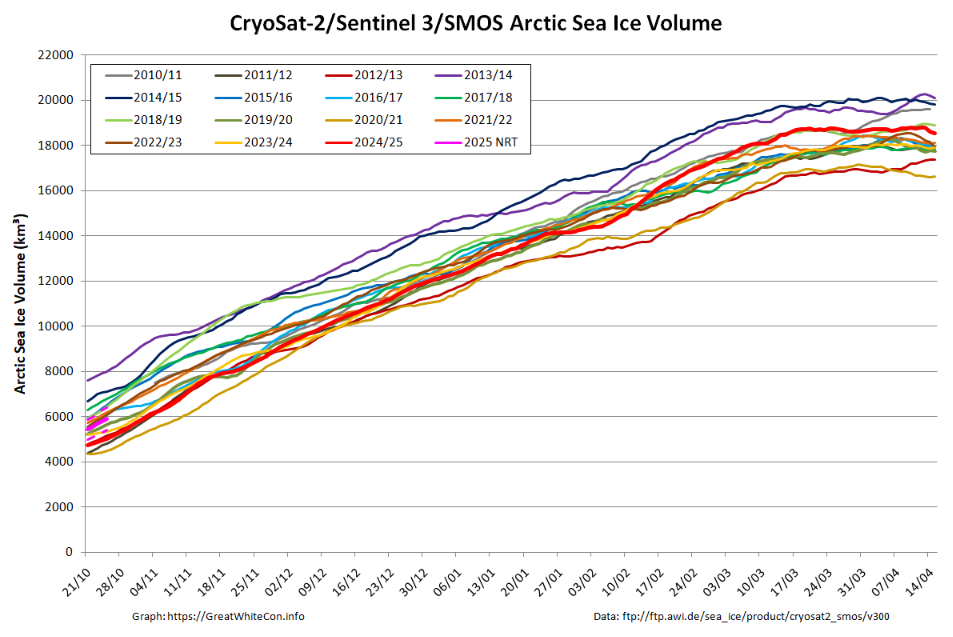
Note the proviso about recent SMOS data above, and also that the version 3.00 data from AWI is currently only available beginning in Autumn 2023. Prior years shown on the graph above are based on version 2.06 data, which amongst other things does not incorporate Sentinel 3 data.
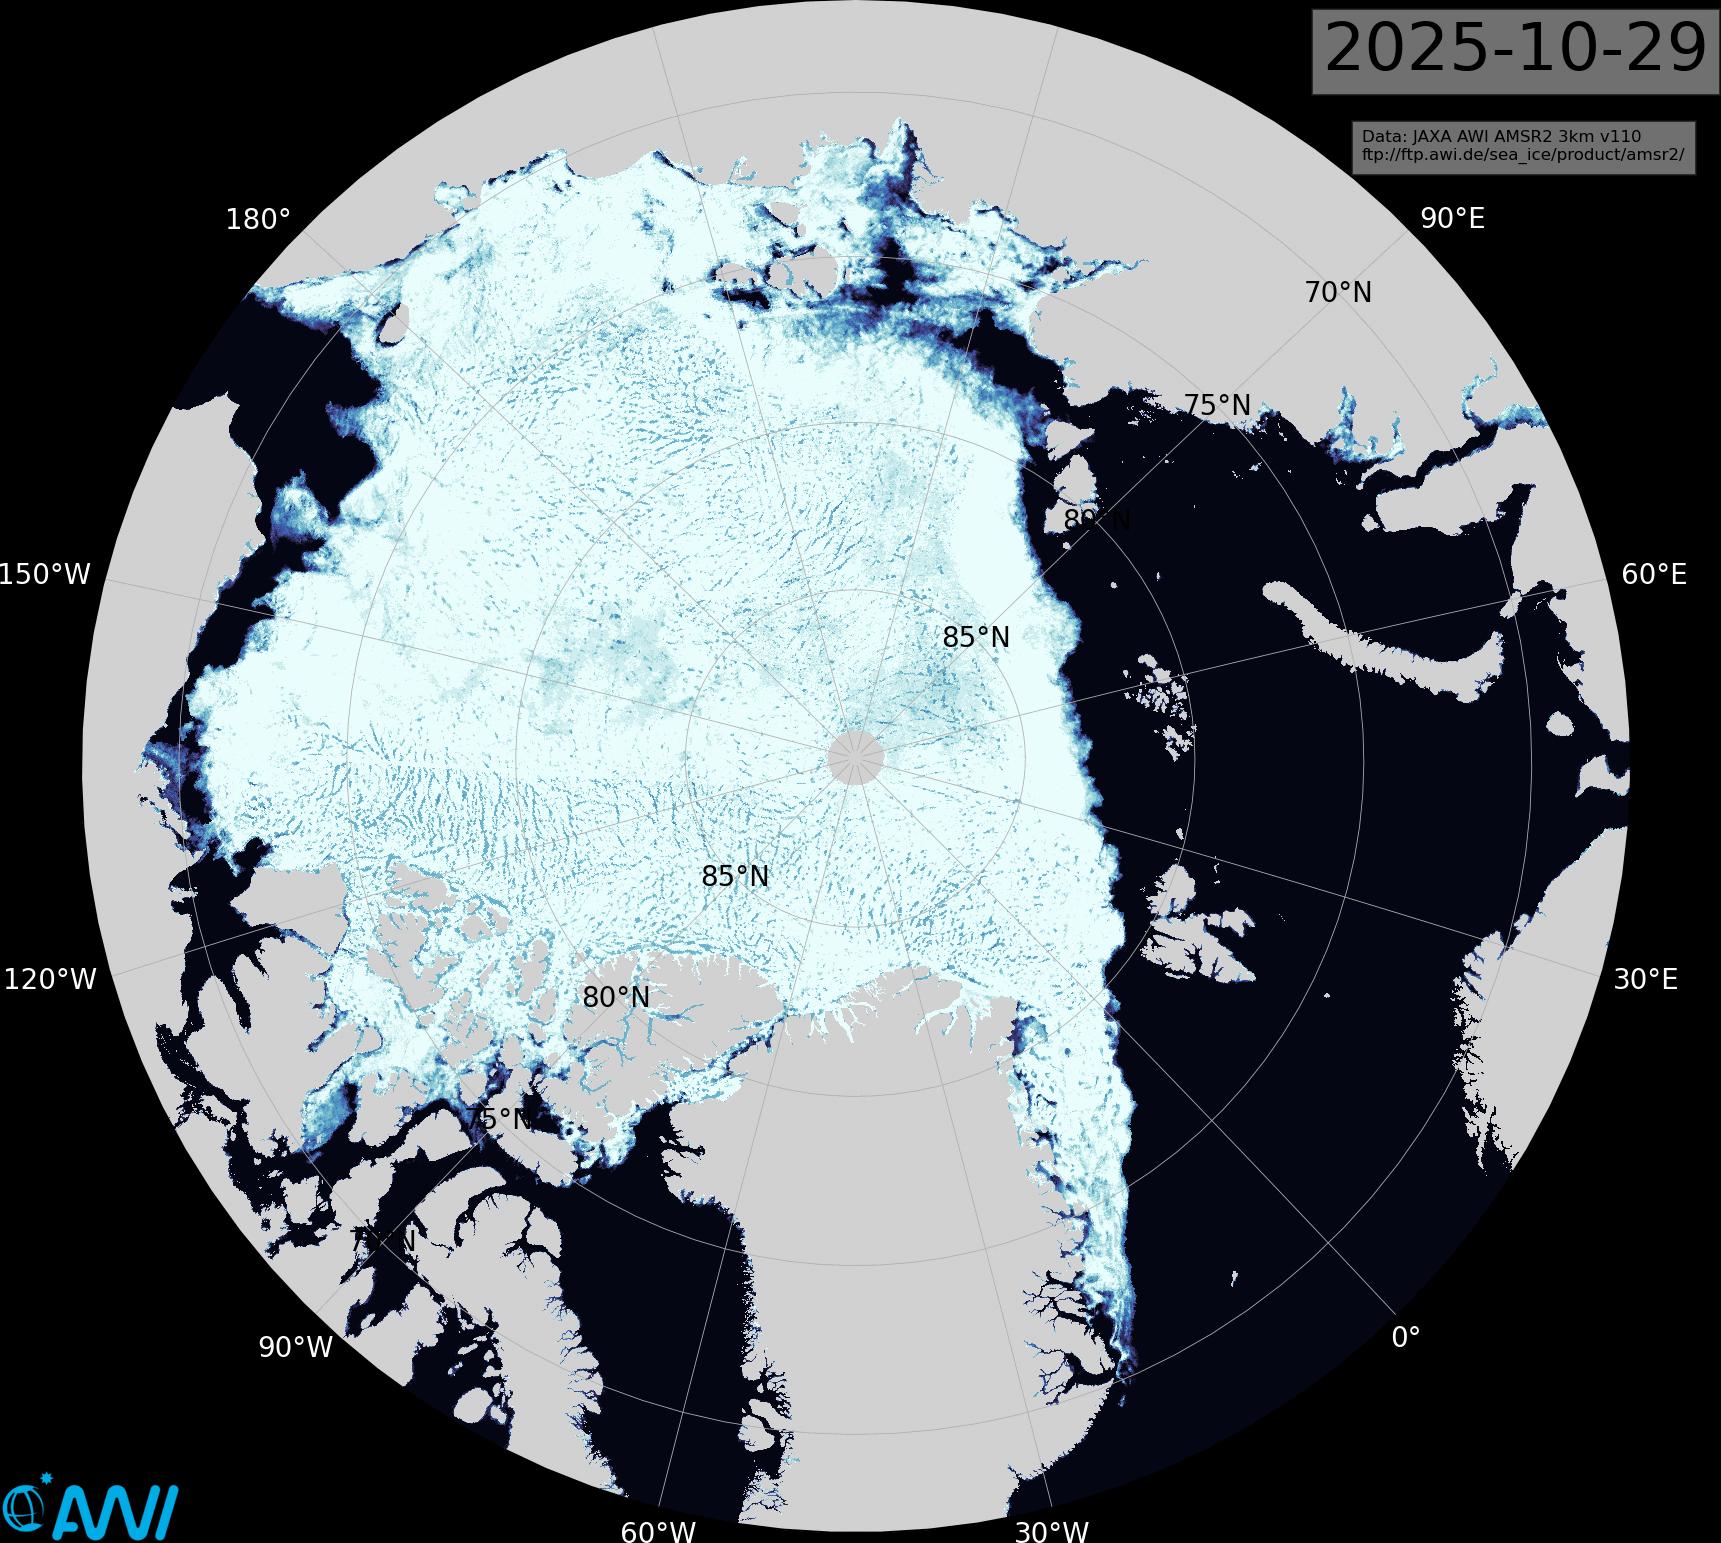
[Update – October 29th]Much of the Siberian side of the Arctic Ocean has now refrozen:
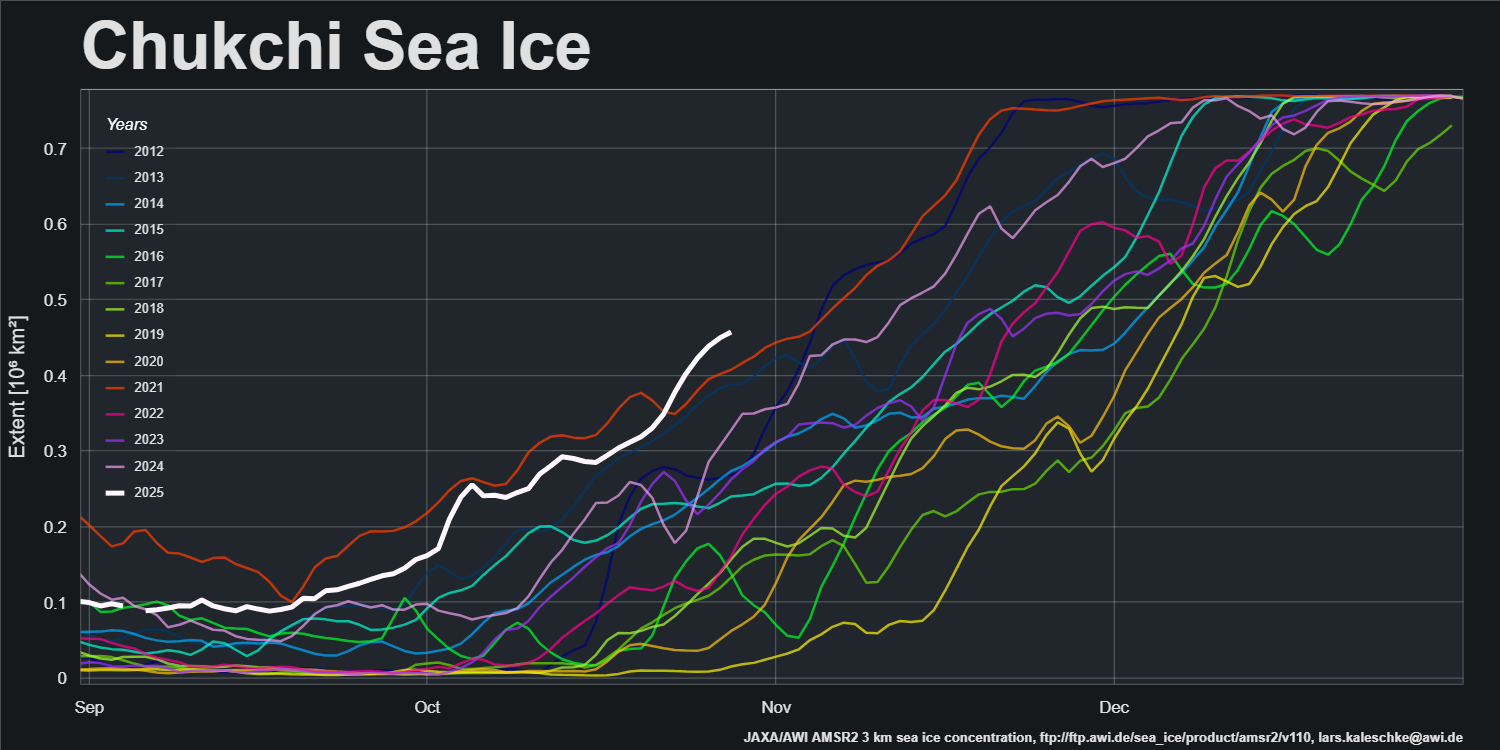
There is a significant difference between progress of the refreeze on the the Pacific and Atlantic sides of the Arctic. Extent in the Chukchi Sea is currently highest for the date in the AMSR2 record:
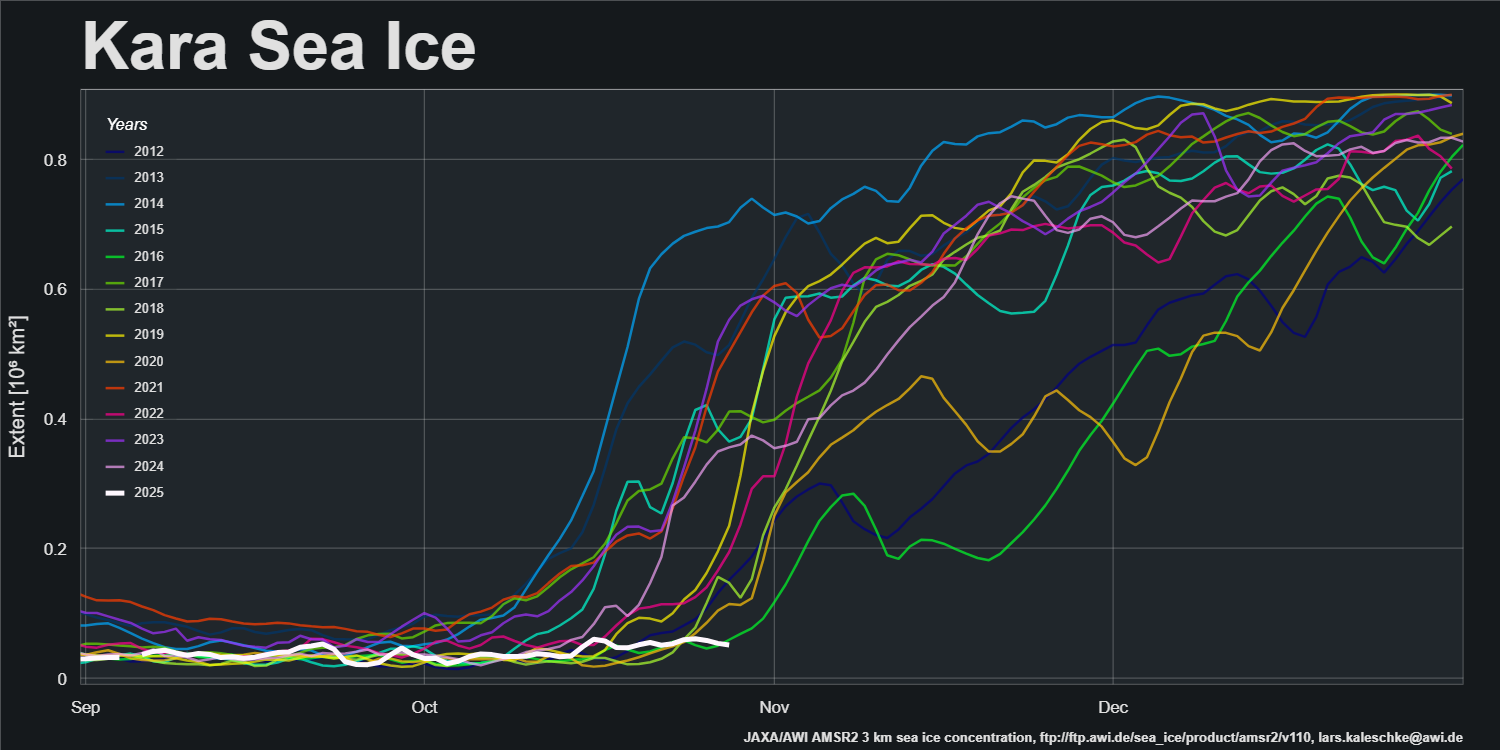
However, refreeze of the Kara Sea has yet to begin, and extent is currently lowest for the date in the AMSR2 record:
Pan Arctic JAXA/ViSHOP extent is now 6th lowest in the satellite era:
The conversation continues over on the November open thread.
Hi, Jim!
Do we know anything about sailing in ‘nilas’ or sea ice so thin it won’t show up on AMSR2? Asking because in the Nuuk Fjord we basically only have glacier ice chunks (in all shapes, sizes & colours).
According to the Canadian Ice Service “New ice and nilas are not a hazard to shipping.”.
However at this time of year thin ice gets thicker quickly, so I would recommend heading for clear water as swiftly as possible!
N.B. Image of nilas successfully embedded from CIS web site.
“N.B. Image of nilas successfully embedded from CIS web site.”
Congrats! PS: Do you think you could make yourself a test account (with normal privileges) and experiment a bit with image embedding for us normal folks? Seems to me your admin account is allowed things we cannot.
“I was hoping that the September PIOMAS gridded thickness data would have been published by now”
Don’t get me started on UW, lol. No half-month update, no end of month update, no nothing. But maybe they’re just secretly waiting for ESA to publish their satellite measurements first? I think that’s around October 15th.
Oh, they added a reference to them being late:
“**August 2025 Monthly Update [ September update delayed due to US Govn’t shutdown resulting in unavailable data]**”
How to interpret? The wording seems to indicate it’s no longer them just being lazy and using 200+ days to rewrite some code so they can use AMSR2 data instead of the low-res US data. They’re now actually preparing to wait all winter – with the routine US shutdown – before they’ll tell us what the Summer melt did to the ice.
I think I’ll better keep my quiet until they put the numbers out there.
Hopefully CryoSat-2 data will be flowing again in a couple of weeks, following its summer shutdown.
“As anticipated, 2025 annual average extent has proved to be the lowest in the satellite era.”
Good going, Jim!
However, for volume (piomas), my graph gallery tells me 2017 is still the lowest (Sep data pending, of course).
⚠️ 16% loss/decade, or 3100 km³ from the COP20 (Lima) base of 19,500 km³ reading from the 30-yr avg graph …
Arctic sea ice this week at 5.3 k km³. This week saw daily sea ice volume at 5.3 & its 30-year average at 16.3. This was also an All-Time Low for the latter. The annual average is approaching 12,900 km³. Odds are, COP 30 in the Amazon this November will change absolutely nothing.
Where did you find the PIOMAS data for September/October 2025?
Those are nowhere to be found, and yet the ice collapse goes on. If I had my way, they’d be published daily, but alas, I don’t have complete control of this world, much less Washington DC.
So estimated based on closest similar trajectory graph, 2019 for the time being. I think you’ll find they’ll be fairly accurate to the +/- 0.1 k level.
Newsflash: PIOMAS has updated (or to be more precise, certain non-PIOMAS people have updated their CSV files, or rather, will do so very soon).
Yup. Although to be even more precise the PSC’s Dr. Zhang has updated his PIOMAS gridded thickness data.
See above.
**I Caught Schellenberger Lying on Arctic Ice**
Shillenberger said ‘No Decline 2000–2024’ but the Loss was Record High!
Jim, this comment is maybe more reminiscent of your initial blog concept & website name? I call out corporate bigshot & nuclear power shill Michael Schellenberger for lying – ‘Arctic Ice did not decline from 2000 to 2024’ – proving that yes, as a matter of fact, we lost over 35% of that Sweet Millennial ice.
And that rather than ‘not declining’, the short AND long term declines are coming harder and increasingly so!
Debunked & Dethroned
Thanks for the heads up GS.
I had a lengthy “discussion” about the pros and cons of fossil fuels with Michael Shellenberger on Twitter many moons ago. Then he deleted his account.
One can but hope that history repeats itself?
“The associated volume graph reveals that the 2025 minimum modelled Arctic sea ice volume was 3.87 thousand km³ on September 12th, which is the 2nd lowest minimum in the PIOMAS record going back to 1979”
Grok AI chiming in on this year’s #2 minimum and perhaps All-Time Low annual mean volume, come mid-January.
[Amended auto-embed link – Mod]
Since you and Grok mention the annual mean, here’s the “offset” graph:
When you put it like that… or in that graph, it’s pretty hard to make out where Shellenberger wants there to be “no decline” going forward. It is of course the year 2000, but believing your own eyes, 2000-2025 is just more climate-driven ice loss business as usual.
Jim, thank you for amending the embed URL.
As I understand it, copy-pasting the URL for the individual tweet works fine, but I have to replace ‘x’ by ‘twitter’ upon posting here, at least until WordPress updates its auto-embed features.
thanks for the update on arctic ice volume loss…
I asked Grok again. As you do, lol
Does Grok possess an artificial arse out of which to talk nonsense?
A Tale of Two Groks.
Grok #1 or #2?
See also:
https://GreatWhiteCon.info/2025/11/grok-confirms-michael-shellenberger-talks-abject-nonsense/#Schizo
Grok is evidently mightily confused by its multiple personalities:
Today’s sea ice situation – while not record low – is 2nd lowest globally (by the Jaxa extent metric), and 3rd lowest Arctic + Antarctic*
This is the most severe setup in about 120 days, or 4 months, so since right after the Summer Solstice in the North. It’s presumably the lingering warm water in the Arctic Ocean that has brought us back into the Top 3 lowest for the date, over the past few days.
*) If I’ve done my math right. I’ve been removing one ‘Arctic bug’ lately, and there may of course be more ‘ice bugs’ further south.
Yup – The November open thread will be published shortly, once ECMWF have published the ERA5 reanalysis for October.
In the meantime:
Jim, Steven (of Polar Python fame) reports that Oct 31 was indeed lowest on record for the date, weighing in at a mere 5.914 k
However, bad things happened to the model run, either at UW or in Steven’s scripted processing of UW’s shape files.
Something went wrong at the PSC/UoW end from October 4th:
It seems unlikely that everything was back in sync by October 31st.
Jinlun Zhang confirms the problem, and informs me that it’s likely to be caused by the newly introduced assimilation of AMSR2 data into the PIOMAS model.
Right. The code rewrite that they ‘only’ had about 200 days to develop and stress test, using for instance last year’s data, to get right.