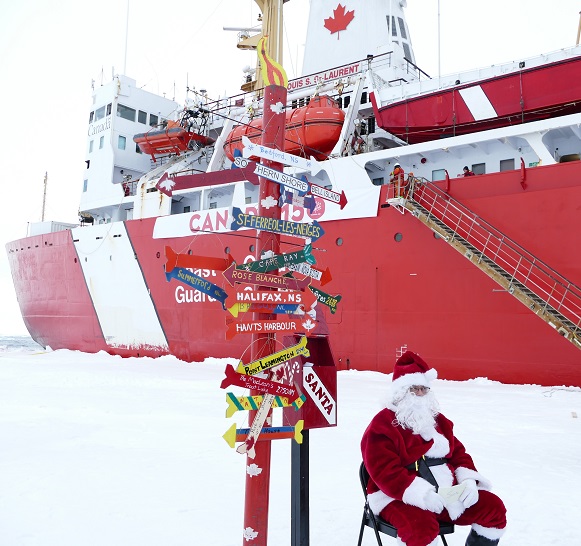
Christmas is coming, and even as we speak Snow White is heading for the geographical North Pole to assist Santa’s little helpers in their annual gift delivery mission:
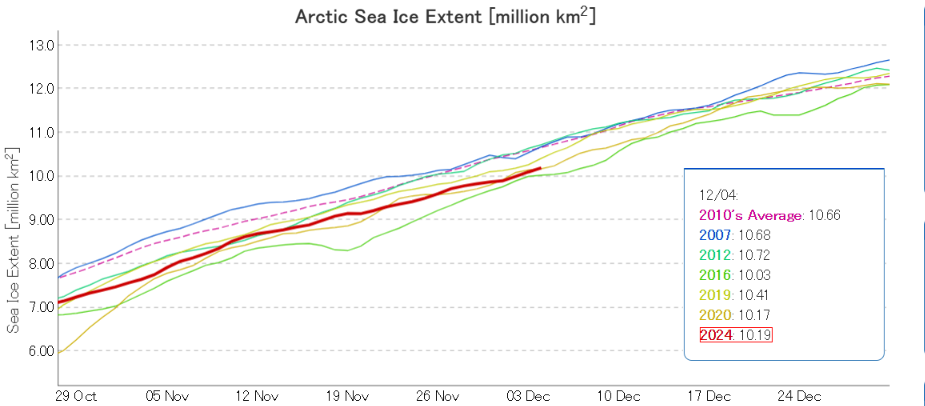
We’ll start the festive season with a graph of JAXA/ViSHOP extent, which is in a “statistical tie” with 2020 for 2nd lowest for the date in the satellite era:
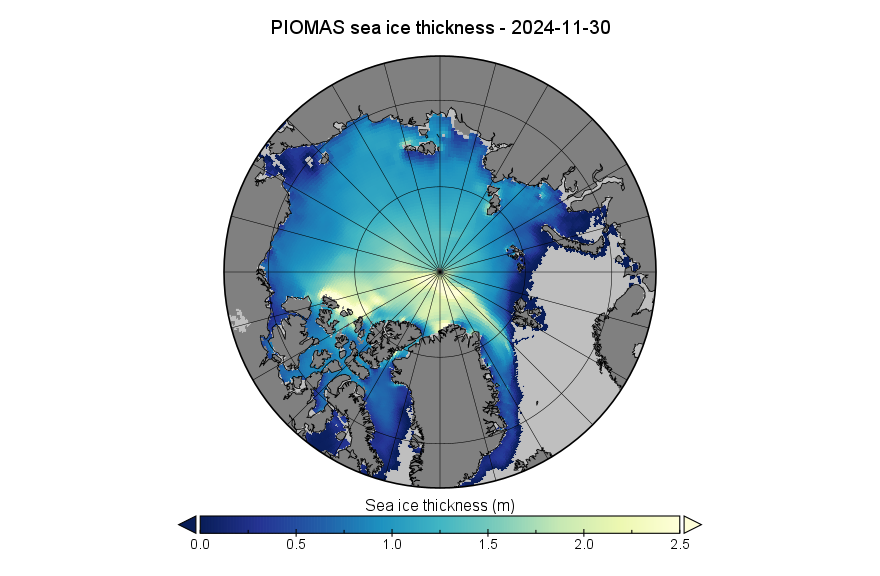
Here’s the PIOMAS gridded thickness data for the end of November 2024:
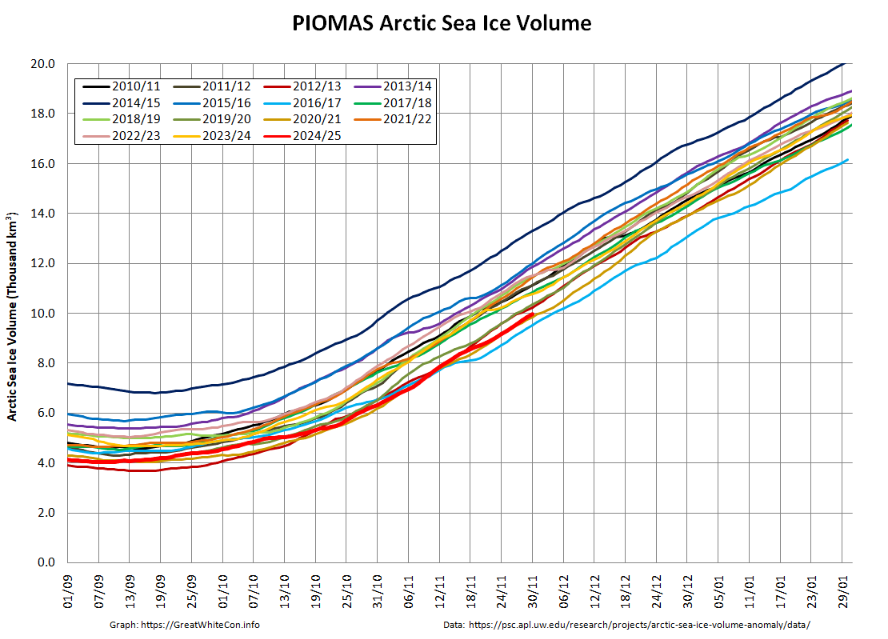
On November 30th Arctic sea ice volume had increased to 9.99 thousand km³, 3rd lowest for the date in the PIOMAS record:
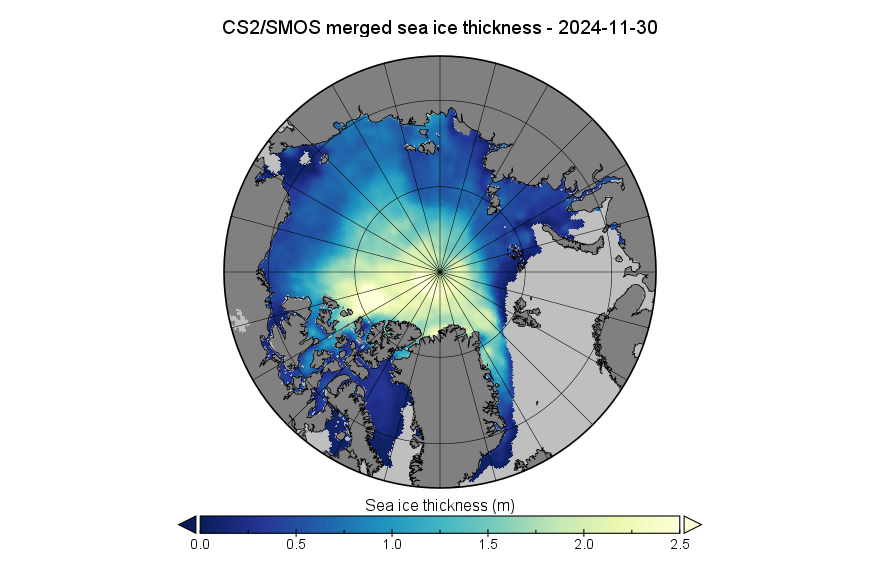
For comparison purposes, here is the “near real time” CryoSat-2/SMOS merged thickness data from the Alfred Wegener Institute:
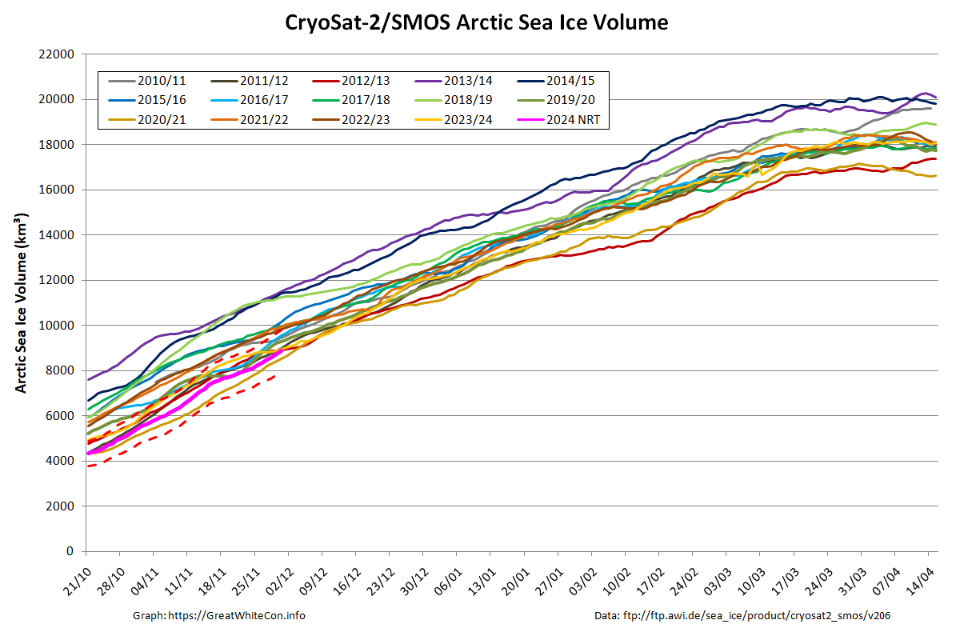
Together with the associated volume graph:
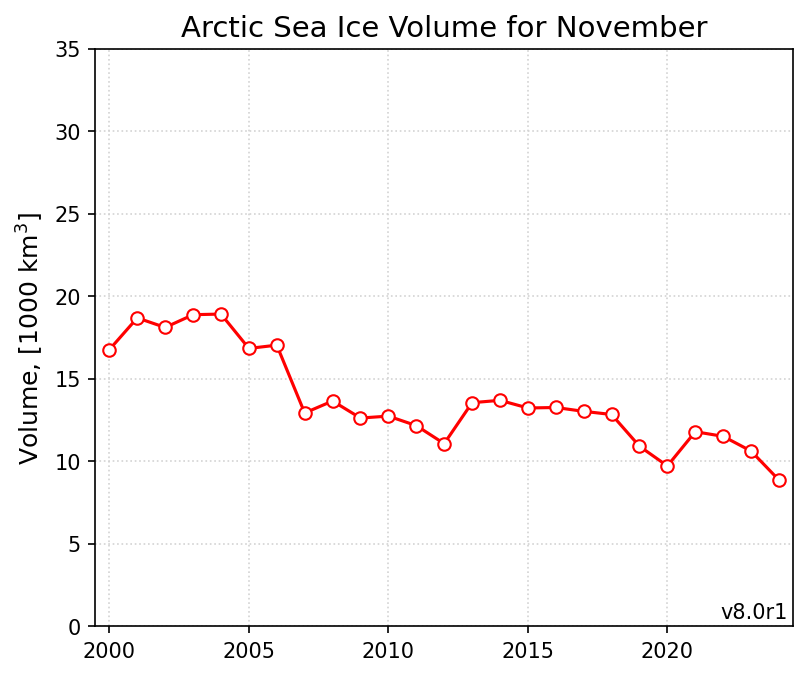
Finally, for the moment at least, here is the DMI modelled Arctic sea ice volume November monthly graph, updated to include 2024:
The 2024 edition of the Arctic Report Card has been published by NOAA. A brief overview is available in this video:
The Arctic continues to warm at a faster rate than the global average. The 2024 Arctic Report Card highlights record-breaking and near-record-breaking observations that demonstrate dramatic change, including Arctic tundra transformation from carbon sink to carbon source, declines of previously large inland caribou herds, and increasing winter precipitation. Observations also reveal regional differences that make local and regional experiences of environmental change highly variable for people, plants and animals. Adaptation is increasingly necessary and Indigenous Knowledge and community-led research programs are essential to understand and respond to rapid Arctic changes.
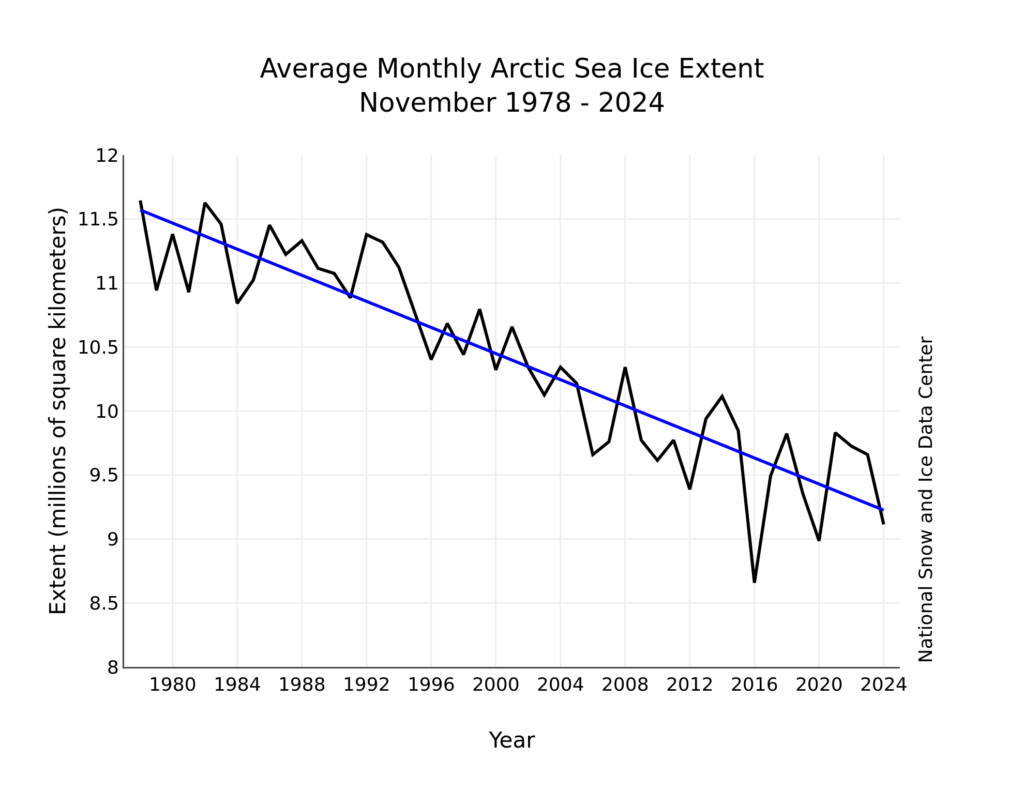
According to the November edition of the National Snow and Ice Data Center’s “Sea Ice Today” analysis:
Arctic sea ice extent for November averaged 9.11 million square kilometers (3.52 million square miles), and was the third lowest in the 46-year-satellite record. The November extent was 450,000 square kilometers higher than the record low for the month set in 2016, but was 1.59 million square kilometers below the 1981 to 2010 average. Since 2012, the two largest departures from average extent in any month have occurred in autumn—November 2016 and October 2020—and November 2024 is similarly extreme:
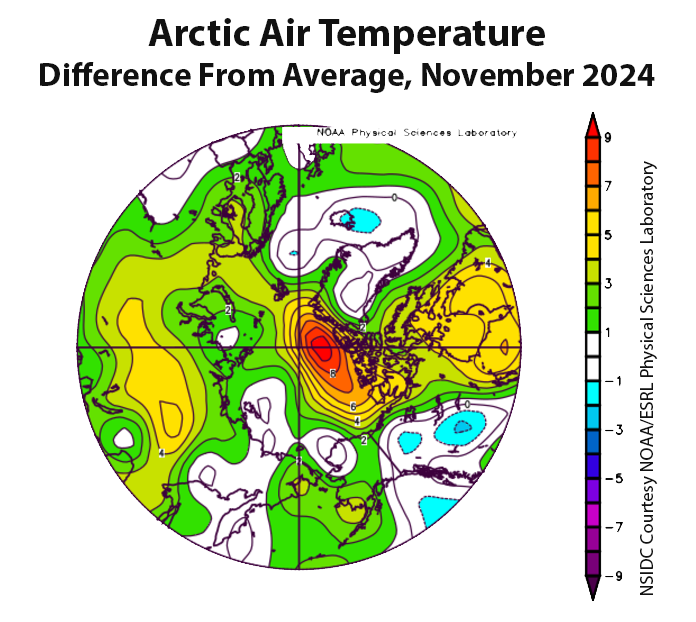
Air temperatures over the Arctic Ocean in November were mixed. At the 925 millibar level (approximately 2,500 feet above the surface), temperatures were up to 10 degrees Celsius above the 1991 to 2020 average north of Greenland, while areas from coastal Canada to northern Scandinavia experienced temperatures 3 to 6 degrees Celsius above average. In contrast, the Beaufort, Bering, and Laptev Seas experienced relatively cool conditions, 1 to 3 degrees Celsius below average. Over Hudson Bay, where the winter ice has yet to form, air temperatures were 1 to 5 degrees Celsius above average .
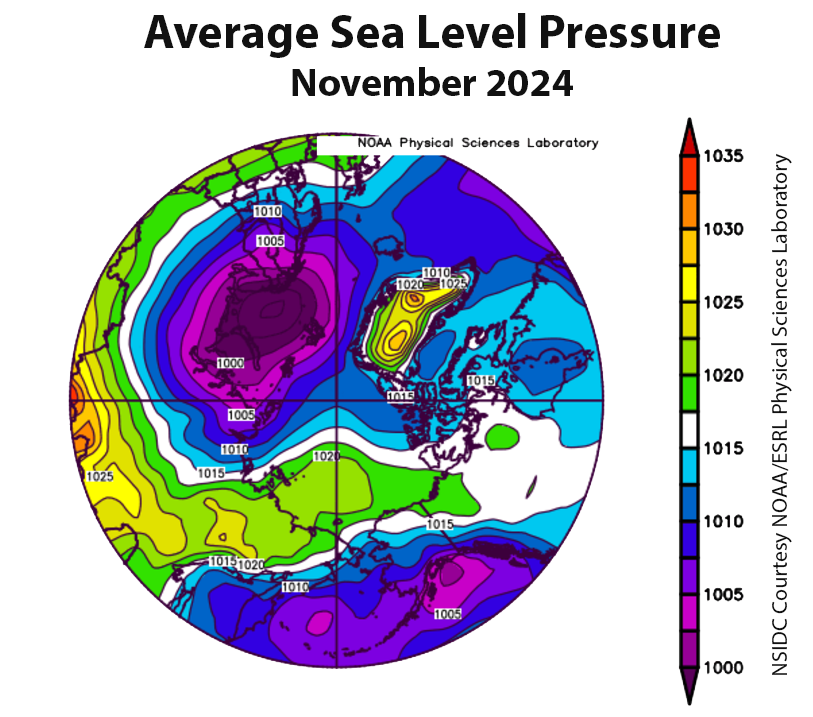
[Update – December 12th]The generally warm conditions reflect unusually high sea level pressure over the central Arctic Ocean coupled with below average sea level pressure over Eurasia and North America. While a prominent feature of the general atmospheric circulation pattern is an anticyclone (high pressure cell) in the Beaufort Sea, this pressure cell has shifted somewhat towards the pole. The strong pressure gradient between the high pressure and the low pressure over Eurasia funneled warmer continental air from Siberia towards the Kara and Barents Seas, where it has then circulated clockwise north of Greenland:
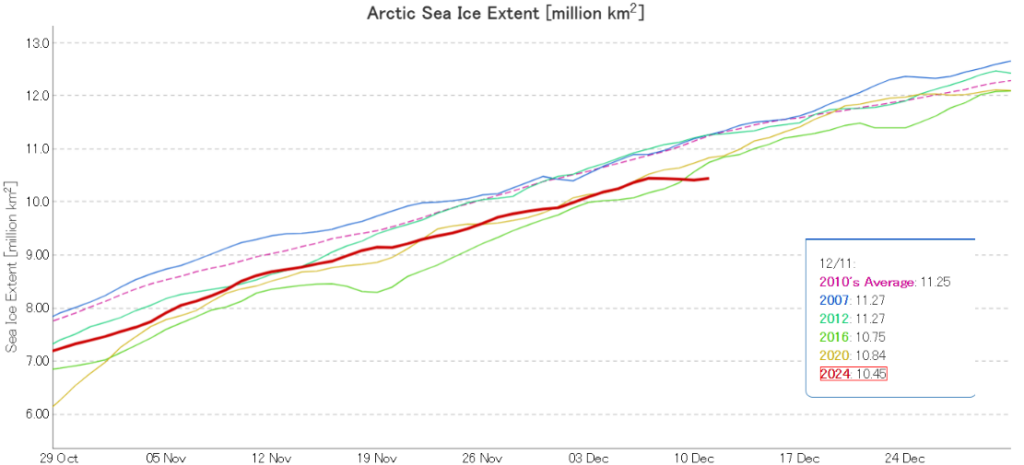
All of a sudden Arctic sea ice extent is lowest for the date in the JAXA/ViSHOP 46 year record:
[Update – December 21st]The mid month PIOMAS gridded thickness data has still not been release, so here is the currently rather lonely CryoSat-2/SMOS merged thickness map for December 15th:
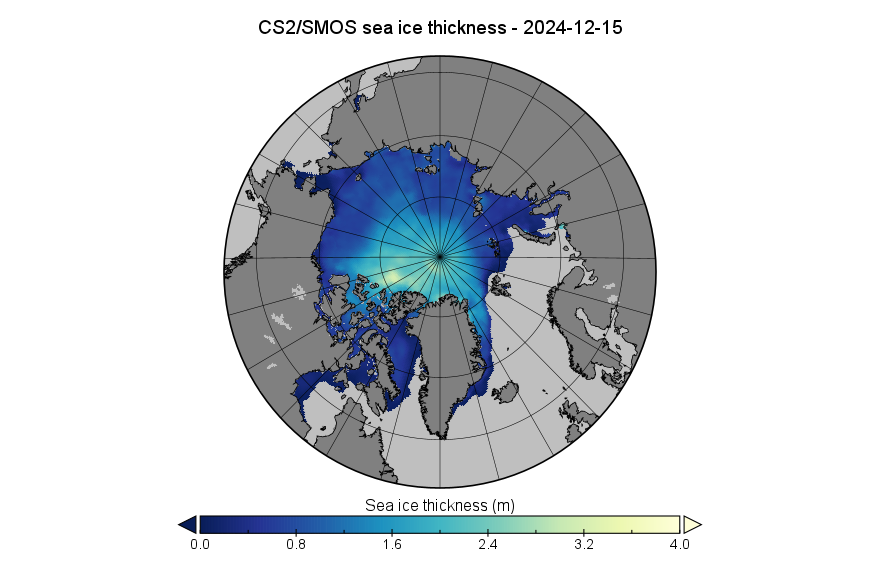
Note the change in scale and areal coverage.
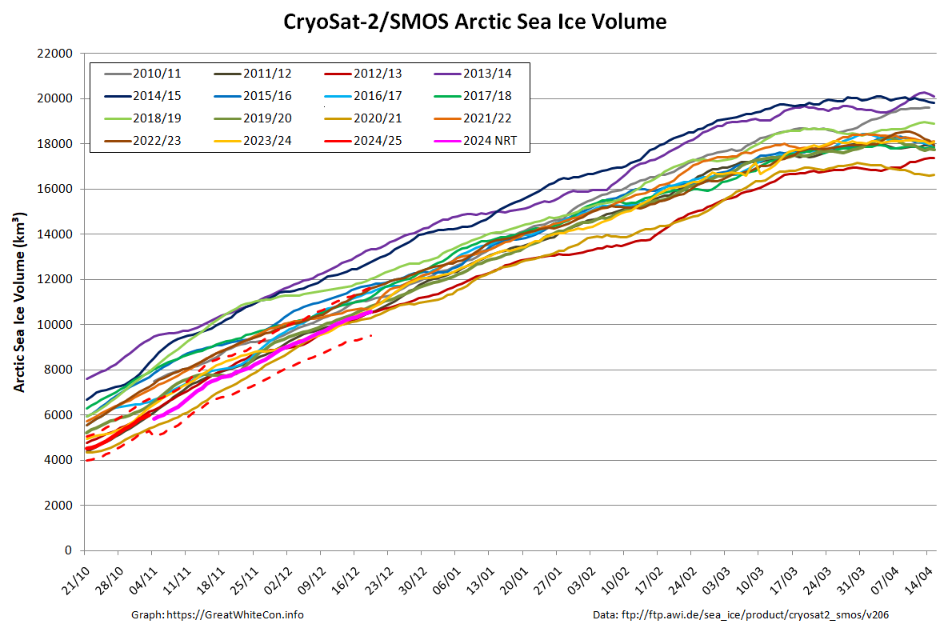
Some reanalysed data is appearing on the CS2/SMOS volume graph, and as anticipated the revisions reveal increased volume compared to the near real time data:
Here too is the latest DMI high Arctic freezing degree days graph:
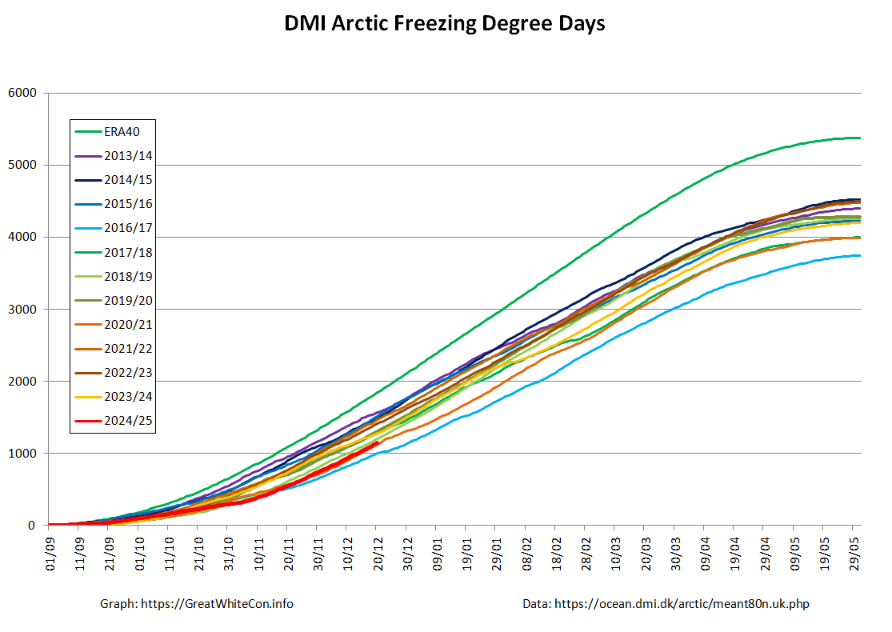
2024 is currently 3rd lowest for the date, behind 2016 and 2020.
Watch this space!
Extent and Volume running low enough, in the Arctic at least , will be interesting to see what Piomas shows at the end of the year.
Of course, also Antarctica sea ice melt has recently been slower than what we’ve seen in the last few years.
Is it possible there’s some kind of connection, one is low, while the other recovers a bit, or just a coincidence?!
And of course Happy New Year to all, 2025