March has arrived, so it’s time to start taking a serious look at where and when the 2023 maximum Arctic sea ice extent will occur.
To start with here’s Zack Labe’s overview of previous years’ maxima:
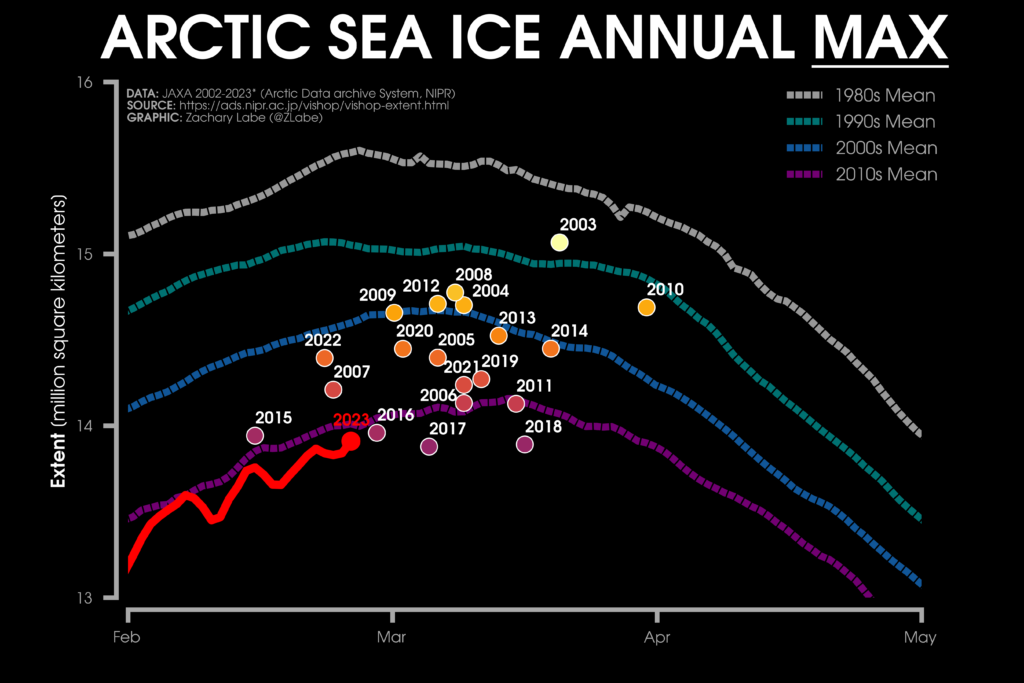
Zack’s graph displays the JAXA/ViSHOP version of Arctic extent, so here too is JAXA’s own graph of the current sea ice extent:
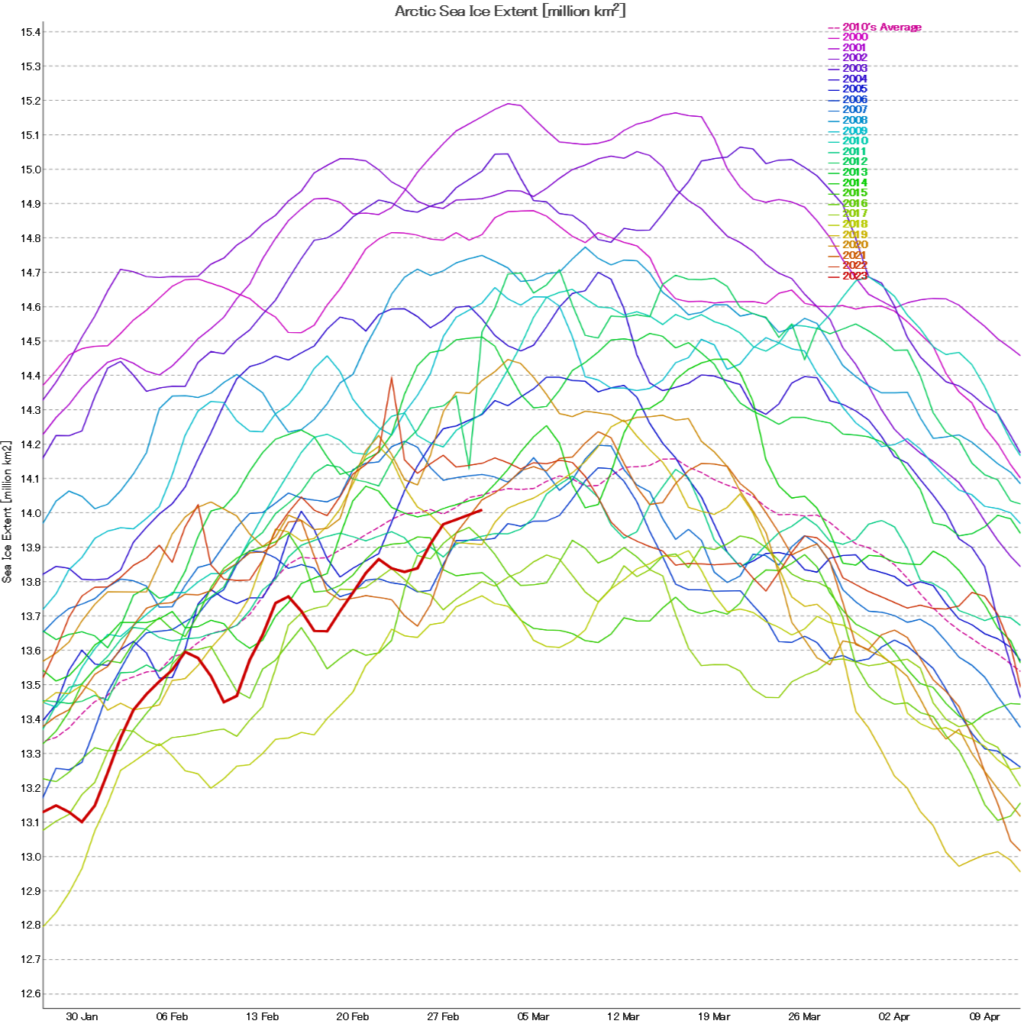
It doesn’t look as though the 2023 maximum has been achieved yet, but extent on March 1st was 14.01 million km². That is evidently not going to be the lowest in the satellite era!
[Edit – March 8th]As Tom has already mentioned below, JAXA extent has declined significantly since the (so far!) peak extent of 14.12 million km² on both the 2nd and 3rd of March:
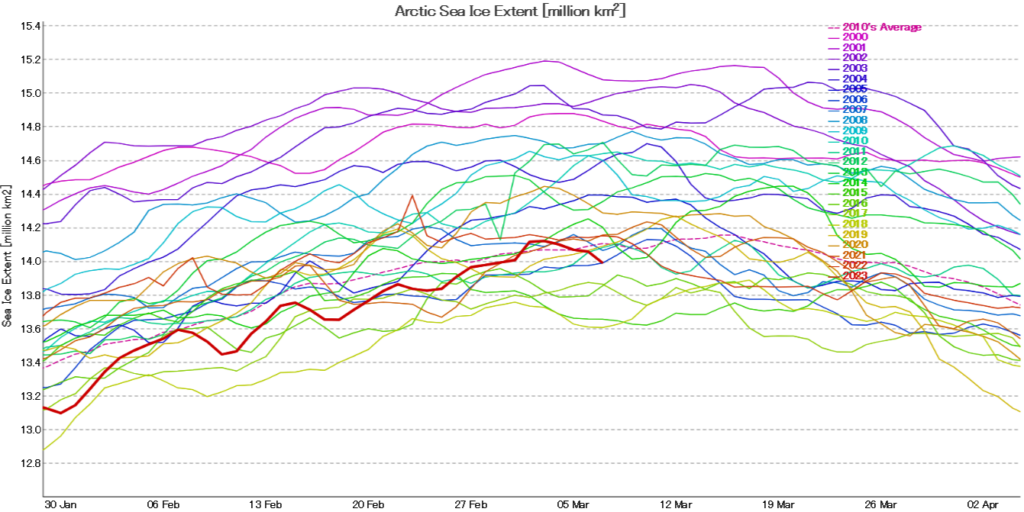
It’s too soon to be certain of course, but we certainly now have a good candidate for the 2023 maximum JAXA extent.
NSIDC 5 day averaged extent is still increasing, but let’s see what this afternoon’s update (UTC) reveals…
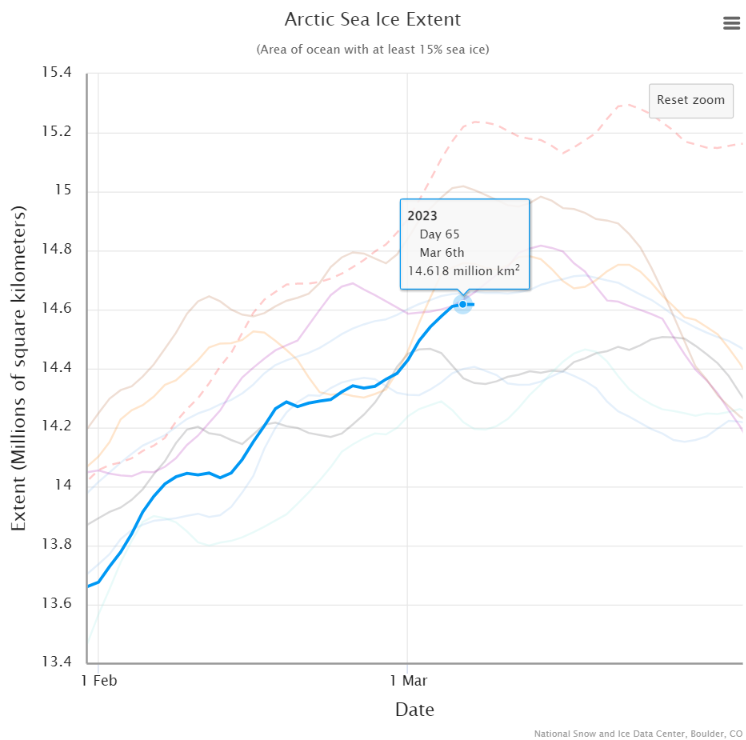
Which is a decrease of 0.001 million km² from March 6th, leaving a current NSIDC maximum extent of 14.62 million km²!
Finally, for the moment at least, AWI’s “high resolution” AMSR2 extent looks a lot less convincing than JAXA’s:
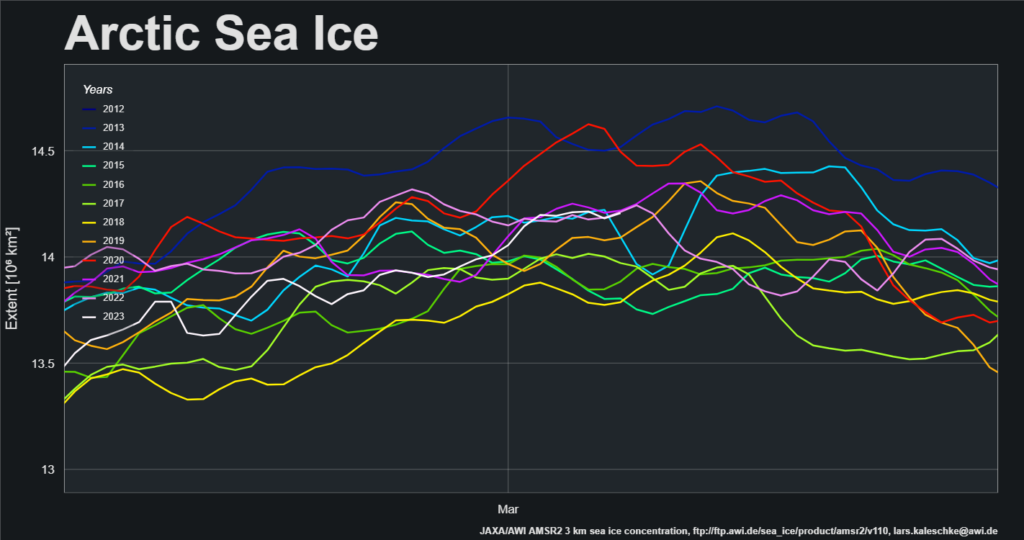
NSIDC Arctic sea ice extent took a tumble yesterday, so with only mild trepidation I’m calling the 2023 maximum extent. In the case of the NSIDC’s 5 day average metric that’s still a rounded up 14.62 million km² on March 6th:
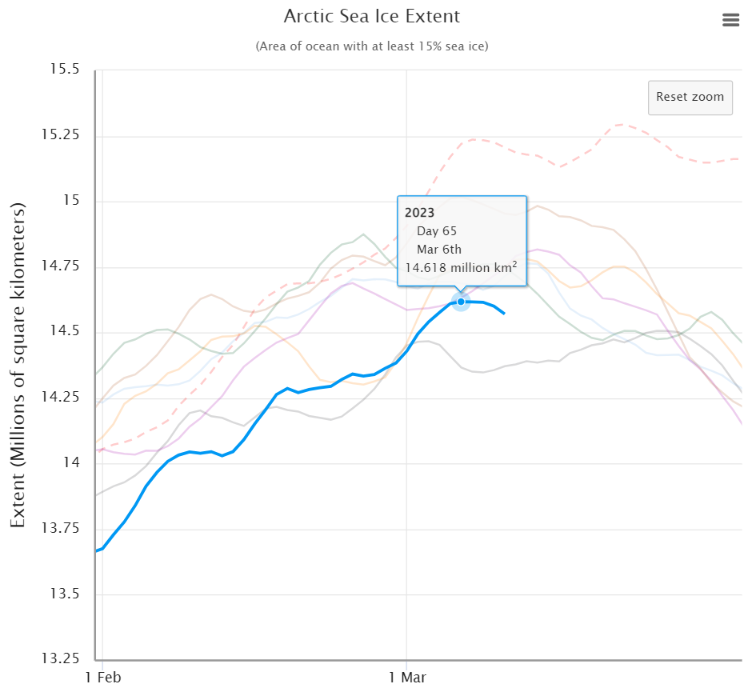
The JAXA/ViSHOP maximum extent remains at 14.12 million km² on March 2nd:
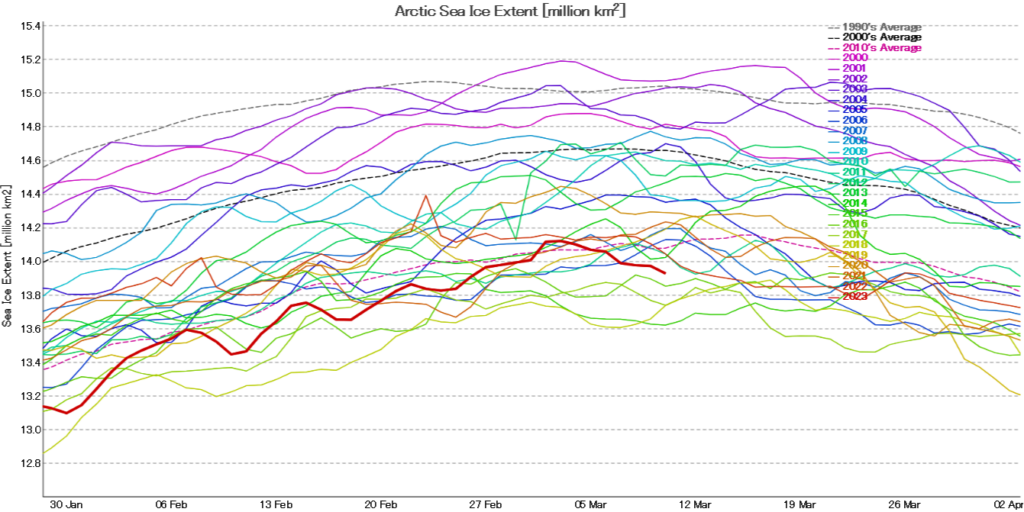
The “high resolution” AMSR2 based metric from AWI peaked at 14.24 million km² on March 5th:
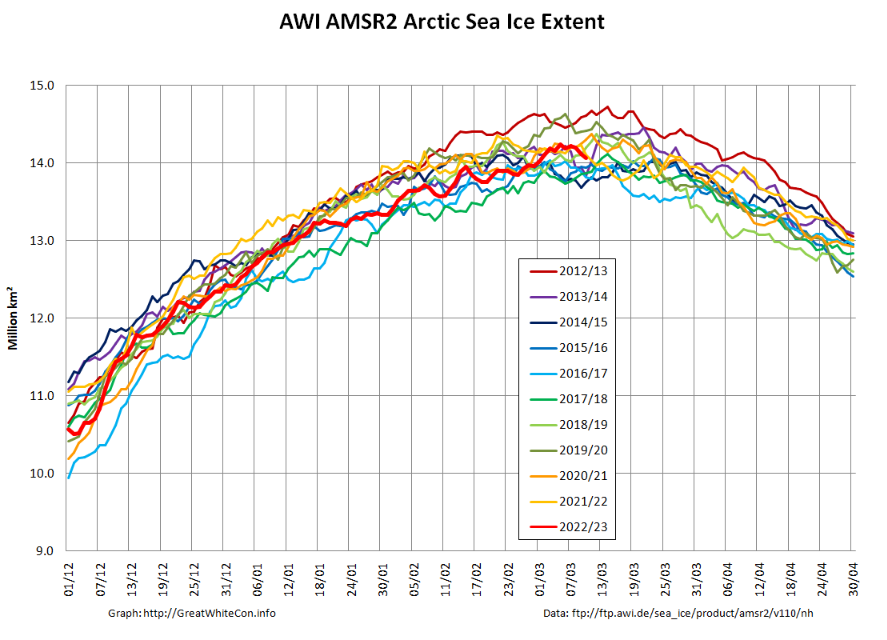
They are of course a bit late with the news, but the NSIDC have now called the 2023 maximum Arctic sea ice extent:
Arctic sea ice has likely reached its maximum extent for the year, at 14.62 million square kilometers (5.64 million square miles) on March 6. The 2023 maximum is the fifth lowest in the 45-year satellite record. NSIDC scientists will present a detailed analysis of the 2022 to 2023 winter sea ice conditions in the regular monthly post in early April:
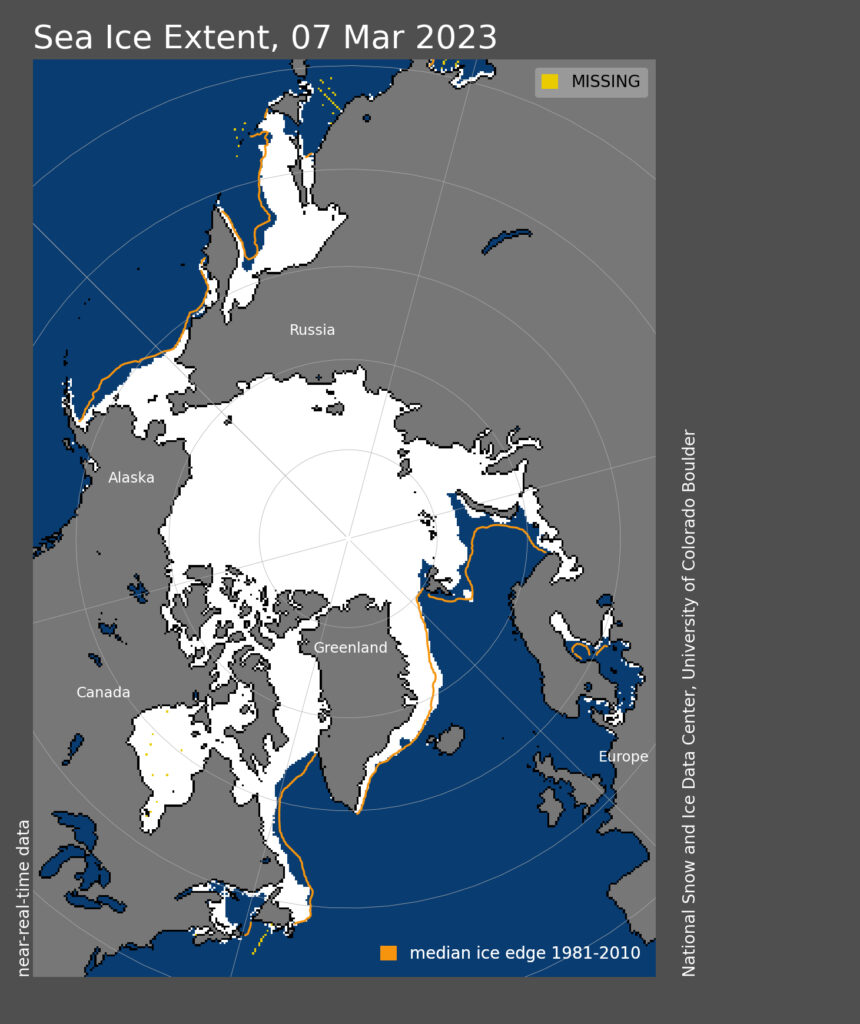
The date of the maximum this year, March 6, was six days earlier than the 1981 to 2010 average date of March 12…
The ice growth season ended with below average sea ice extent in the Bering Sea, Sea of Okhotsk, Barents Sea, and Labrador Sea. Above average extent was in the Greenland Sea. Extent was well below average in the Gulf of St. Lawrence for a second year in row.
Watch this space!
I dunno about you, but I got this science-free gut feeling about the ice this spring (it’s even spring temps here in Greenland already).
Maybe this year I’ll remember to apply lotion before chilling in the sun… Hope springs eternal!
I’ve certainly been wondering about all the old ice hovering by the Fram Strait exit.
It’s all right for you lot up in Greenland FE, but it’s snowing down here in SW England!
JAXA extent has just fallen for the fourth day in a row.
We must be getting close to the average maximum, it had already passed this time last year!
I just arrived to impart the same message Tom!
See above shortly…
Excitement, at 50-50.
Good morning FE (UTC),
Where is your raw data?
No URL in the graphic!
Oh, this is just a quick assessment of past 20 years at JAXA sea ice extent, and how many of them had later gains capable of taking 2023 back up to a new maximum. On March 8, ten of these years do, and ten don’t.
Message received and understood.
It’s all to play for, as Gary Lineker won’t be saying this weekend:
I keep seeing his name all around, but still have no idea what he said or did (some US lady on Twitter suggested something sounded too much like an obituary, so I hope the lad isn’t dead?).
In other news, some light drizzle of snow, a bit wet, so possibly rain, even here in Greenland tonight. Seemingly coming out of tornado-looking dark grey clouds. Beautiful time of year!
Gary Lineker is a (apparently not world!) famous English football (AKA soccer) player turned commentator on the BBC.
The powers that be in the land of the unfree objected to some recent social media commentary of his on unsporting topics:
Now even AWI agrees.
Yup. “Snow White” has called it.
See above and/or on the March open thread.
Good job! Of course, with the SSW ending, all might flip back overnight, and we’ll all have to dine on crow birds.
It’d better not “flip back” FE. “Snow White’s” reputation is on the line!
https://twitter.com/GreatWhiteCon/status/1634857992301473792
Enough of the soccer metaphors?
“start of the 2023 #Arctic #SeaIce melting season!
[…]
@JAXA_en
14.12 mio km² on March 2nd”
Technically, doesn’t the melt season start the day after Maximum? Here it looks like you put the day before instead. Rounded to just 4 significant digits, 2nd & 3rd March are equal, but 3rd is way higher, which should count when we look for the Maximum, no?
It’s like a VAR judgement or whatever.
Given the variation in the date and magnitude of the maximum extent amongst the assorted metrics do you really want to quibble about the 3rd decimal place? The ViSHOP web site rounds to 2 DPs, and I’m happy to follow suit!
There aren’t enough characters in a Twitter post to expand at greater length. Surely the context makes it clear I’m quoting the dates of the maxima?
I tend to agree 100% with all that!*
So, interestingly if we take that sentiment a notch further, one could look at all the ‘metrics’, and not just the different brand and resolution ones, but also the other methods or types, i.e. area & volume, and come up with a more generalised Maximum definition. In practical terms, it might still make sense to separate ‘2D Maximum’ from ‘3D’ (volume), as those are generally a month+ apart.
And building on that interesting point, here’s another one: If Spring Maxima are a month apart, and Autumn Minima aren’t, does that also tell a tale of a sea ice situation that hasn’t yet matured? Maybe that it is in its ‘teen stage’ of maturing to the next level? Not sure we have enough data to verify if the Autumn Minima used to be a month apart before the onset of abrupt climate change, but that would be my assumption: I don’t know that there is a reason for this to not be symmetrical.
*) Just as a matter of principle, the Melt Season necessarily starts with a day of net melt, not with a day of ice growth that accomplishes the highest level of 2D ice cover in an entire year.
PS: I attach the ‘finished’ graph for the JAXA transition into virtual certainty.