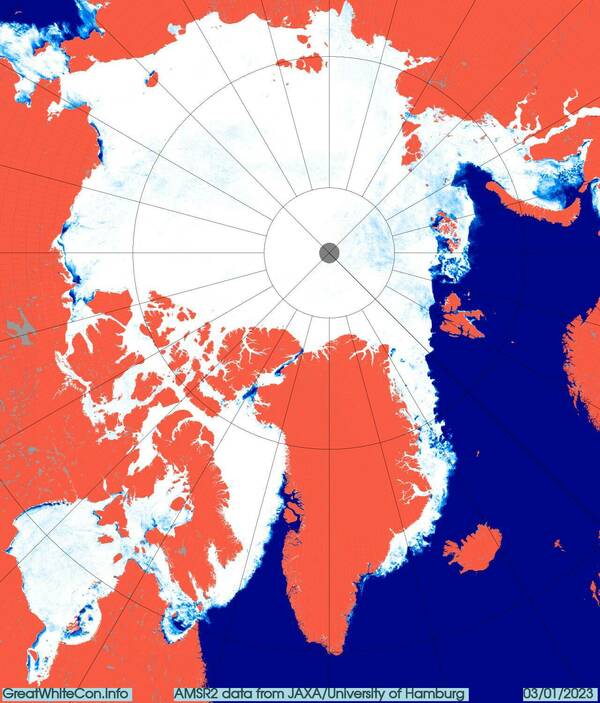
At the beginning of the New Year all the central regions of the Arctic are now refrozen apart from a small area of the Kara Sea:
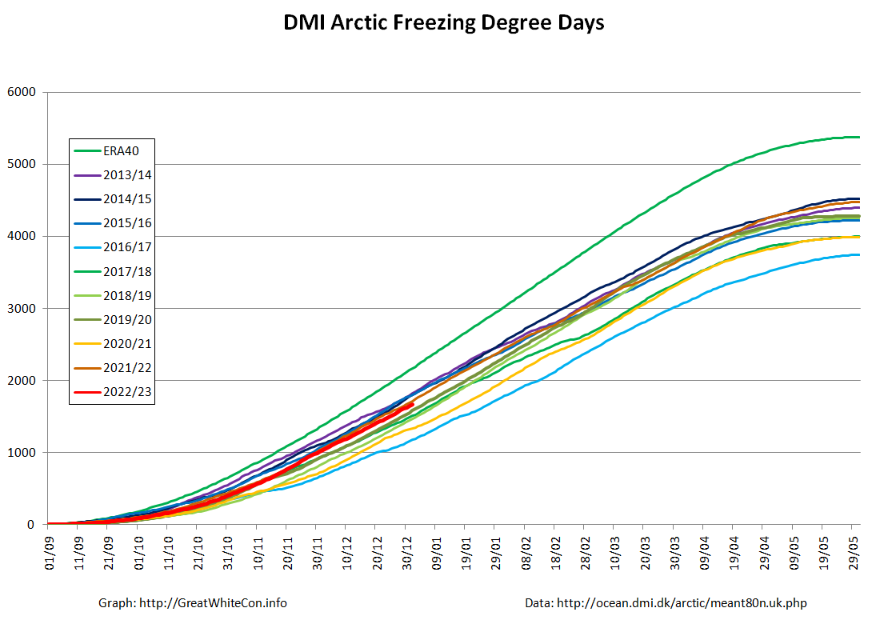
Most Arctic sea ice metrics are near the middle of their respective ranges over the last decade. By way of example, here is a graph of Arctic Freezing Degree Days based on the Danish Meteorological Institute’s temperature data for the area north of 80 degrees latitude:
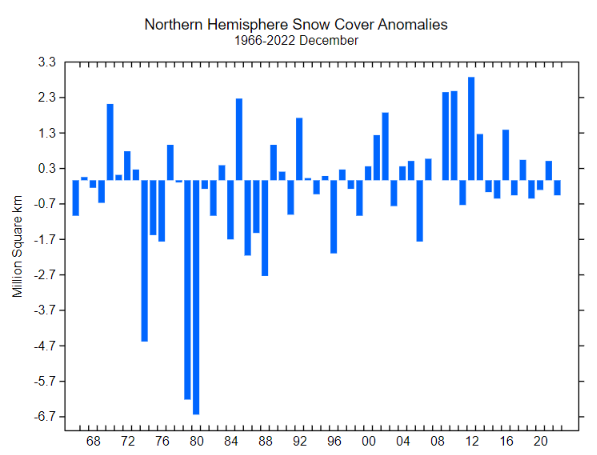
Rutgers Snow Lab’s northern hemisphere snow cover anomaly for December 2022 is slightly negative:
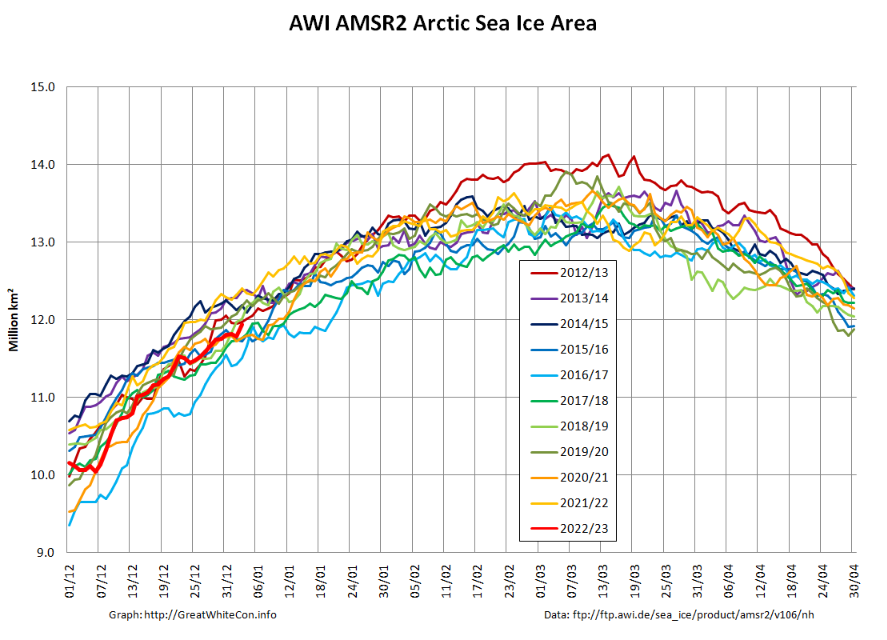
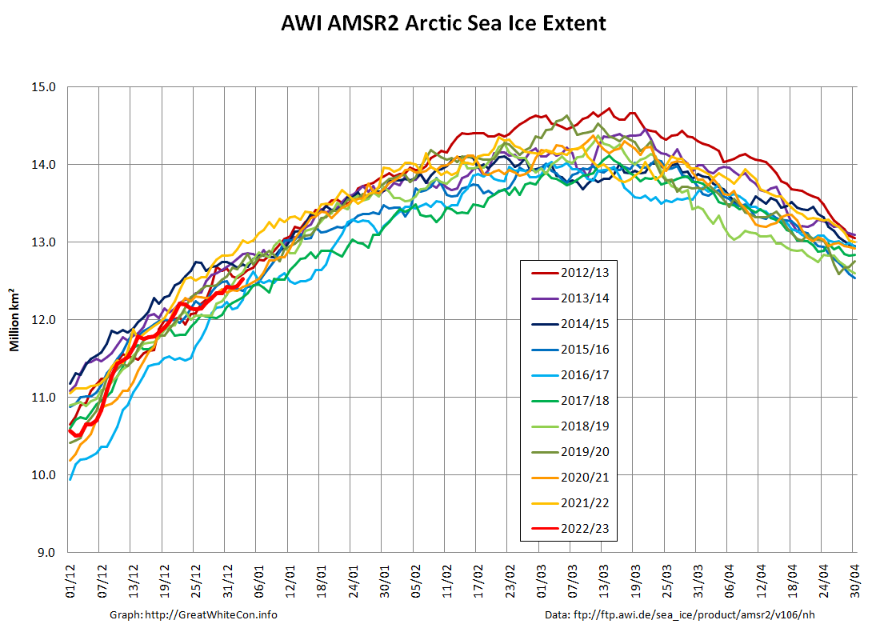
Here too are the high resolution AWI AMSR2 area and extent graphs:
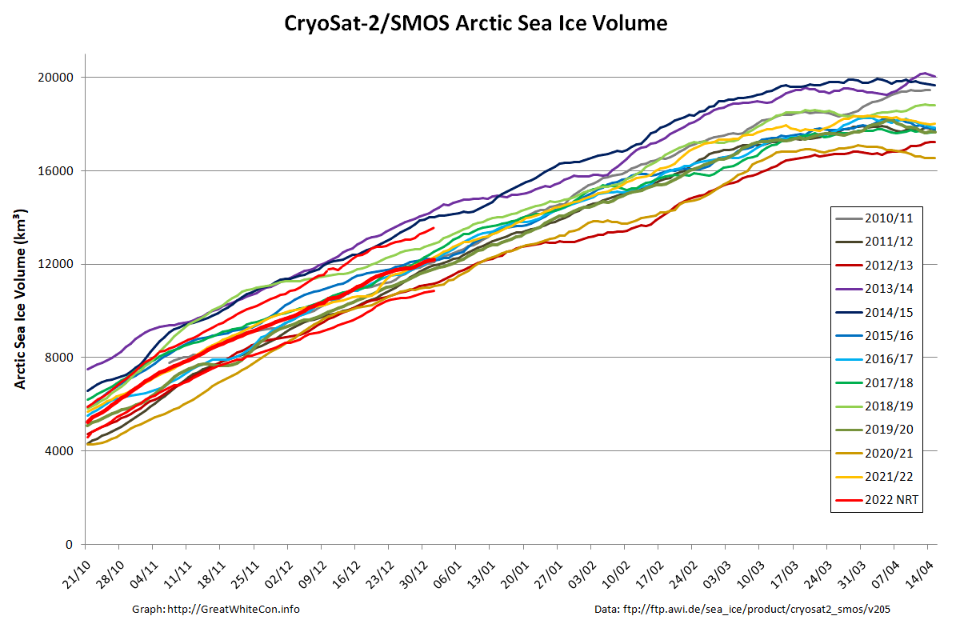
The latest AWI CryoSat-2/SMOS volume graph tells a similar story:
Although overall volume is in the middle of the pack, the associated thickness map:
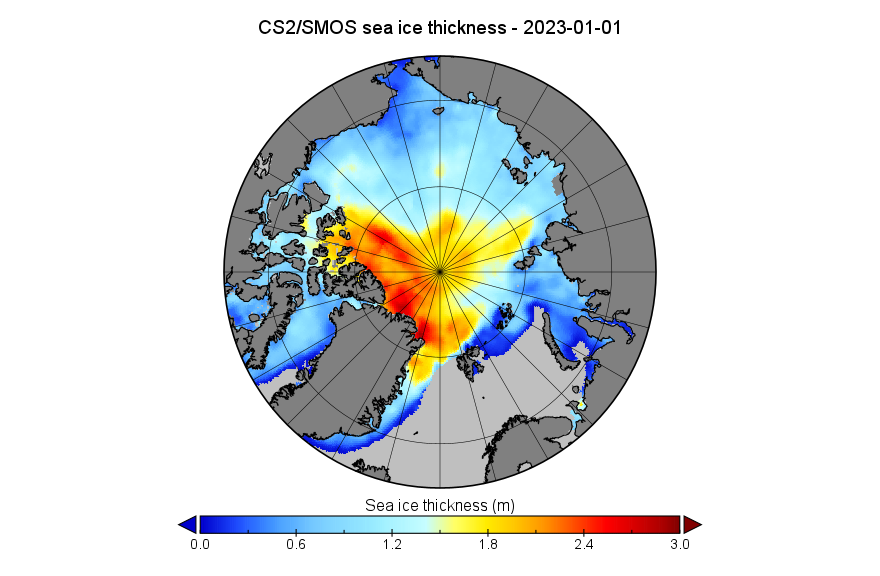
and the thickness anomaly map from the Finnish Meteorological Institute reveal an unusual distribution of thicker ice:

A considerable volume of ice currently situated between Svalbard and North East Greenland seems destined to exit the Central Arctic Basin via the Fram Strait over the coming months.
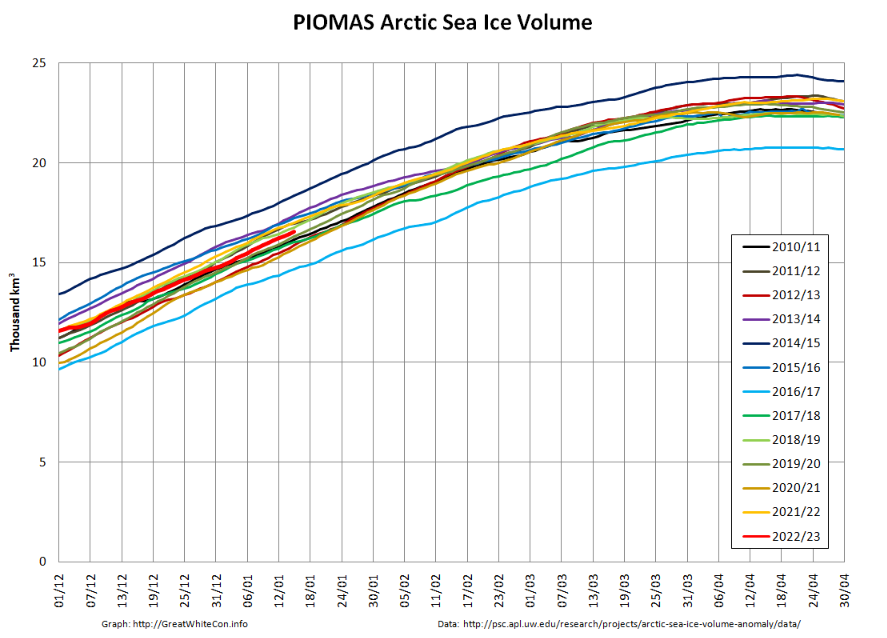
[Edit – January 24th]In a somewhat belated mid month update, here’s the PIOMAS daily Arctic sea ice volume graph:
together with the PIOMAS thickness map on January 15th:
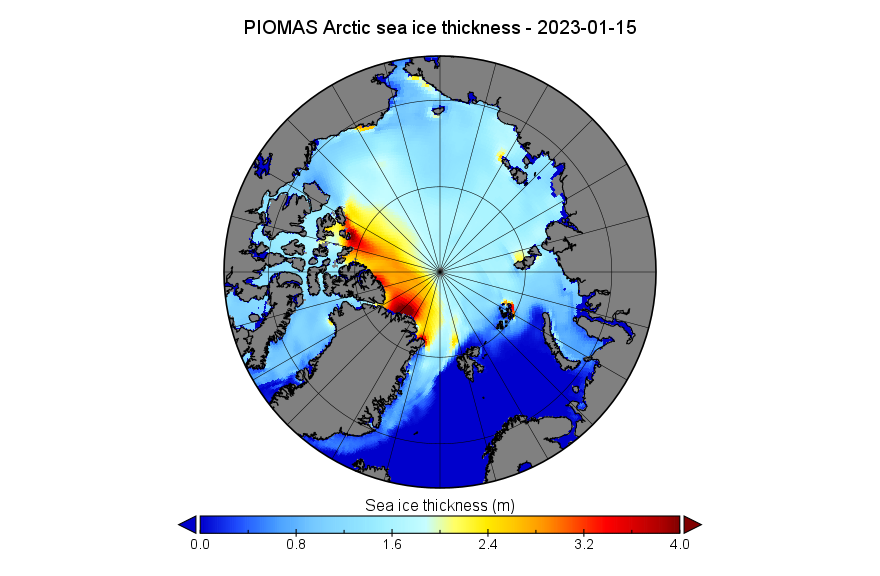
For comparison purposes here’s the AWI CryoSat-2/SMOS thickness map using the same scale:
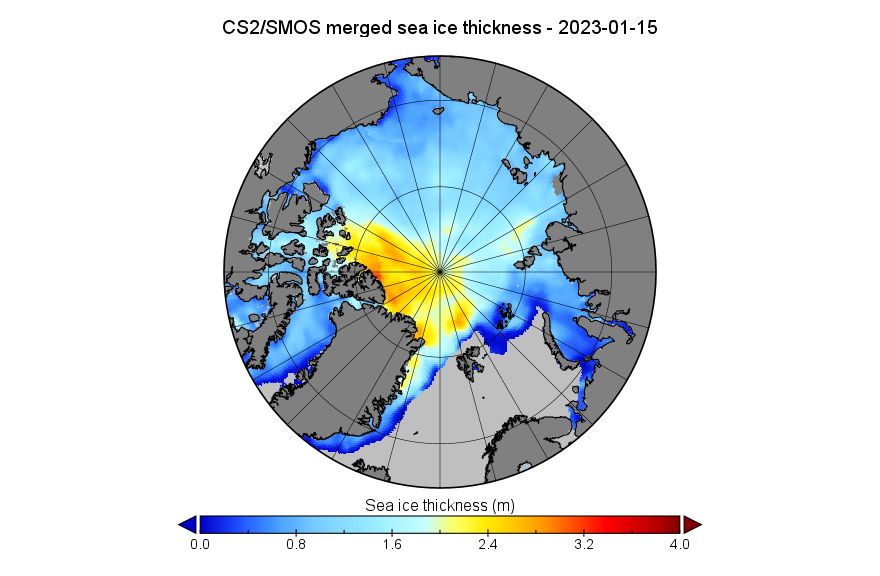
Note the change of scale from the beginning of the month CS2/SMOS map at the top.
Here too is Lars Kaleschke’s animation of recent Arctic sea ice concentration, with the width of leads exaggerated to reveal ice motion:
Evidently sea ice export from the so called “last ice area” is continuing via the Nares Strait and in particular via the Fram Strait between Greenland and Svalbard.
Although not on the same scale as the cyclone at around the same time last year, surface pressure of a storm near Svalbard bottomed out at 965 hPa yesterday:
It will be interesting to see what effect the storm has on the ice on the Atlantic periphery over the next few days.
Further news is now available on the February 2023 open thread.
Not to jump in ahead of Neil, and slightly off topic (in a way), both Antarctic and global sea ice extent started the year at a satellite era record low.
How the year will proceed is anyone’s guess at this point of course!
Yup – Antarctic extent is currently well below all previous years in the satellite era:
yeh, its warm down here but nothing extreme : although it is consistent
January 2023 is still below 2010;s average.
Only 2016, 2017, 2018 and 2021 less than January 2023
Jan.31.—-16th.lowest. +333,064 sq.km. above 2010’s average.
Feb.28.—-11th.lowest +116,764 sq.km. above 2010’s average
Mar.31.—-10th.lowest -127,470 sq.km. BELOW 2010’s average
Apr. 30.—-14th.lowest +16,886 sq.km. above 2010’s average
May. 31.—15th lowest +395,097 sq.km. above 2010’s average
Jun. 30.—-10th.lowest +35,744 sq.km above 2010’s average
Jul. 31.—–12th lowest +228,905 sq.km. above 2010’s average
Aug.31.—-11th.lowest +203,902 sq.km. above 2010’s average
Sep.30.—–7th lowest +115,918 sq.km. above 2010’s average
Oct.31.—– 11th lowest, +269,119 sq.km. above 2010’s average
Nov30.——5th lowest, -183,803 sq.km. BELOW 2010’s average
Dec.31—–4th.lowest,-138,700 sq.km. BELOW 2010’s average
Jan.7——-5th.lowest,-48,000 sq.km. BELOW 2010’s average
Lets wait and see what lies ahead in 2023
I wonder are we looking at continued export through the Nares for the second winter in a row!
It’s beginning to look that way, but time will tell!
I’m noticing that everybody (NSIDC, JAXA, DMI, etc.) sees extent as flattening, but DMI thinks volume Irma steadily growing. That suggests compaction. Jim, fo up see drivers for that? Any ideas as to what PIOMAS will show? It’s pretty cold up there…
“is steadily growing…” damn autocorrect!
And “…do you see drivers…”
I think the Barents sea is lower than normal, it was a warm summer there, plenty of low pressure systems coming in from the Atlantic are not helping the ice grow there, which, maybe, could give the melt season a head start in that part of the Arctic.
Otherwise the ice continues to thicken, Volume usually peaks around mid April.
As I have mentioned previously, I don’t have a lot of faith in DMI’s modelled thickness/volume numbers. More on the topic of volume in the forthcoming February open thread, but in the meantime compare and contrast:
I see what you mean. The two maps are hard to compare, but the main disagreement appears to be ice thickness in the Beaufort. PIOMAS will be weighing in soon, we’ll see what they say…