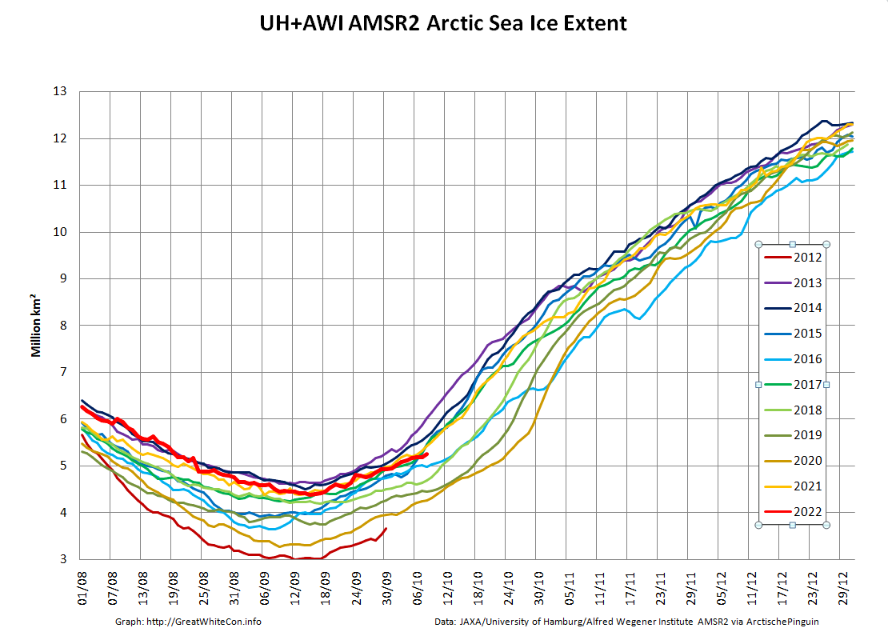
The 2022/23 freezing season has begun, so to begin with here are Arctic sea ice area and extent during its early stages:
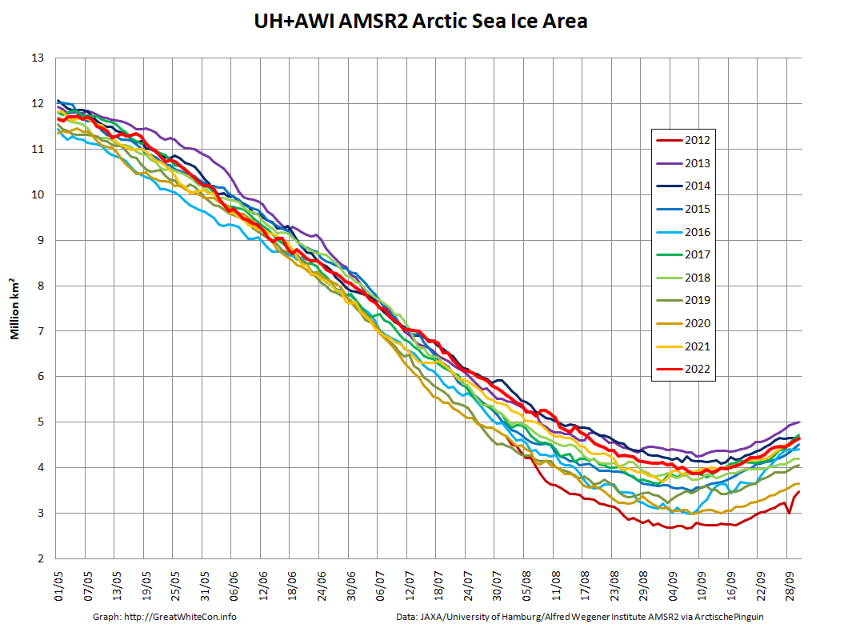
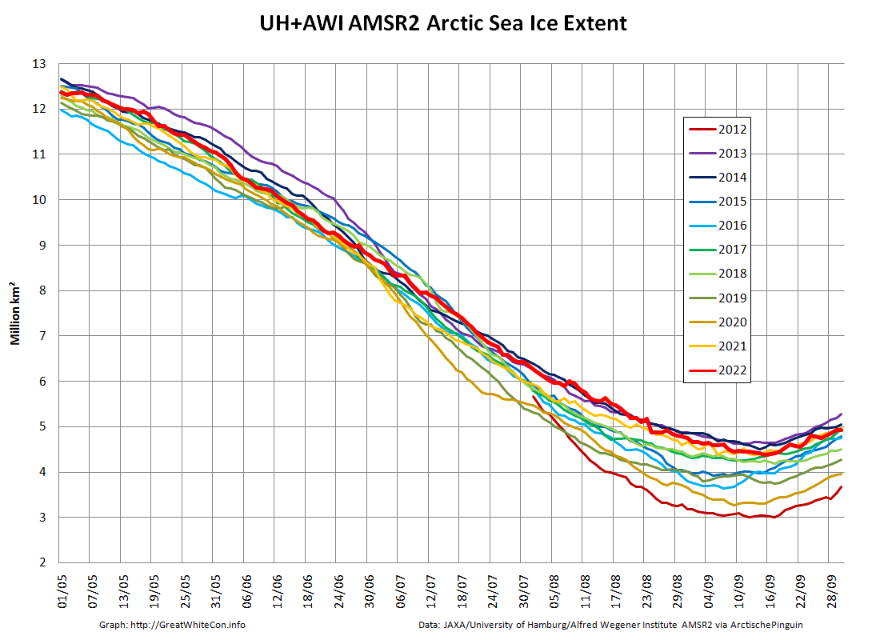
Both metrics are currently tracking 2021 quite closely.
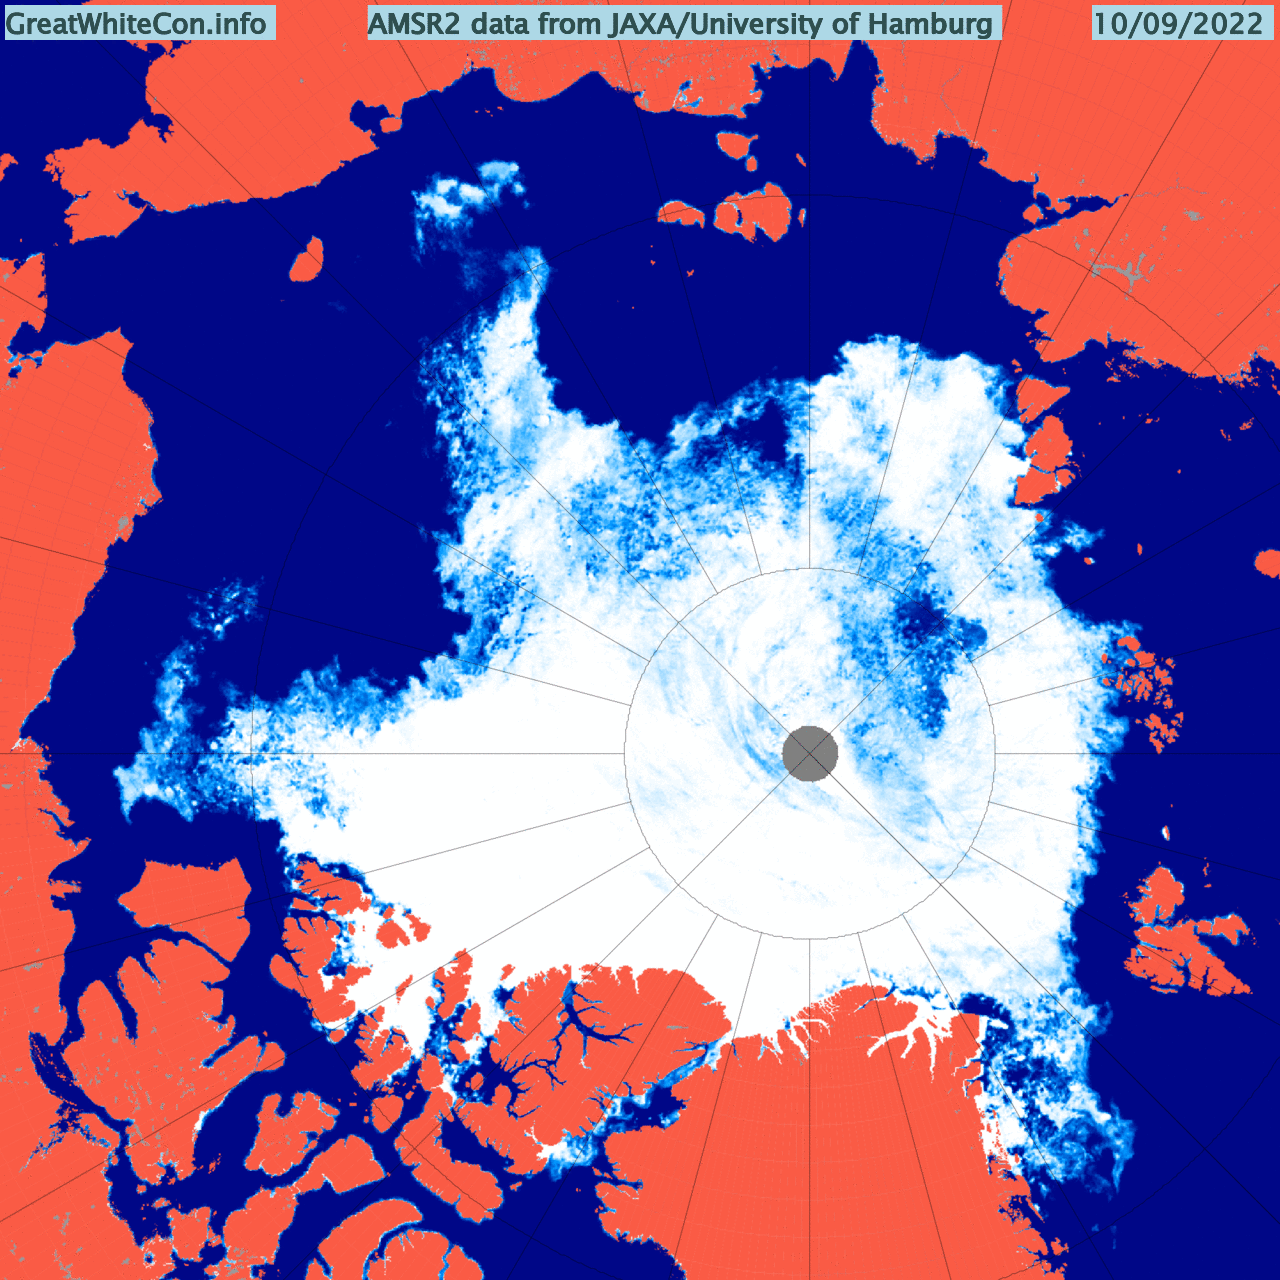
Here too is an AMSR2 animation of the transition from melting to freezing in the Central Arctic. Click to animate, and be warned that the file size is almost 10 Mb:
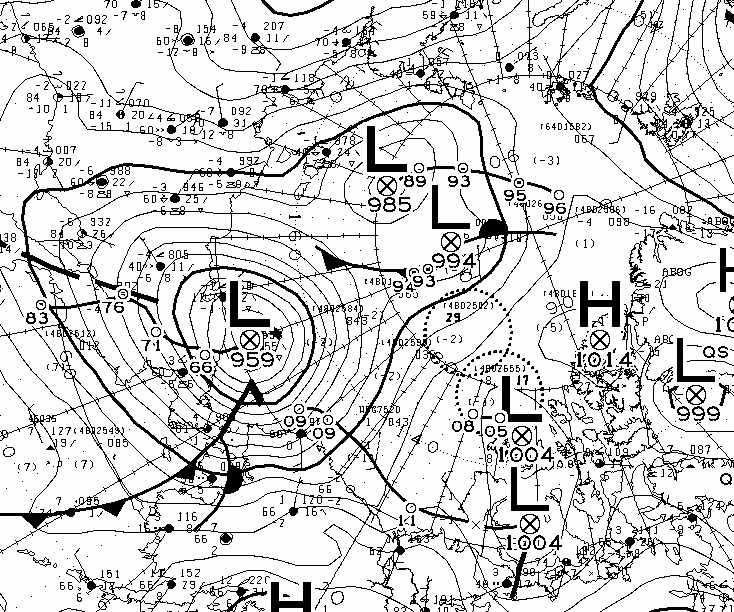
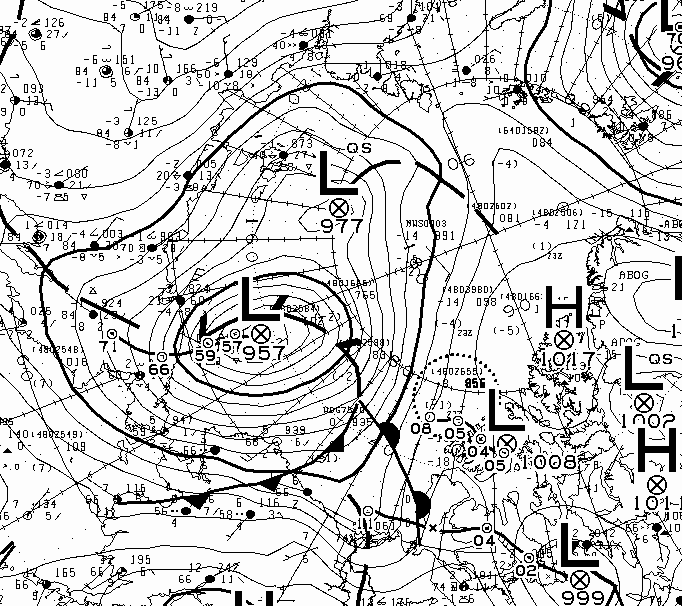
Another big storm is heading for the Chukchi Sea. The GFS forecast currently shows a sub 960 hPa low developing on Thursday:
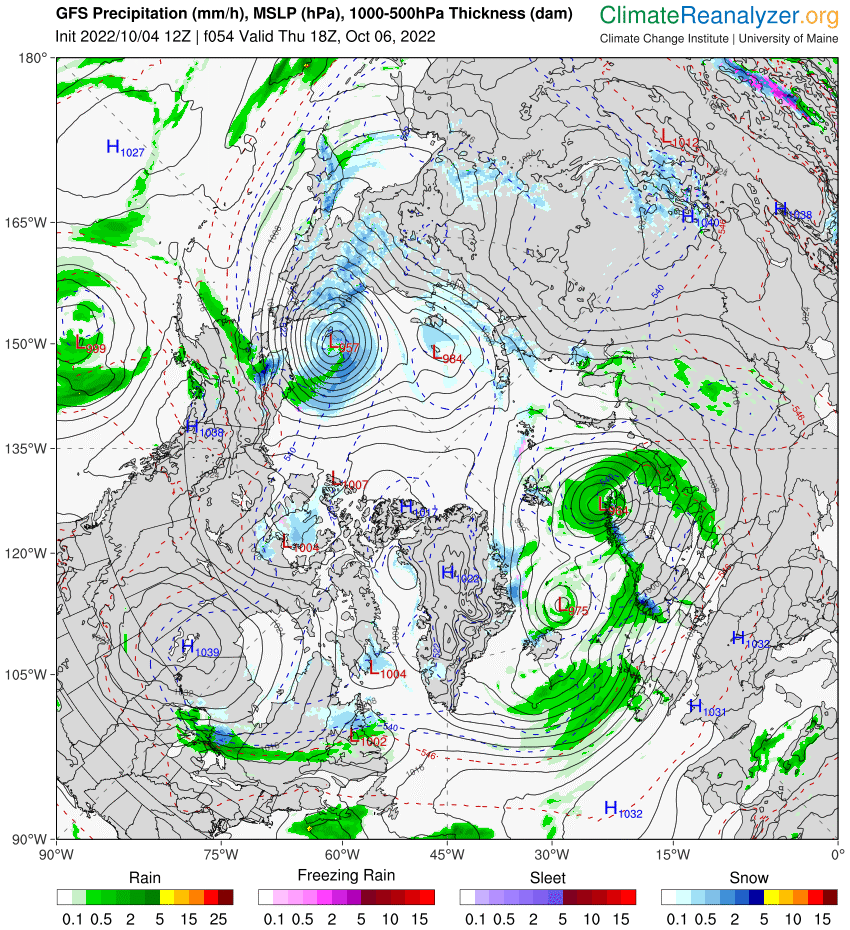
There is still a lot of open water in the path of the cyclone, and some substantial waves are forecast to develop.
In other news the University of Washington’s Polar Science Center has finally resumed timely updates of PIOMAS data. However since they’ve forced me start producing my own graphs here’s a close up of volume around this years minimum, derived from the official data:
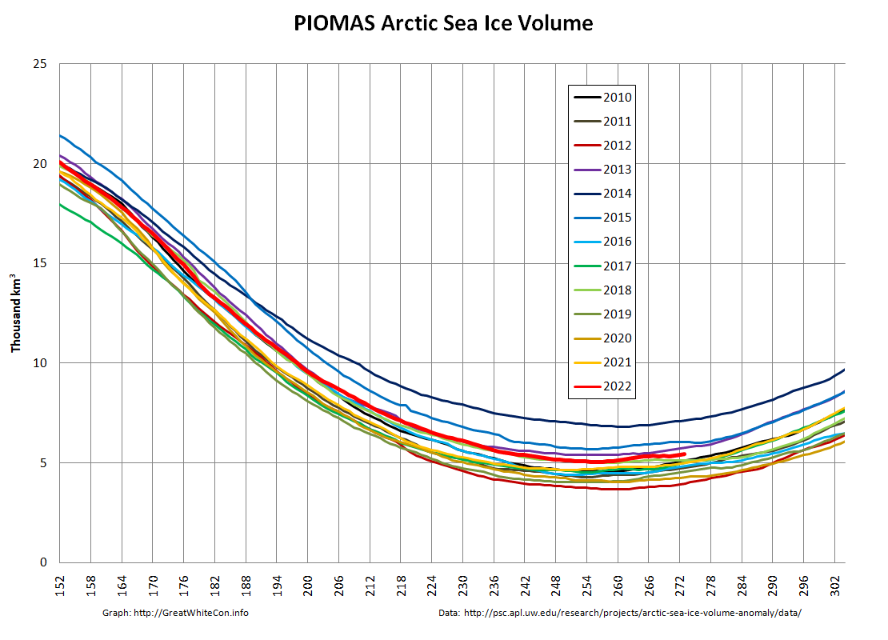
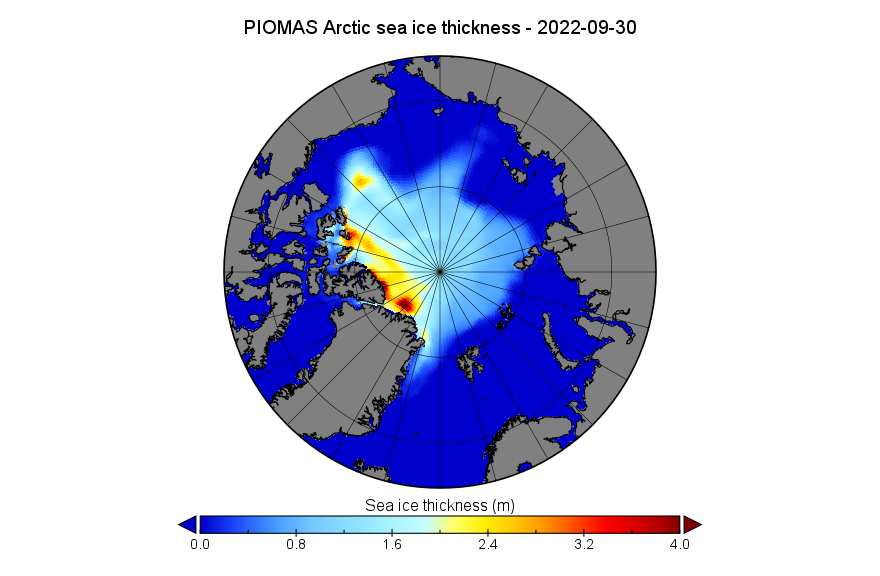
PIOMAS Arctic sea ice volume is currently 10th lowest in the satellite era. Here too is the end of September thickness map:
and the “official” thickness anomaly map:

The PSC’s September report has this to say:
Average Arctic sea ice volume in September 2022 was 5,200 km3. This value is the 10th lowest on record for September, about 1,400 km^3 above the record set in 2012. Monthly ice volume was 77% below the maximum in 1979 and 64% below the mean value for 1979-2021. Average September 2022 ice volume was 1.3 standard deviations above the 1979-2021 trend line…
The ice thickness anomaly map for September 2022 relative to 2011-2020 shows strong positive anomalies from Greenland, along the Canadian Archipelago , the Eastern Beaufort, Chukchi and East Siberian seas. Negative anomalies reach from the North Pole to Svalbard. This anomaly pattern is associated with anomalous advection into the areas that show positive sea ice thickness anomalies with much of that anomaly developing during February and March of 2022. Inter-annual variability has a strong internal component Sea ice volume in the Beaufort Sea in recent years has been strongly controlled by sea ice motion as shown in our new paper here.
The abstract of the “new paper” by referred to explains that:
[Edit – October 6th]Using satellite-based observations of sea ice, an atmospheric reanalysis and a coupled ice-ocean model, we show that during the summers of 2020 and 2021, the Beaufort Sea hosted anomalously large concentrations of thick and old ice. We show that ice advection contributed to these anomalies, with 2020 dominated by eastward transport from the Chukchi Sea, and 2021 dominated by transport from the Last Ice Area to the north of Canada and Greenland. Since 2007, cool season (fall, winter, and spring) ice volume transport into the Beaufort Sea accounts for ~45% of the variability in early summer ice volume—a threefold increase from that associated with conditions prior to 2007. This variability is likely to impact marine infrastructure and ecosystems.
The Canadian Meteorological Centre 12Z synopsis shows the Chukchi cyclone’s MSLP down to 959 hPa:
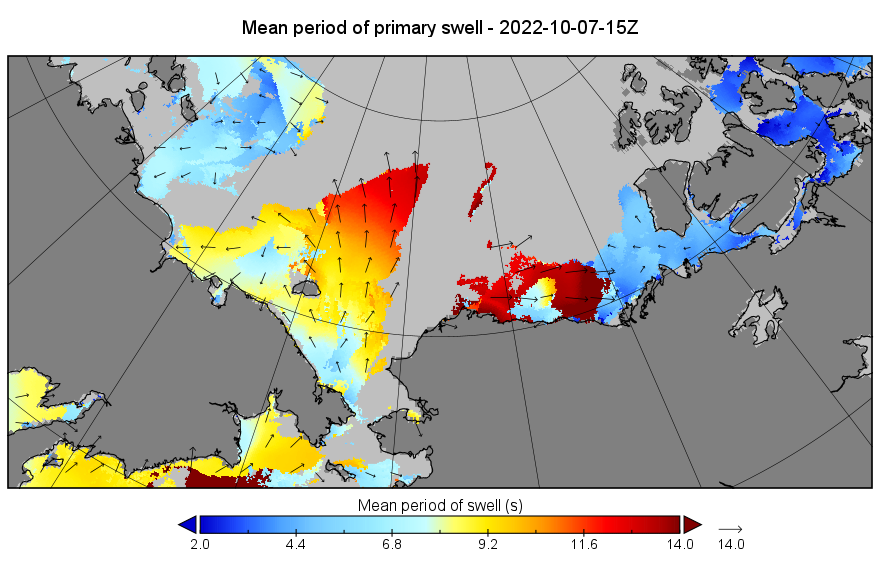
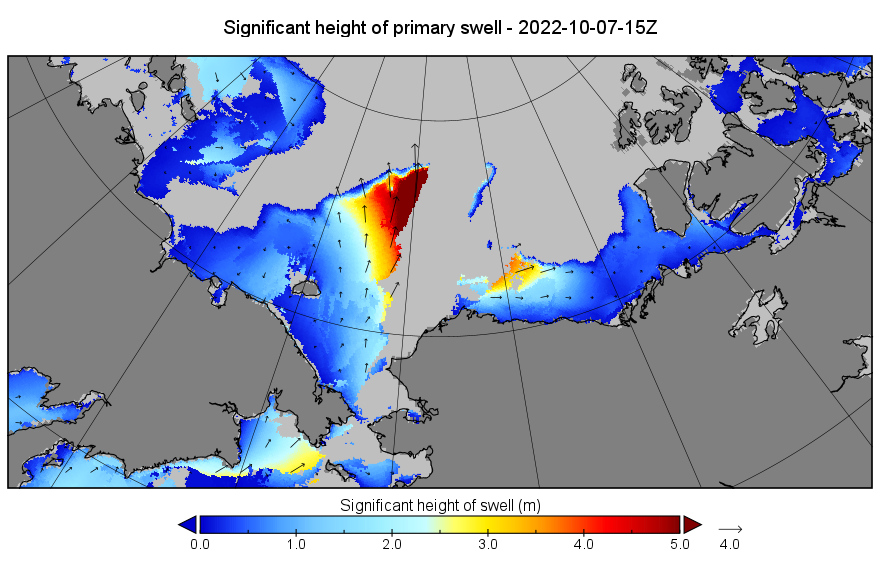
Here’s the GFS Wave prediction for the long distance swell generated by the current cyclone tomorrow afternoon UTC:
According to the CMC the latest Chukchi Sea cyclone bottomed out at around 957 hPa shortly before midnight on Thursday:
Whether as a result of the recent cyclones or not, the rate of increase of AMSR2 sea ice area and extent have both slowed noticeably over the past few days:

The University of Hamburg AMSR2 concentration map reveals new ice spreading north from the Siberian coast:

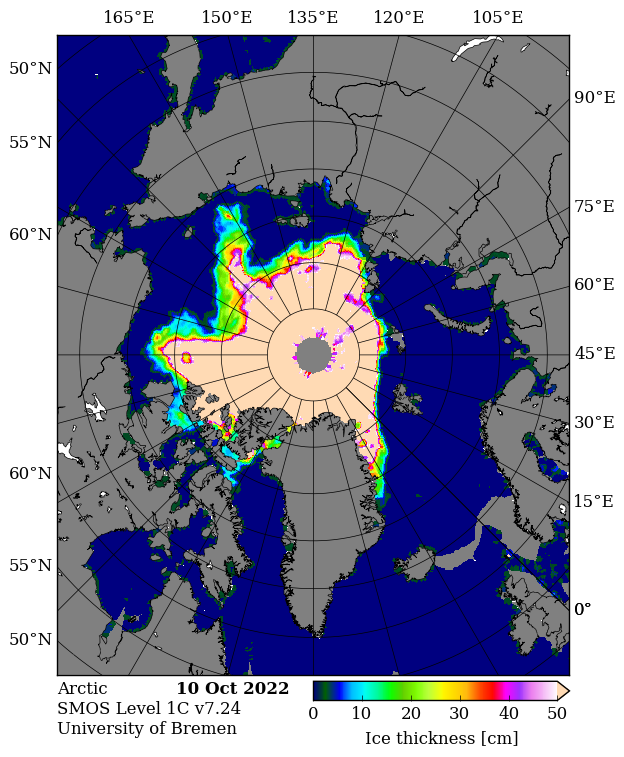
SMOS is back in action now that Autumn has arrived, and provides an insight into the current thickness of the new ice:
The NSIDC’s “quick look” Arctic sea ice age data has been released up to the end of September. Here’s an updated animation that now includes this year’s minimum extent, and hence the updated colours for the new freezing season in the last couple of frames
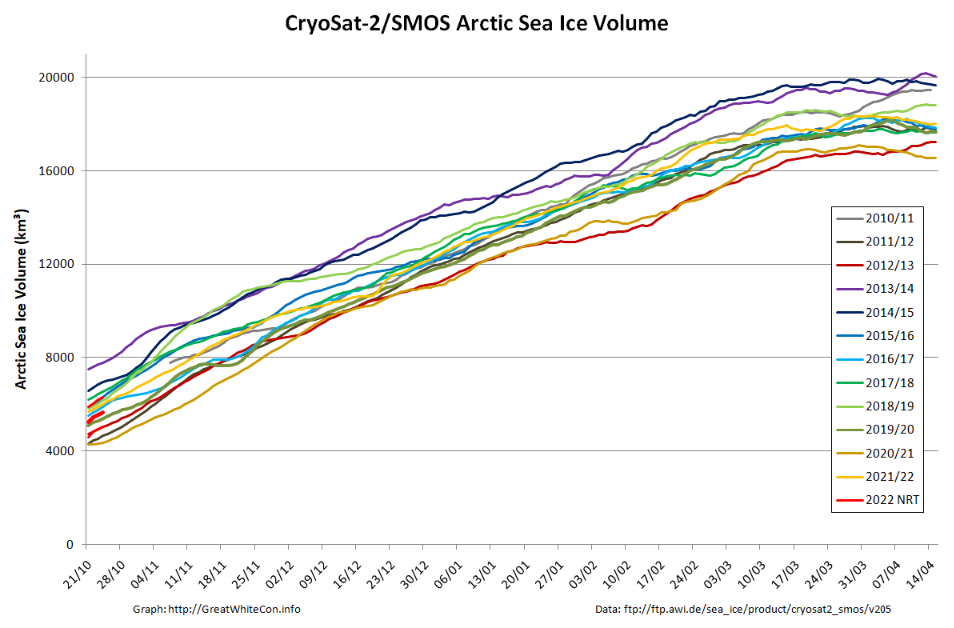
The Alfred Wegener Institute has started publishing merged CryoSat-2/SMOS thickness data once again:
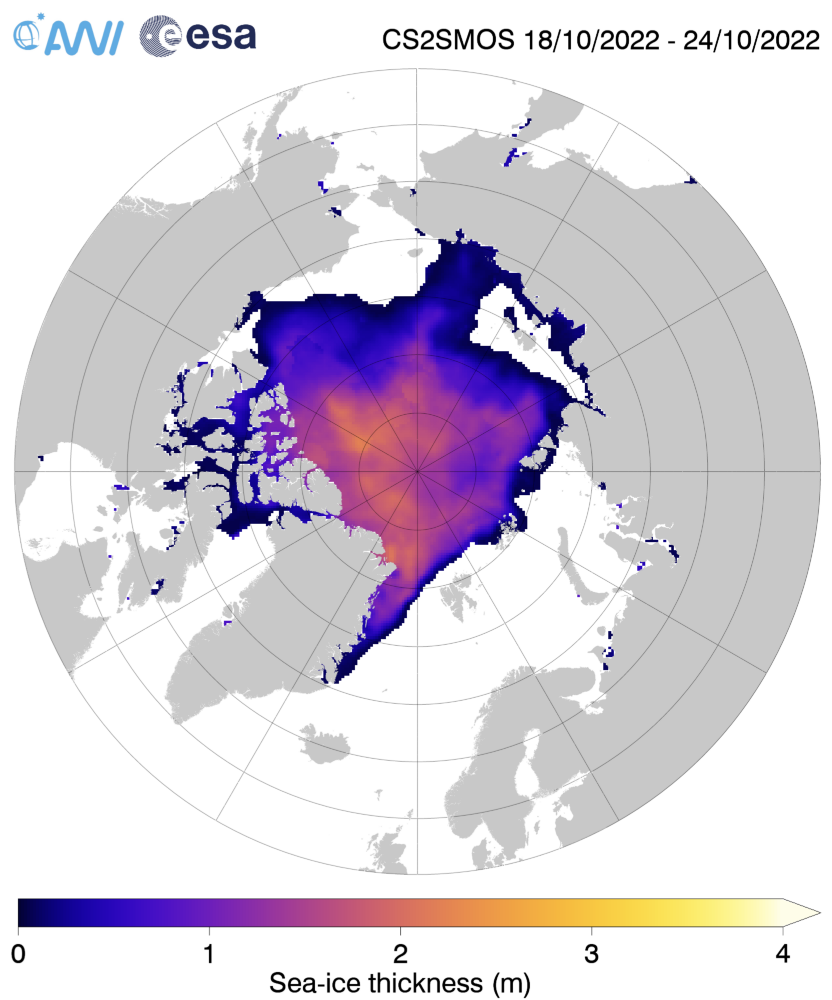
Overall volume is currently slightly below last year, and in the lower half of the post 2010 range:
Further news is now available on the November open thread.
Thank you Jim.
Is this the best refreeze it can do?
Very disappointing.
Almost makes me want to stop blogging.
Long time no see angech!
With the higher latitudes already frozen over it’s likely the refreeze will remain sluggish for quite a while.
Good to see the Slater forecast on the go again after its absence this summer
Thanks for the heads up Tom.
To be honest I gave up checking quite some time ago!
Looks like ice starting to form along the Siberian coast in the Bremen map, this will probably drive extent gains for most of this month, on the other hand temperatures seem persistently high over the Beaufort and Chukchi seas. Will be a while before the Berents sea has any ice
It does indeed.
See above .
.
Global sea ice shows definite downward trend commensurate with the Arctic itself.
These numbers mean big business/government policy has no choice but to change.
[Moved to the open thread – Mod]
These are the latest JAXA daily numbers from Gerontocrat on the ASIF:
However they don’t fit your narrative so I assume you’re talking about the long term trend? Sadly I don’t have a recent example of such a graph to hand.