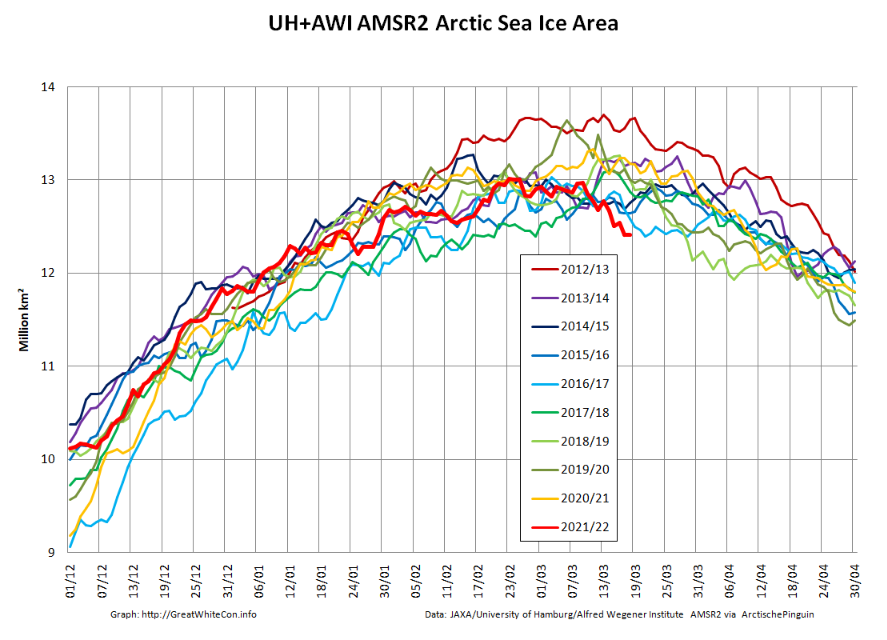
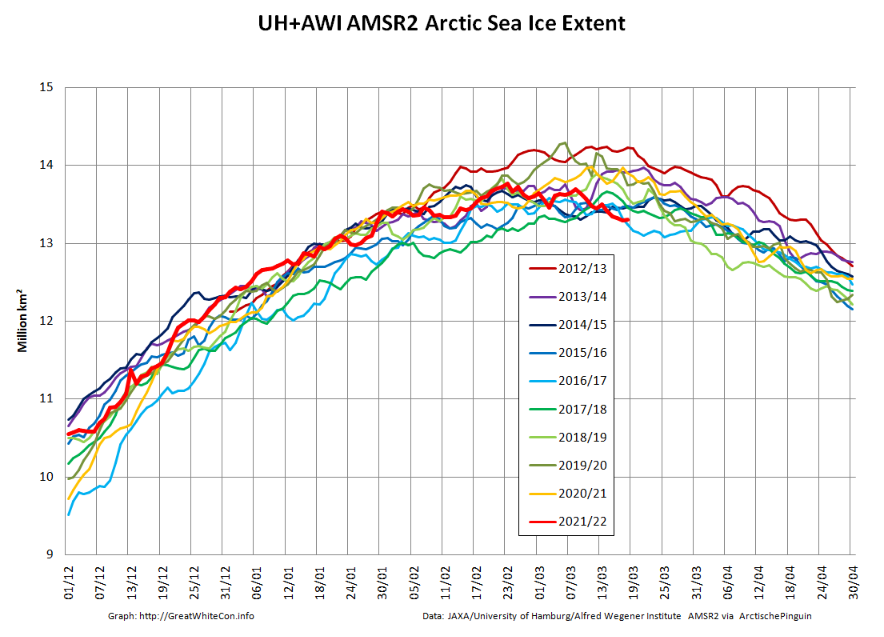
For detailed analysis of Arctic sea ice extent over the next few weeks please see the 2022 maximum extent thread. However to get the new open thread going here is the current JAXA/ViSHOP extent graph:
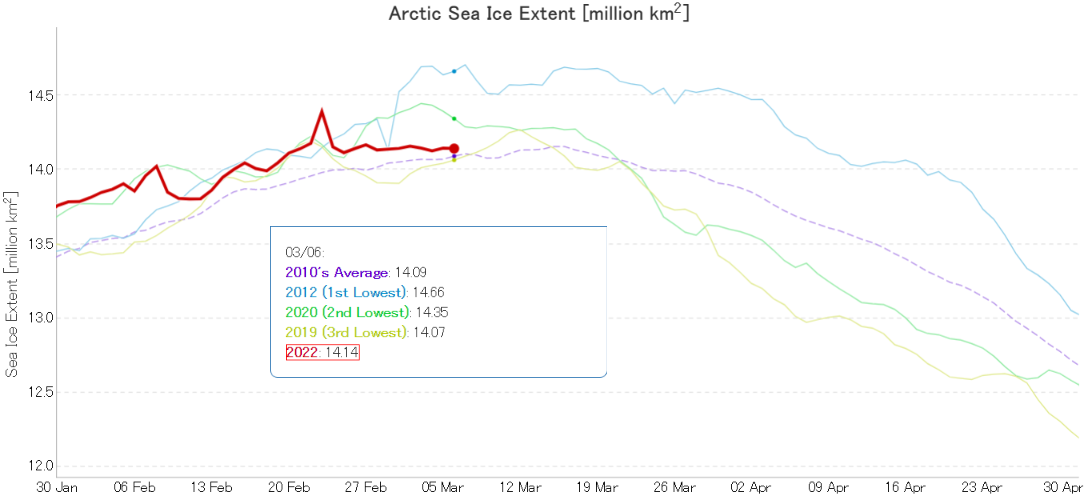
It’s looking more and more as though the real maximum for 2022 occurred close the false peak on February 23rd.
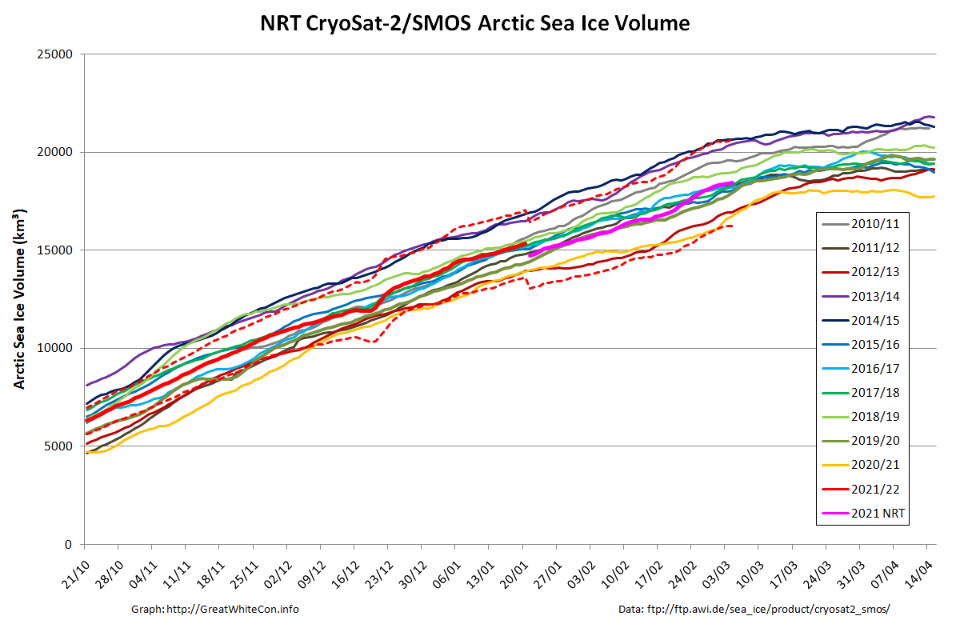
Arctic sea ice volume will keep increasing for a while longer. Here is the current AWI CryoSat-2/SMOS volume graph:
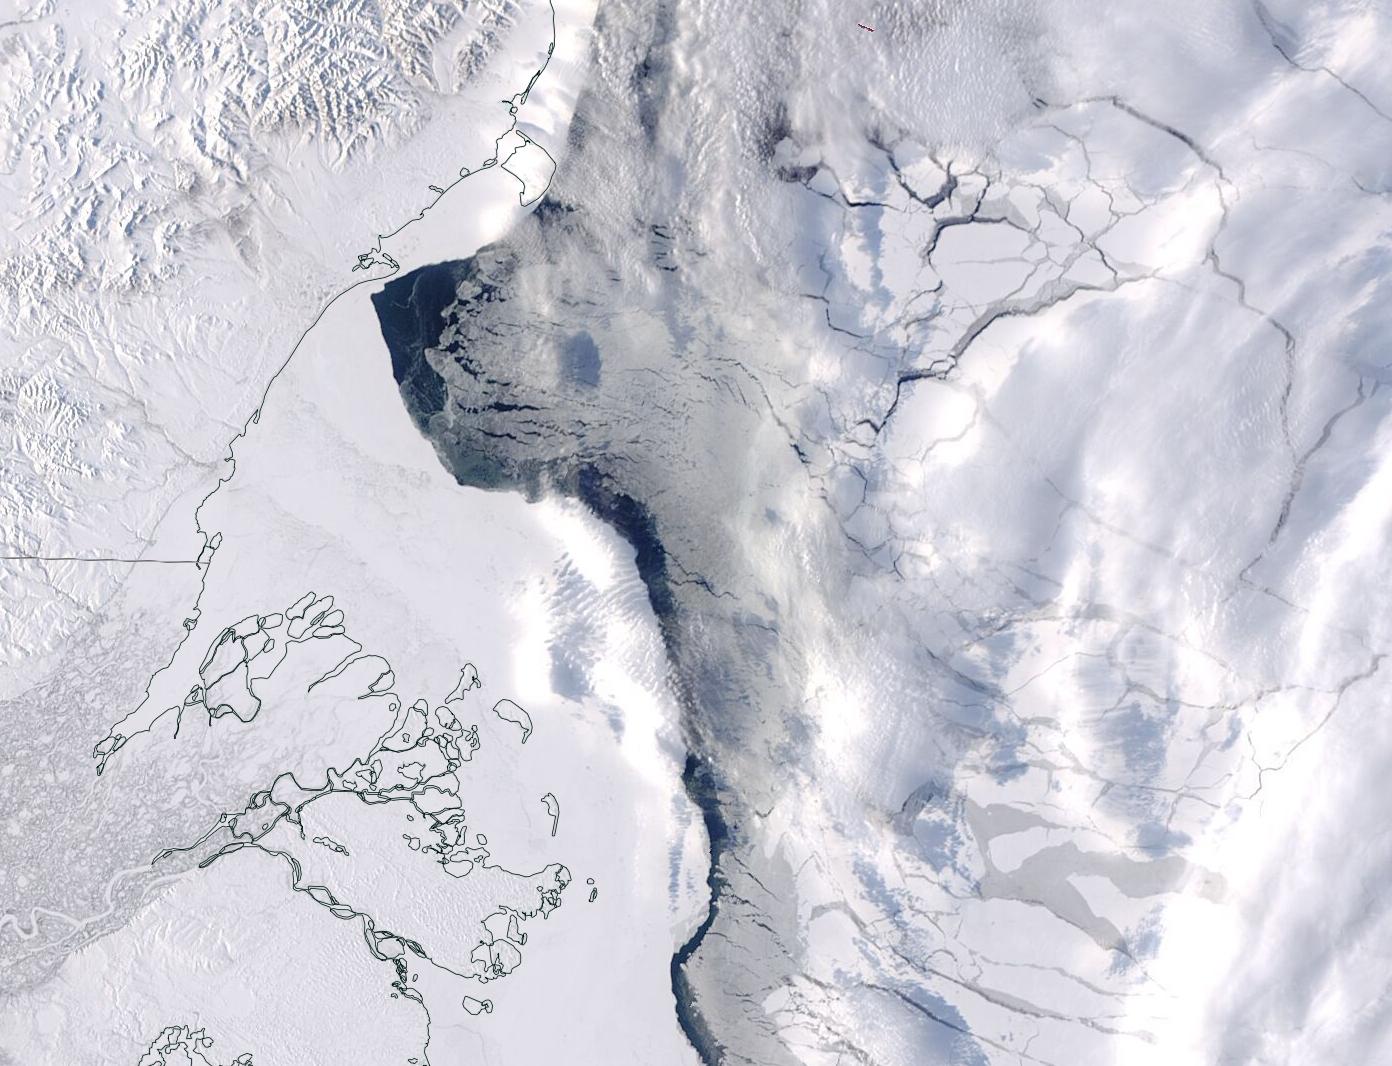
The recent “flat line” in extent is in part due to recent events on the Pacific periphery of the Arctic. Take a look at this animation of AMSR2 sea ice concentration:
The gap varies depending on how the wind blows, but there is still evidence of open water (or very thin ice) along the shore of the Beaufort and Chukchi Seas. Here’s the Mackenzie Delta and the adjacent Beaufort Sea on March 5th:
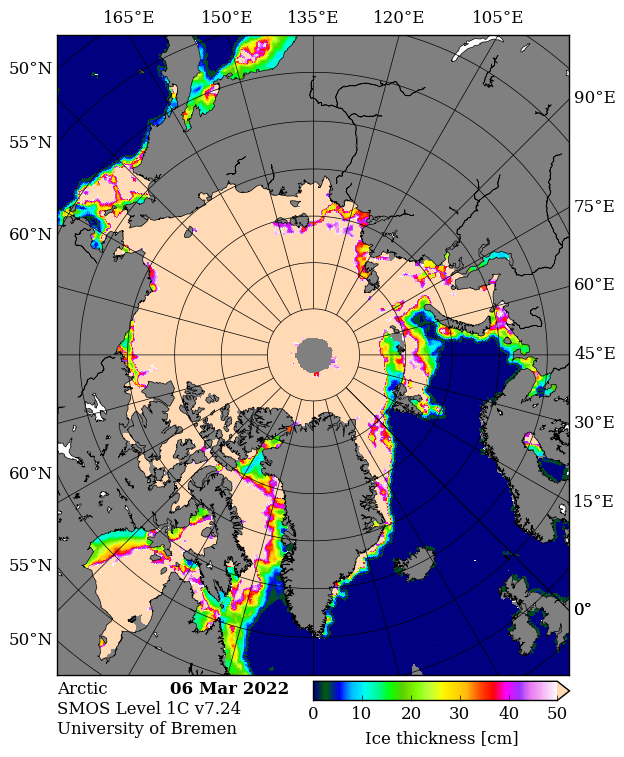
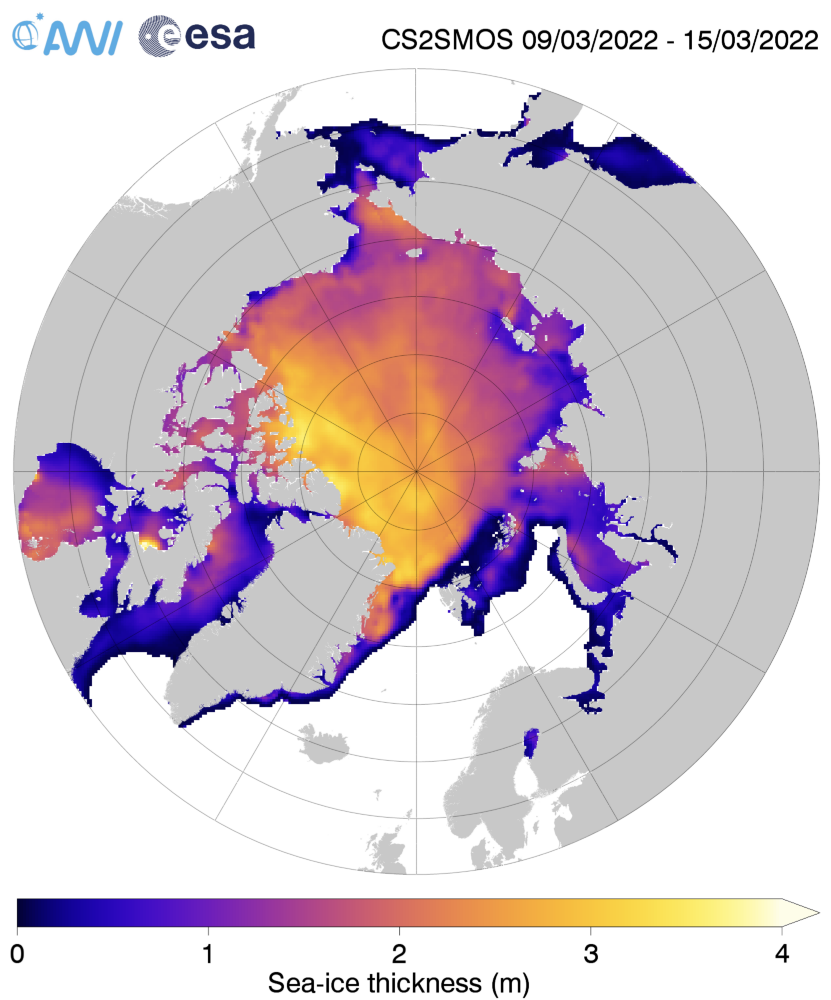
There’s plenty of thin ice elsewhere in the Arctic as well, as revealed by SMOS:
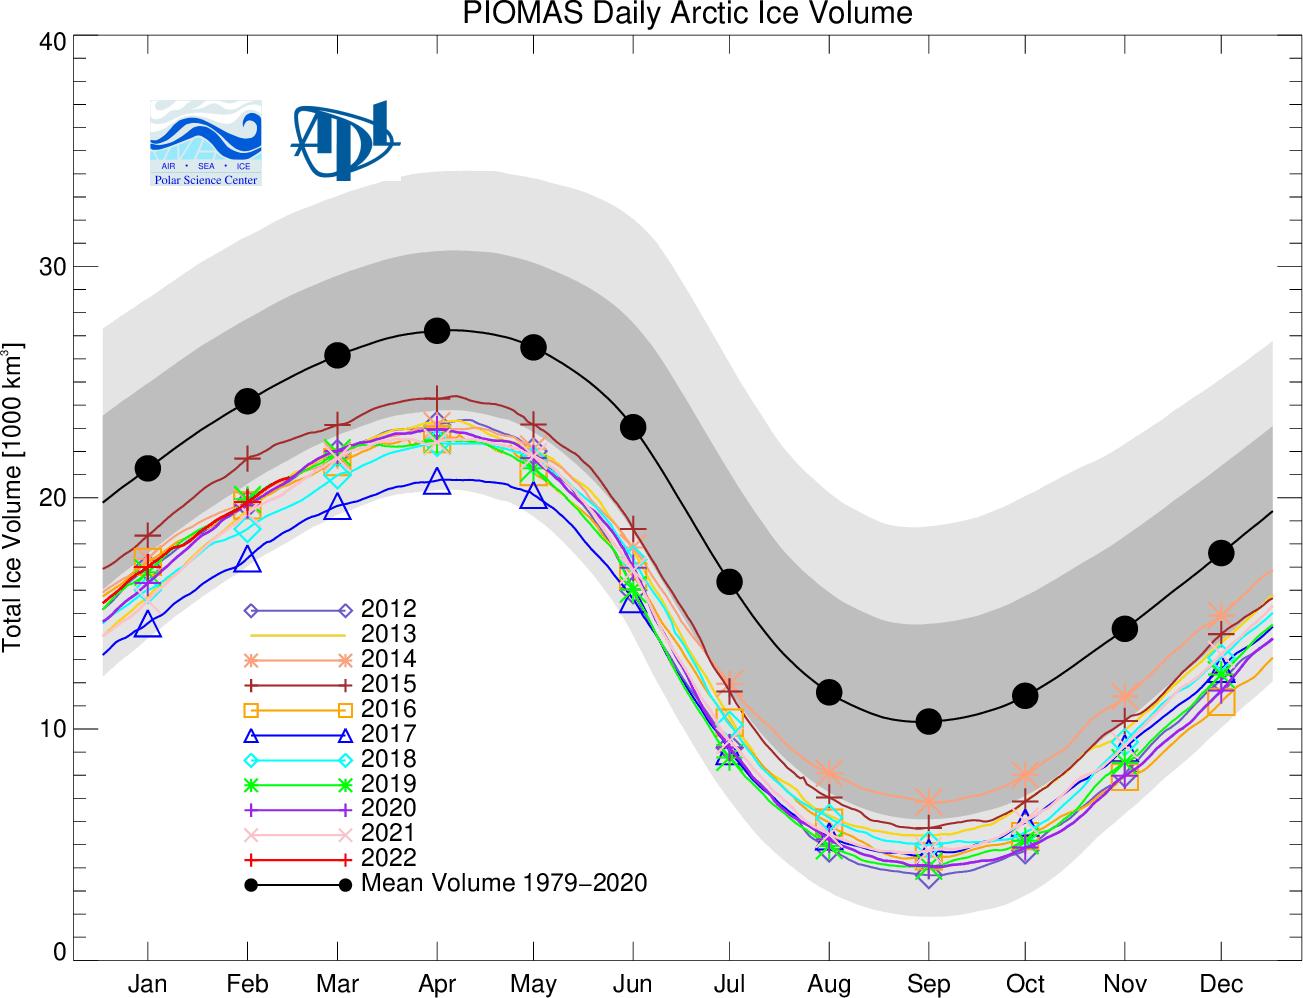
The Polar Science Center at the University of Washington has released the PIOMAS volume data for February 2022:
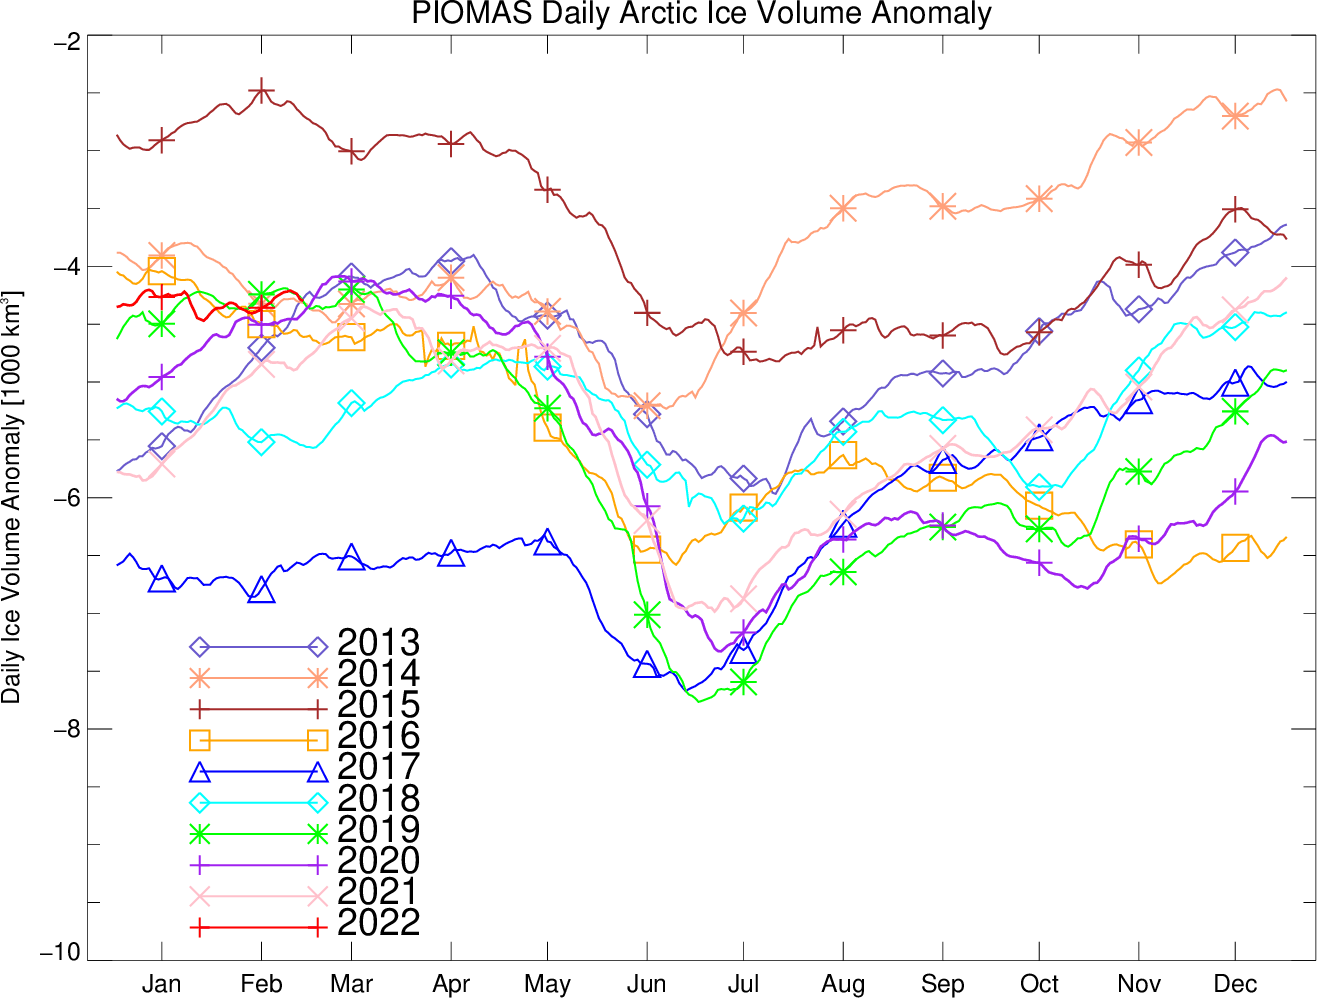
Average Arctic sea ice volume in February 2022 was 19,700 km3. This value is the 9th lowest on record for February, about 2,400 km^3 above the record set in 2017. Monthly ice volume was 35% below the maximum in 1979 and 18% below the mean value for 1979-2021. Average February 2022 ice volume was 1.25 standard deviations above the 1979-2021 trend line. Ice growth anomalies for February 2022 continued to be at the upper end of the most recent decade:
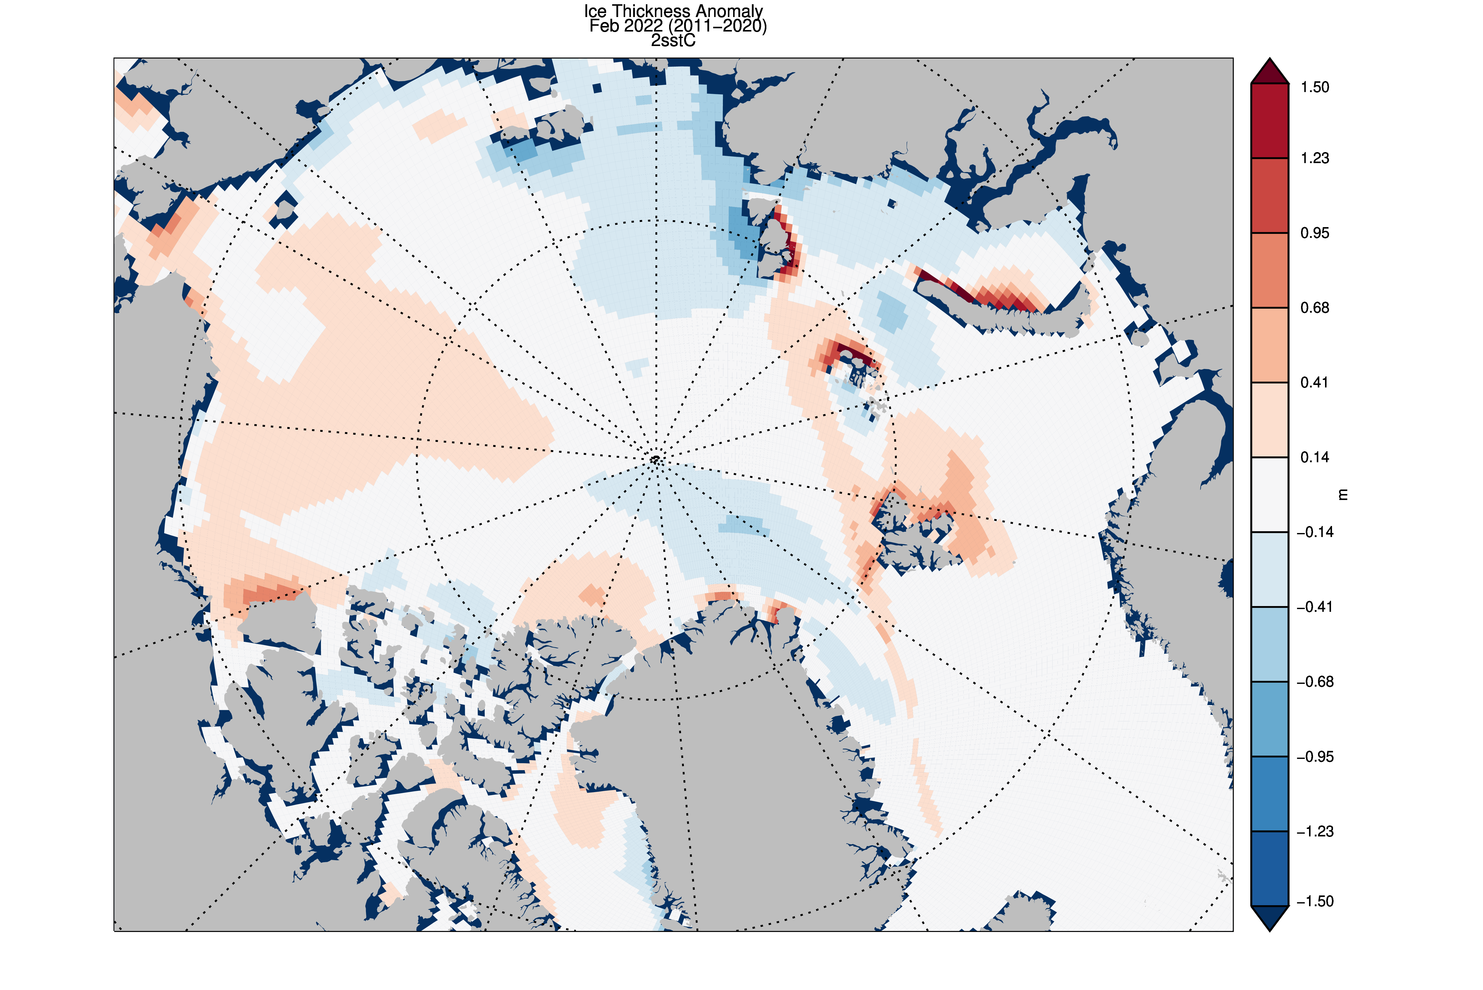
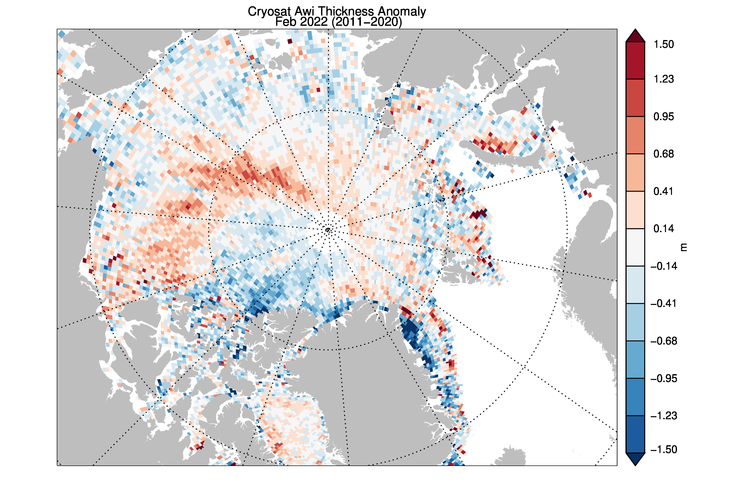
The ice thickness anomaly map for February 2022 relative to 2011-2020 shows positive anomalies in the Beaufort and Chukchi but negative anomalies in the Kara and Laptev Seas from. The negative anomalies that have been present North of Greenland are weakening and a positive anomaly exists north of Baffin Island:
CryoSat 2 ice thickness shows an overall similar pattern of sea ice thickness anomalies though the areas North of Greenland and Baffin Bay show substantial differences:
Here’s an interesting new paper on Arctic sea ice thickness, and hence volume, derived from both from both ICESat-2 and CryoSat-2 data:
“Arctic snow depth, ice thickness and volume from ICESat-2 and CryoSat-2: 2018-2021“
[Edit – March 12th]The measurement concept is based on differencing the freeboards from IS-2 (which measures the height of the air-snow interface above the local sea surface) and CS-2 (which measures the height of the snow-ice interface above the local sea surface)…
For the three years between 2019 and 2021, there is a decrease in both the mean April snow depth (~2.50cm) and ice thickness (~0.28m). Spatial composites of snow and ice thickness in 2019-20 and 2020-21 show notable thinning of both these variables in the MY-ice regions north of Greenland and the Canadian Arctic Archipelago. The thinning is higher over multiyear ice (compared to the first-year ice) with an end-of-season thickness in 2021 that is lower by ~16.1% (0.50m). Overall, thinning of the ice covers over the period are largely explained by decreases in MY-ice thickness and coverage. In contrast, variability in end-of-season FY-ice thickness (between 1.84 and 2.03 m) seems insignificant.
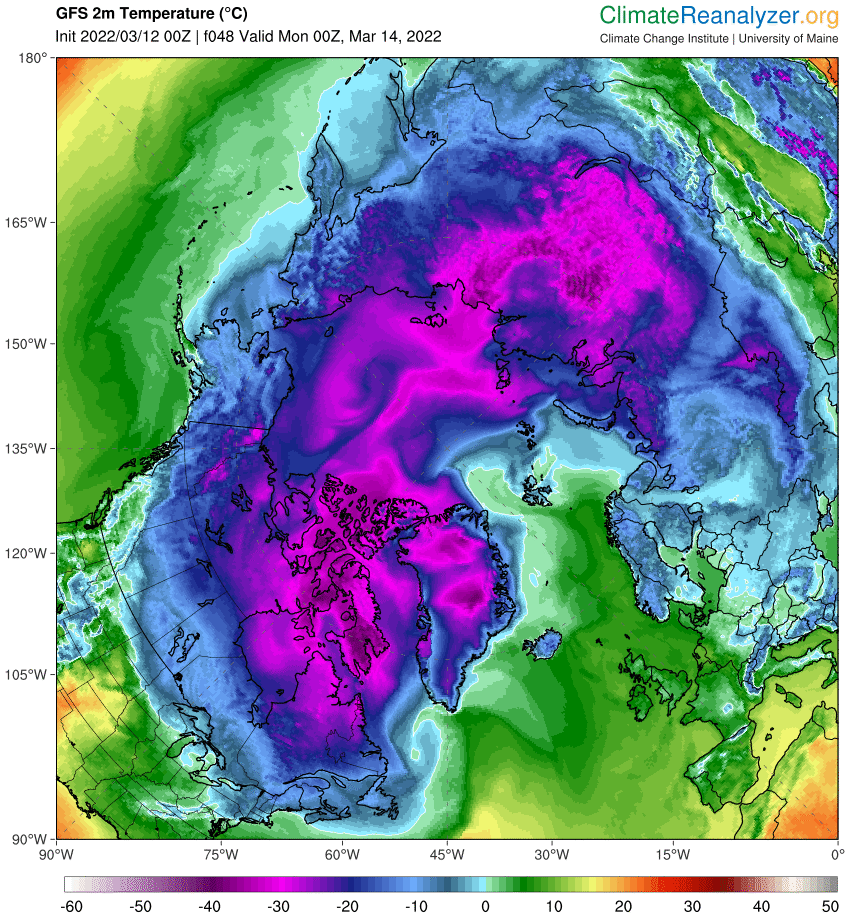
Some warm air is forecast to be heading for the North Pole via the Fram Strait by Monday morning:
A nice animation of recent Arctic sea ice movement from Lars Kaleschke of AWI:
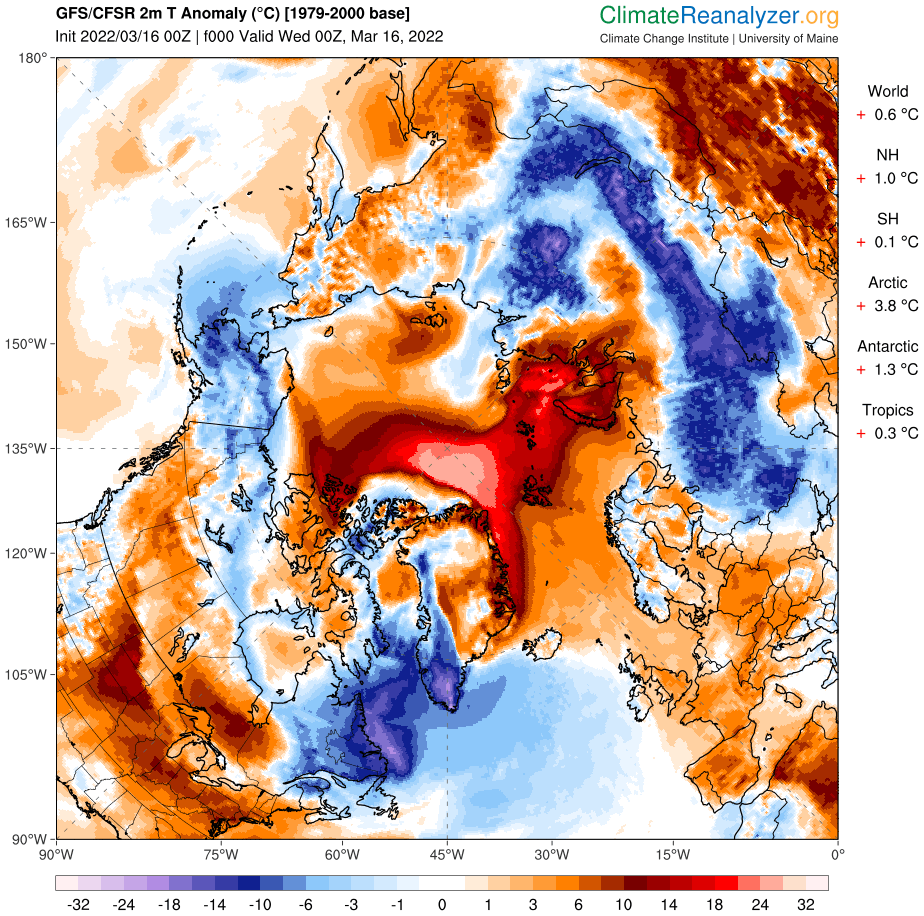
Plus Arctic surface temperature anomalies this morning:
Here’s the latest high resolution AMSR2 area, extent and compaction graphs:
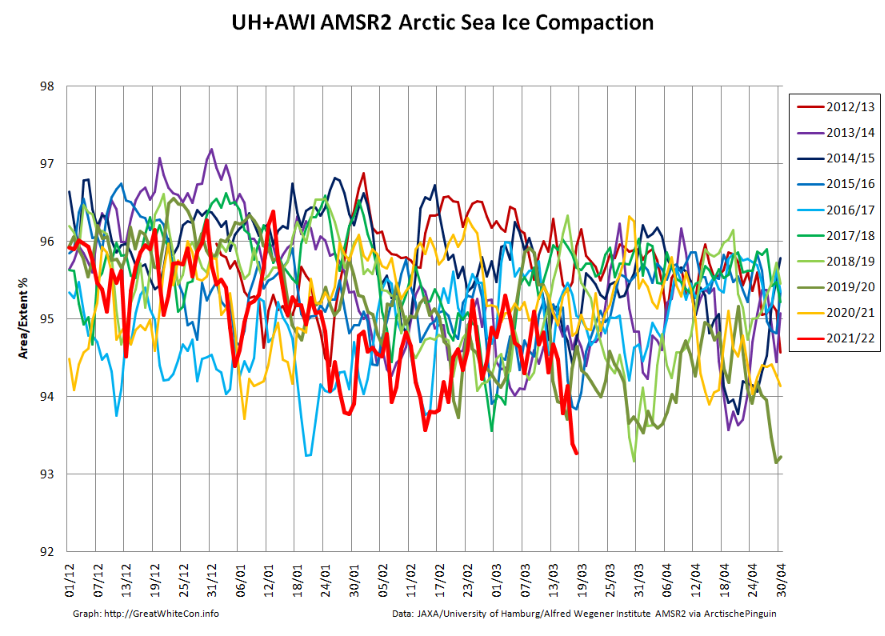
The recent storms and accompanying advection of heat and moisture have had a significant impact on sea ice extent and particularly area. Here too is the latest AWI CryoSat-2/SMOS sea ice thickness map:
and the AWI sea ice concentration/leads map:

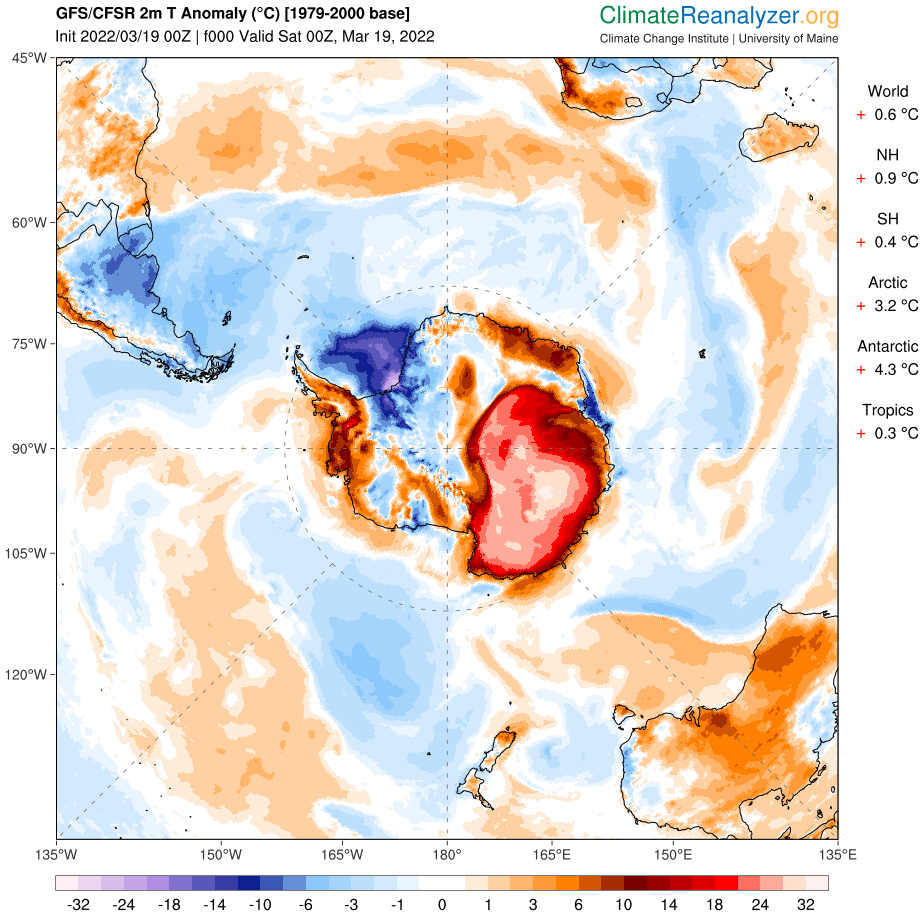
Here are today’s temperature anomalies up north:
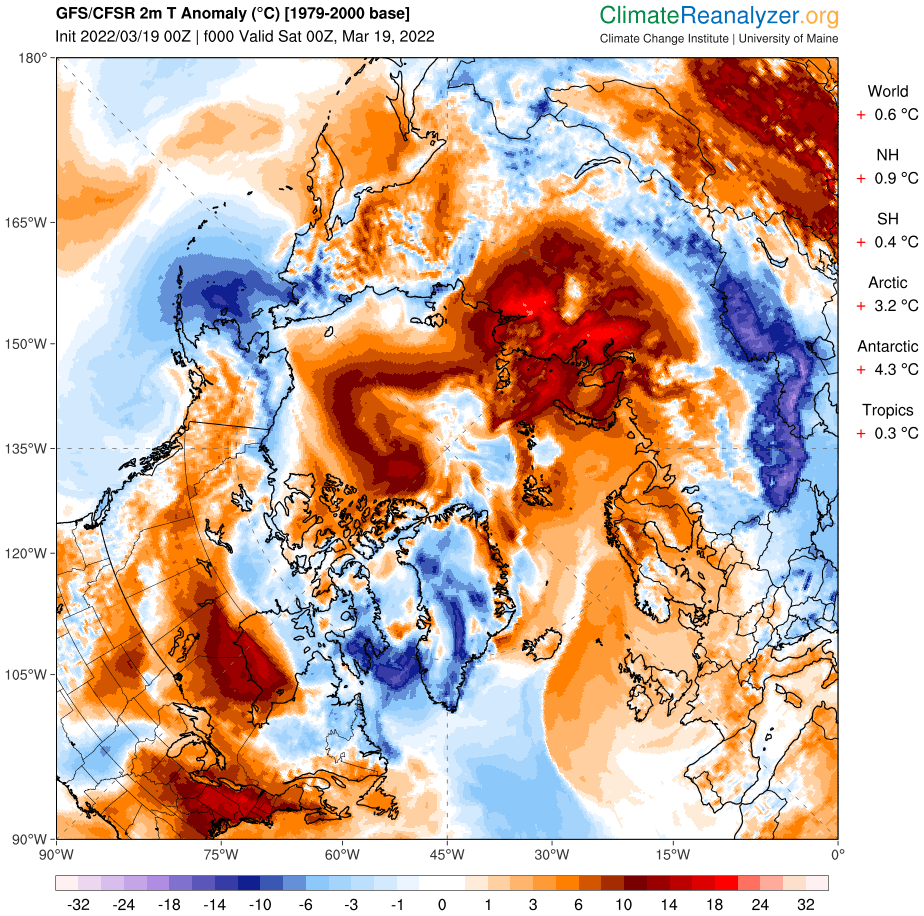
Meanwhile down under in the Antarctic some areas are over 32 °C warmer than “normal”:
Here is the latest AWI CryoSat-2/SMOS volume graph:
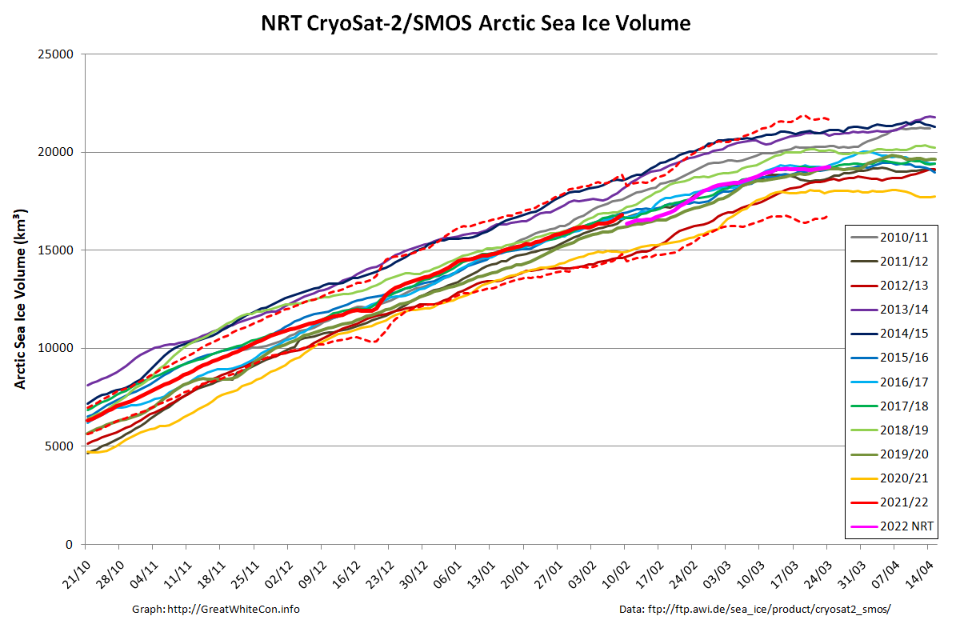
The balance between thickening of the sea ice in the central Arctic versus melting at the periphery has resulted in volume flatlining for the past couple of weeks.
Please see the new open thread for April.
Thanks for the PIOMAS update, Jim, but you missed the part about “…no trend for 11 years…” if memory serves, this is the fourth month in a row with no monthly trend for 11 years. I know ‘11 years doth not a climate make’, but any thoughts about why things seem to have stalled on both extent and volume?
Somebody else has noticed the warm air over the Fram Strait at the moment:
Here’s more on the current HALO-(AC)³ campaign:
The quote is one sided wrt to sea ice. An increase in warm/moist intrusions in winter would likely bring more snow, and from the NSIDC,
“Snow has an even higher albedo than sea ice, and so thick sea ice covered with snow reflects as much as 90 percent of the incoming solar radiation. This serves to insulate the sea ice, maintaining cold temperatures and delaying ice melt in the summer.”
And while cloudier skies in winter promote warming, they have the opposite effect in summer (cloudier in summer as more open water and ponding result in more surface area available for evaporation). So as usual, there’s a confusing battle between positive and negative feedbacks. Well stated here,
“Indeed, Arctic precipitation depends on global processes, like the moisture transport from midlatitudes, and local processes, such as evaporation associated with sea ice retreat. Precipitation, and specifically snow, responds to environmental changes that may later impact Arctic climate. These interactions result in different feedbacks, leading to indistinct impacts that are difficult to disentangle.”
https://journals.ametsoc.org/view/journals/clim/33/6/jcli-d-19-0105.1.xml
“Arctic amplification might cause a weaker jet stream,…”
Or it might not. A recent study finds that the northern hemisphere jet steam has been getting stronger, not weaker, although the trend varies by location and season,
“Jet speed shows significant increases evident in winter (up to 4.7 ms−1), spring and autumn over the North Atlantic, Eurasia and North America however, over the North Pacific no increase is observed. Long term trends are generally overlaid by multidecadal variability….”
https://link.springer.com/article/10.1007/s00382-022-06185-5
Yes, along with that big incursion of ‘warmer’ air came a big spike in Greenland Surface Mass Balance, a sure sign of lots of snow there and (presumably) over other parts of the Arctic ice sheet. Greenland SMB is now slightly ahead of ‘normal’ (1981-2010) for this time of year at over 400 Gigatons. So yes, I would expect that to affect albedo at this somewhat critical time of year.
And of course it’s worth remembering that while this is referred to as the start of ‘melting season’, that’s only with respect to ice edges and extent. Net ice volume will continue to grow (more freezing than melting) for the next month and a half or so until the May peak. And of course, Greenland will continue to grow the SMB until June.
I think the NSIDC snippet I quoted above should have mentioned that snow has the opposite effect in winter, when the air temperature is roughly 50 – 80 degrees F colder than the water beneath the ice. In this case the snow layer, a great insulator, plays an important role in preventing heat loss and slowing the formation of ice.
Anyway, it’s not clear to me what the net result is with regards to volume or extent. Does snow have a bigger effect in winter, slowing the formation of ice, or in summer, slowing the melt?
Probably depends on timing. For example a November snowstorm would help slow ice formation for many months, while an April snowstorm would mostly delay the melt.
That seems like a reasonable analysis to me.
This year is the boe
As I mentioned elsewhere:
Temperatures across the Arctic this morning (UTC):
With the assistance of Ruth Mottram, here’s what happened to the temperature at Kap Morris Jesup on March 15th.
A rise in temperature of ~23 °C in 3 hours, to the merest smidgen under 0 °C.
The NSIDC have finally called the 2022 maximum extent. More at:
https://GreatWhiteCon.info/2022/02/the-2022-maximum-arctic-sea-ice-extent/#Mar-24
Thank goodness, holding my breath since late February was leaving me a bit dizzy… As I think you pointed out, had their data been a bit cleaner, it might have been resolved a bit earlier.
Jim, what’s happening up in the Arctic? I note that both NSIDC and their cousin MASIE, are showing an uptick in extent, and DMI shows a renewed growth in volume.
I’m not sure where AWI is on volume, but all in all, looks like March will close in relatively unremarkable fashion. What’s your take?
Well, here we are April 1, at one of my favorite times of the year, when ice is both shrinking in extent and growing in thickness and volume. Per DMI thickness charts, it’s finally possible to walk from Siberia to continental Arctic Canada on 3 meter ice, one of my favorite metrics, and not available every year. We’ll see how long that phenomenon lasts…
Jim,
Not sure when an April post will appear, but I thought I’d close out my observations on March to note that both NSIDC and PIOMAS saw it as a rather unremarkable month. PIOMAS reports, for what I think is the sixth month in a row, that the Arctic volume numbers ‘show no trend for the past 11 years’. Volumes are seriously into the 2nd standard deviation from the long-term trend. Their only explanation is short-term variability.
At what point do you think they will need to do some research on the sources of that ‘natural variability? In particular, how much of the previous period of decline in volume do they attribute to ‘natural variability’?
The April “open thread” has now appeared!
March may have been a “rather unremarkable month” as far as extent goes, but note the unusual mean temperature and pressure patterns for the month highlighted by the NSIDC. Note also the “positive [volume] anomalies in the ‘Western Arctic’ but negative anomalies in ‘Eastern Arctic'” mentioned by the PSC.
As you may recall, by my reckoning PSC researchers explained the ‘natural variability’ you refer to in advance:
https://GreatWhiteCon.info/2022/02/facts-about-the-arctic-in-february-2022/#comment-544708
See also Armour et al. (2011):
https://GreatWhiteCon.info/2021/10/facts-about-the-arctic-in-october-2021/