Following the “Great Arctic Winter Cyclone” towards the end of January, here are the latest high resolution AMSR2 area and extent graphs:
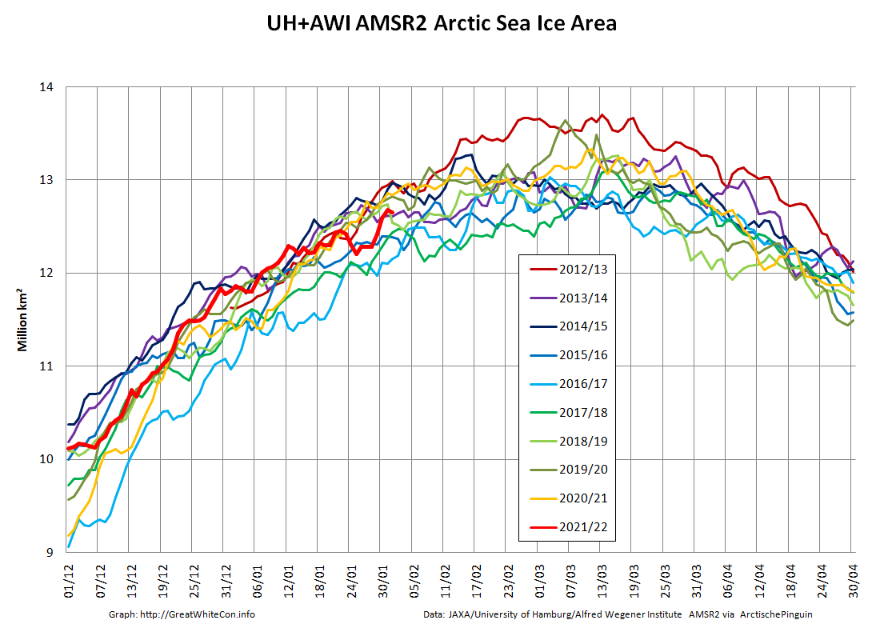
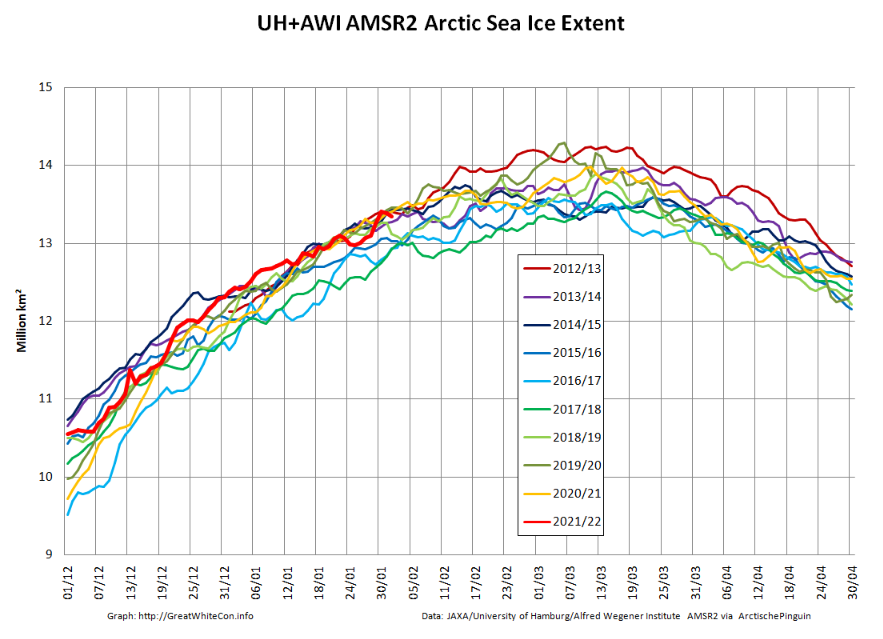
The sudden reduction in sea ice area due to the cyclone is very apparent, as is the subsequent refreeze of the affected area. Here’s an animation of AMSR2 concentration revealing more detail:
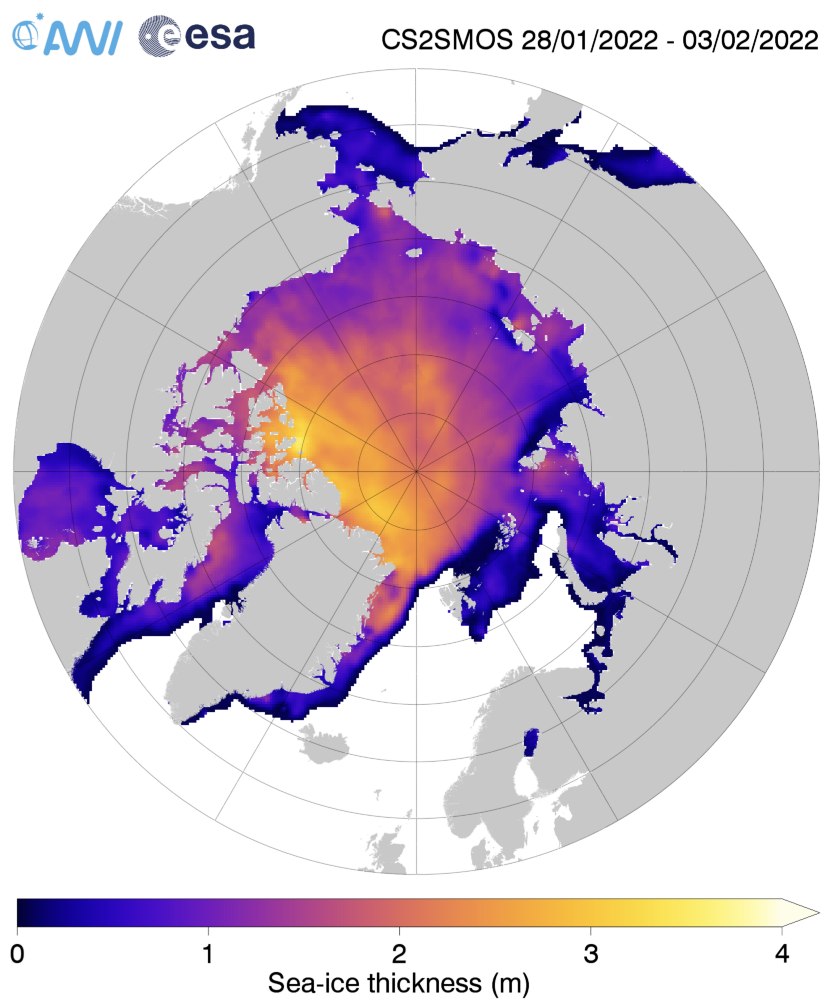
Here too is the latest AWI CryoSat-2/SMOS Arctic sea ice volume graph:
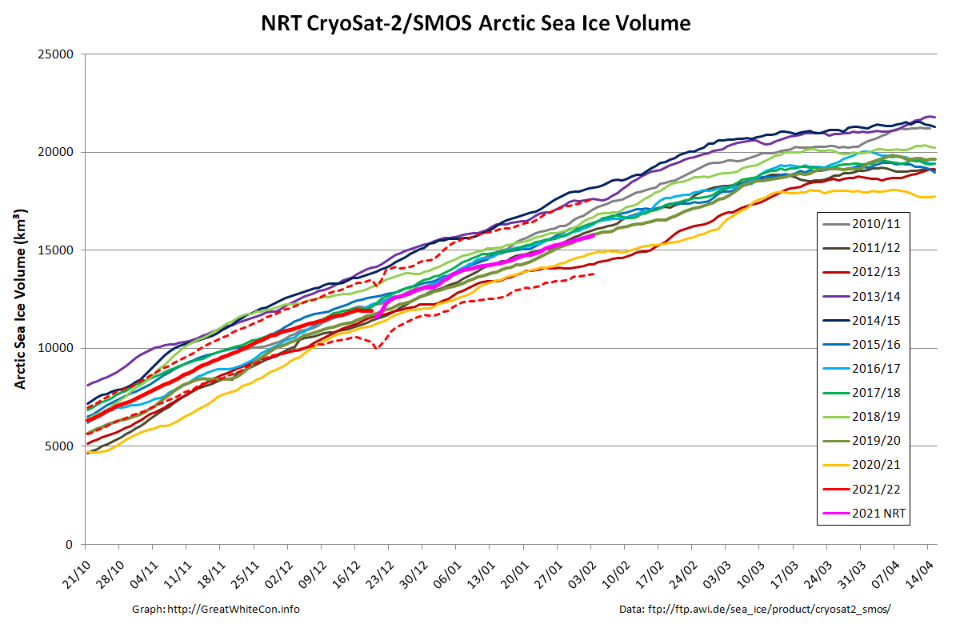
It doesn’t reveal a similar “blip” towards the end of January, suggesting that reduction in area was due to compaction rather than melt. The current AWI thickness map shows the freshly formed ice north east of Svalbard is still very thin:
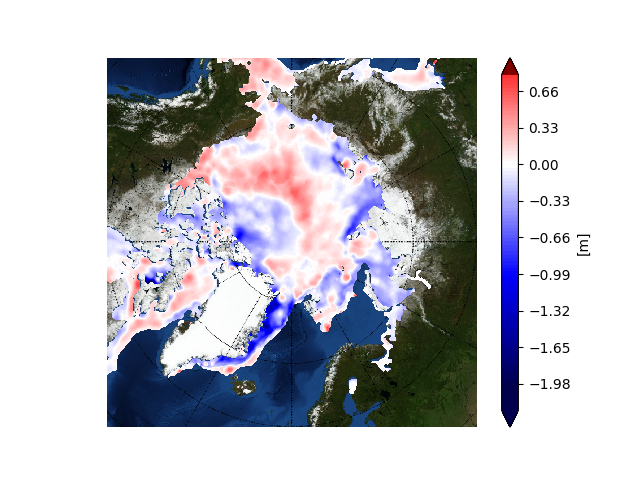
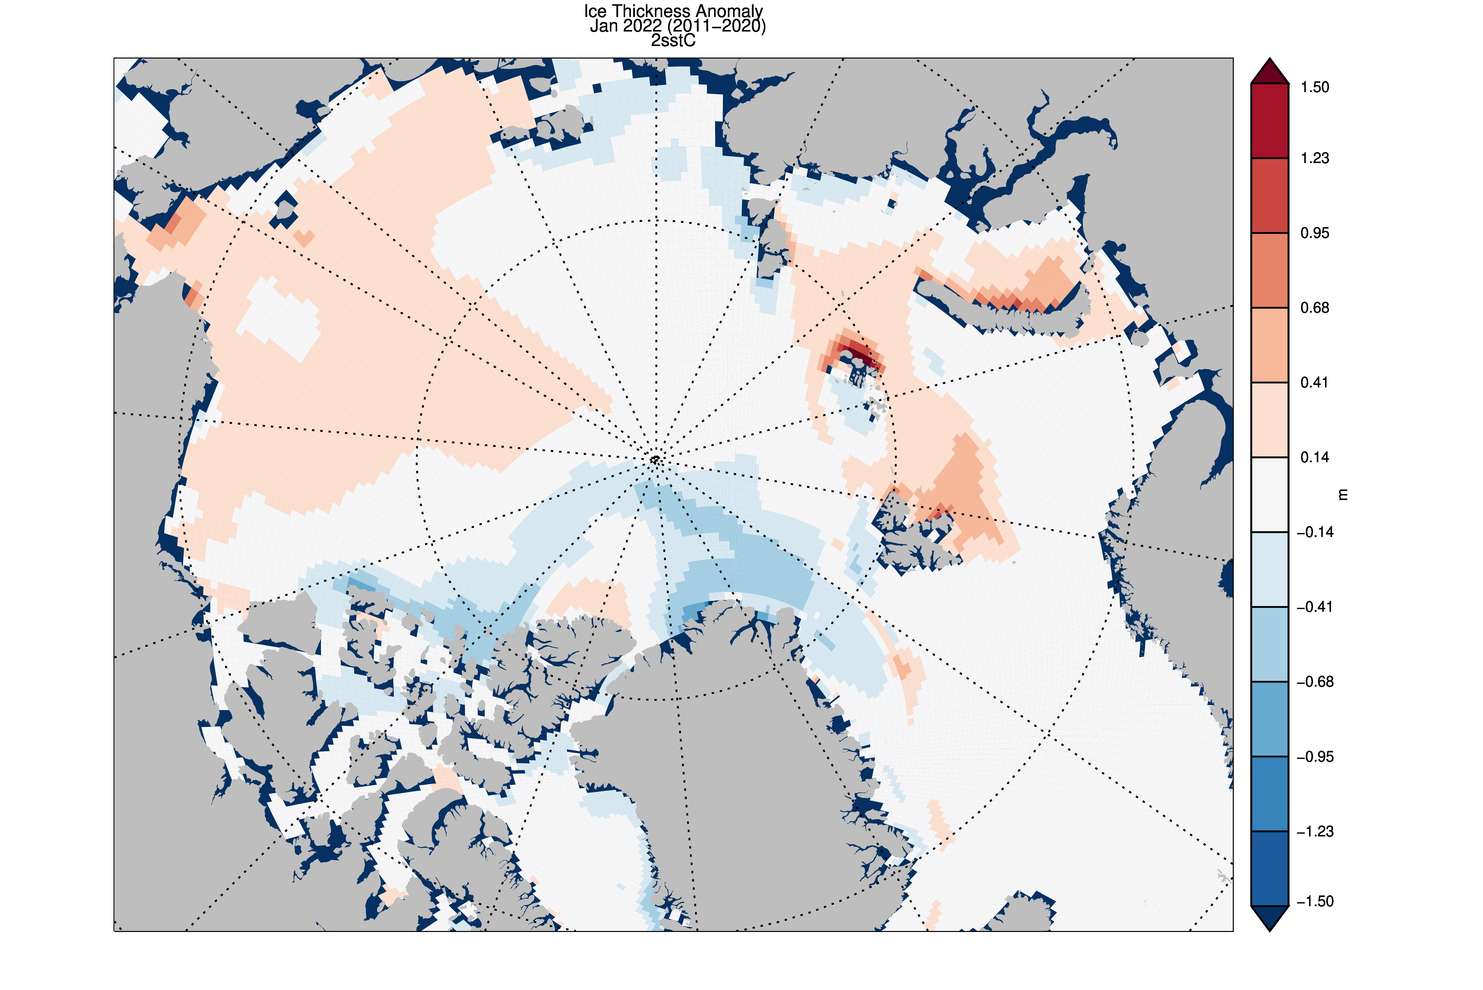
The latest thickness anomaly map from the Finnish Meteorological Institute shows that the ice which was exported from the Central Arctic via the Fram Strait is nevertheless still anomalously thin, although there is now an area of thicker ice north of Greenland:
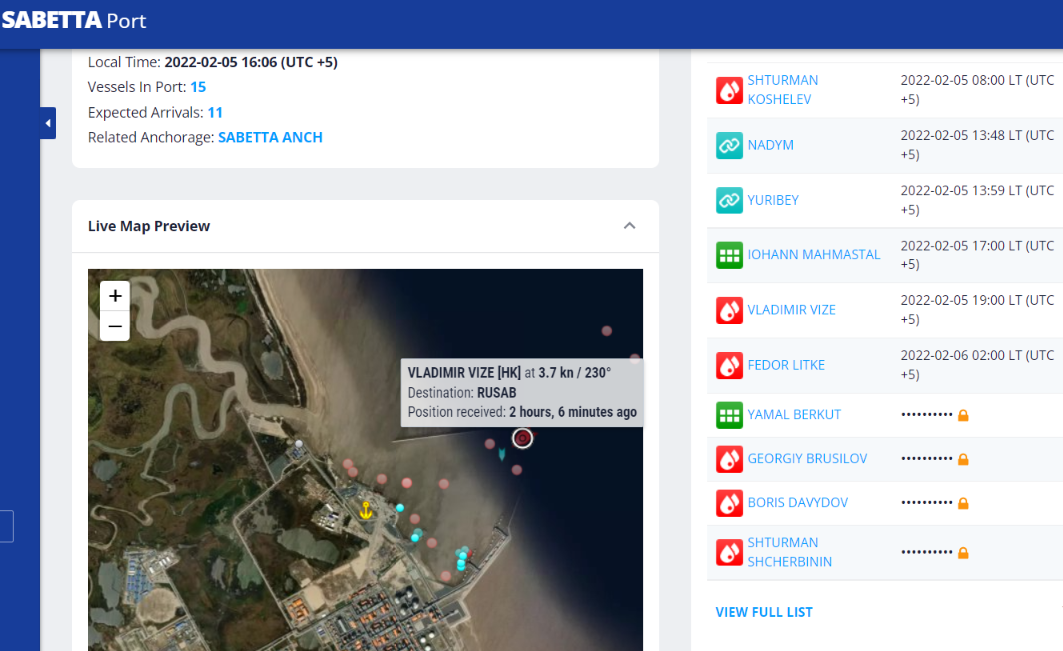
In other news Valdimir Vize has arrived at Sabetta after successfully negotiating the Northern Sea Route without icebreaker accompaniment:
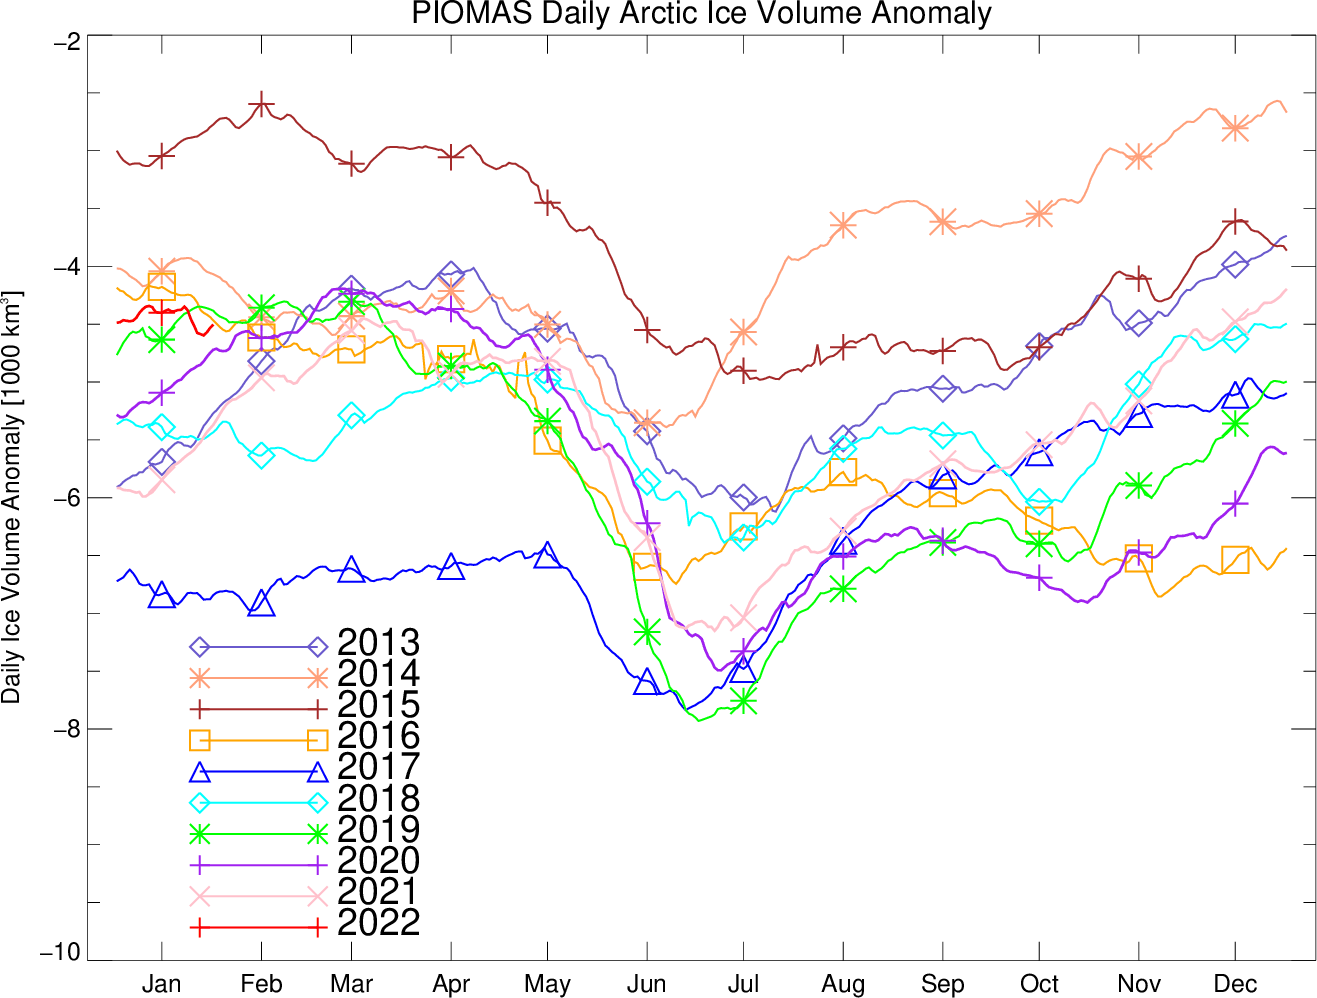
The Polar Science Center at the University of Washington has released the PIOMAS volume data for January 2022:
Average Arctic sea ice volume in January 2022 was 17,000 km3. This value is the 9th lowest on record for January, about 2,400 km3 above the record set in 2017. Monthly ice volume was 39% below the maximum in 1979 and 20% below the mean value for 1979-2021. Average January 2022 ice volume was 1.4 standard deviations above the 1979-2021 trend line.

Once again the thickness anomaly map is broadly similar to the CryoSat-2 equivalent, albeit without the positive anomaly just north of Greenland:
Please see the new open thread for March.
The heavy load carrier Audax is currently heading west through the Vilkitsky Strait, accompanied by the nuclear powered icebreaker Yamal:
Thanks for posting the PIOMAS update. I note with interest that they said, for I think 3 months running, that there is ‘no apparent trend in the past 11 years’. Based on other sources’ daily growth modeling, I’m going to guess that will be true for February as well. And given the recent rebound in extent (even laggard JAXA has now cracked 14M), I’m thinking that my 15M NSIDC extent prediction is looking probable. All in all, I think the 2021-22 season is going to be unremarkable for something more than the last decade.
Hopefully in 2022 we’ll see more papers on the natural forces governing polar ice metrics, and fewer on the ‘evil molecule’.
Isn’t man a natural force ?
Mankind is certainly a force that affects climate. Land clearing, concrete-making, even large scale erection of wind turbines (slowing down or redirecting wind forces) must have some effect, and there’s always CO2 release. The growth of human population, most of whom don’t want to starve or freeze, must have an effect as well. I consider those as different from ‘natural’ forces, such as the AMOC, volcanos, meteors, solar cycles. The big question has always been the relative influence of each, and the interactions between them. In general I call for more research on those questions and less doomsaying designed to frighten children for political purposes.
For example, is the greening of the Sahel caused by ‘man-made’ CO2, and if so, what effect does that have on African (or world-wide) climate? Does it really matter to the climate in areas where people live, that the Arctic is averaging -20C vs. -25C, even though that is being decried as ‘five degrees above normal’ and ‘the hottest ever’? In the non-linear, chaotic climate system in which we live, how can anyone know the real effects of what we do to the planet? Why aren’t we more afraid of tipping into an Ice Age than into a Climate Optimum?
Those are some of the questions I’d like to understand better, and I visit sites like this (and many others) seeking answers, or at least ideas about answers.
Quite agree Taylor. The one to watch is the Atlantic Multidecadal Oscillation. It should move into its negative phase over the next few years. Then we might see some sea ice recovery in the Arctic.
I’ve been hearing that tall tale for the last decade and more Neil.
Can you and/or Taylor by any chance point me to any academic journal articles to support your suggestion?
Have you by any chance read Bitz & Roe yet? If so, what did you make of it?
My pleasure Taylor!
However you still seem to be neglecting the fact that the “slow transition” to the (mythical?) “blue ocean event” was “predicted” in the academic literature many moons ago?
Here once again is your starter for 10, freely downloadable from the University of Washington web site. Bitz & Roe (2004):
https://atmos.washington.edu/~bitz/Bitz_and_Roe_preprint.pdf
Interesting paper, although getting a bit dated, given its reliance on very early models/simulations, and without benefit of some 20 years of new data. I note with some interest that Dr Mann now publicly regrets ‘inventing’ the AMO idea. However, not everyone agrees that ocean circulation and warming don’t affect the climate vs. our favorite molecule. Here’s a bit more recent one:
https://www.psl.noaa.gov/people/gilbert.p.compo/CompoSardeshmukh2007a.pdf
Here’s some additional data, correlating the AMO with several long-running Icelandic temperature stations:
The AMO and North Atlantic Temperatures
The AMO affects regional temperatures in the Arctic area of the northern Atlantic. The following figure shows the temperature anomalies for the only 2 long-term stations in Iceland (from the NOAA GHCN database). Temperatures are recently approaching those observed in the 1930’s. The next figure compares the Iceland temperatures with the AMO shown previously. There is a strong correlation between the two.
Sorry, I’m not sure how to post the actual graphics, so just put in the links. Hopefully you can fix that.
[Graphs embedded – Mod]
But where is the correlation (or whatever) between sea ice area and/or volume and the AMO?
Iceland is a long way from the ice edge these days.
Now show us the time series for those two locations, but on an identical planet where CO2 has remained at 280 ppm.
https://www.scribbr.com/methodology/control-group/
Point being –
even with a strong AMO correlation, both the high and low anomalies in the temperature graph may have been much cooler had global emissions remained at preindustrial levels.
From my link –
“In a scientific study, a control group is used to establish a cause-and-effect relationship by isolating the effect of an independent variable.
Researchers change the independent variable in the treatment group and keep it constant in the control group. Then they compare the results of these groups.
Using a control group means that any change in the dependent variable can be attributed to the independent variable.”
Again, lacking a control group, in this case an identical planet to earth except still at preindustrial CO2 concentrations, it’s an unending struggle to separate and quantify natural variation from anthropogenic.
Snape: obviously, a ‘control group’ planet would be handy to actually measure the delta between high and low CO2 effects on temperature cycles and natural variation. On the other hand, CO2 averaged much lower during the last 14,000 years or so, yet our planets ‘average’ temperature varied far more widely during that period (including the Younger Dyras and the Minoan and Roman warming periods. Most recently, consider the peak of the Medieval Warming Period and depth of the Little Ice Age. So what do you think caused all those swings, since it wasn’t CO2?
Taylor,
regardless of cause, the Younger Dryas may not have been quite so cold had CO2 concentrations been at 420 ppm. The Minoan, Roman, and Medieval Warm Periods may have been even warmer.
Jim, I note that you include several phrases in your post above that are in quotes. While it appears that you think those are significant, they aren’t quotes from me, and I don’t see them in your posts either. Can you point me to the source(s), so that I may better understand your meaning and respond?
I’m afraid you’ve lost me Taylor. The section highlighted in blue is a quote from the PIOMAS page, and that’s about it on the “quote” front.
Did your comment somehow appear under the wrong article?
I was referring to your post that includes the phrase ‘blue ocean event’
Aha! Strictly speaking a “comment”
“slow transition” – https://forum.arctic-sea-ice.net/index.php/topic,933.0.html
“blue ocean event” – https://en.wikipedia.org/wiki/Arctic_sea_ice_decline#Ice-free_summer
Jim, re ‘Blue ocean event’: now I get your comment. However, as I’m sure you noticed from the Wikipedia article you linked, speculation about the timing of that event has been the graveyard of climate prediction for several decades now, with not only poor professor Wadham failing, but the likes of Maslowski and Anderson getting sucked into the maelstrom of doom as well.
Looks like the latest AR predictions fall mostly into the mid-century period, restoring a bit of sanity, but even those require the equivalent of RCP8.5, so not credible either. Alas, I’m afraid the Blue Ocean Event will turn out to be mythological, but it does make a nice story to frighten the kiddies into giving up their lunch money…
Jim: ‘Iceland is a long way from the ice edge…’ Given that the Denmark Strait is less than 300km wide, and the ice edge is currently halfway between Greenland and Iceland, I’d say Iceland is less than 150km from the ‘edge’ and was much closer earlier this season. If you were looking strictly north, maybe so, but there’s a lot of sea ice south of Iceland as well.
I was referring to the ice edge in the “far North Atlantic”. Not in the Irminger Sea, which is continuously refreshed via the Fram Strait.
The position of the sea ice extent above the lowest ever recorded rose from 7th lowest in January 2021 to 16th lowest in January 2022.
Jan.31st 2021 7th lowest +79,452 sq.km. above 2010’s average
Jan,31st.2022 16th lowesr +333,064 sq.km. above 2010’s average
Feb.22nd 2021 3rd lowest -204,124 sq.km. below 2010’s average
Feb.22nd.2022 13th lowest +220,684 sq.km. above 2010’s average
In 2021 there was a rapid decline in sea ice extent through the month of February.
The sea ice extent has exceeded the 2010’s average for seven consecutive months since August 2021.
Will this trend continue throughout 2022?
Extent at maximum has no bearing on minimum, simply because a higher maximum means more widespread ice in the peripheral seas, which always melt before minimum
Nice point!!
If CO2 averaged much lower over the last 14000 years or so then how does anyone know this? Let alone the planets average temperature??