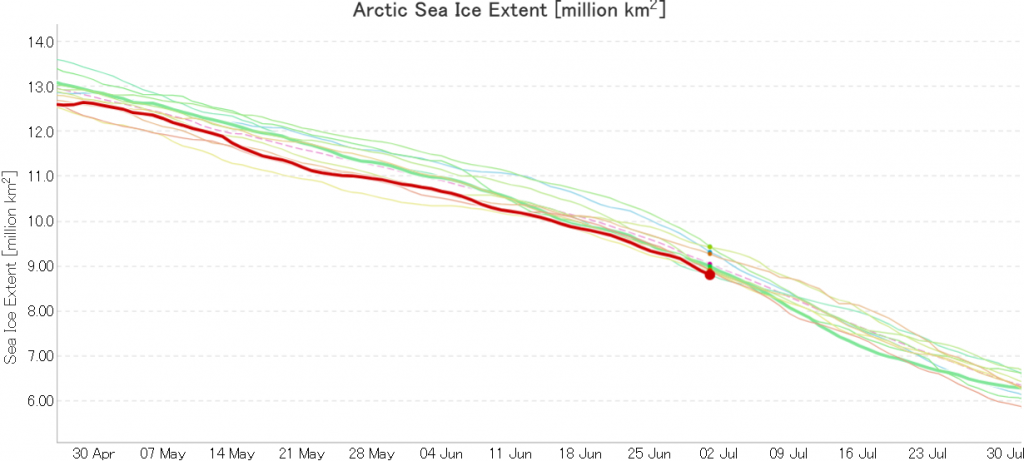
The new month starts with JAXA extent “lowest for the date in the satellite record” by a whisker:
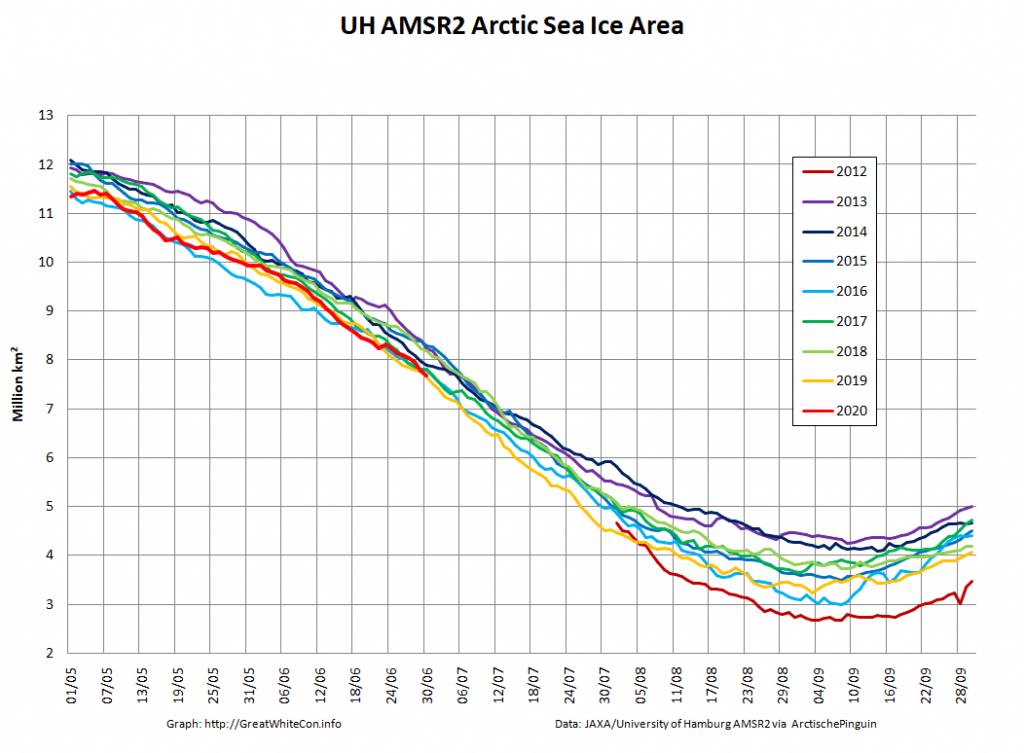
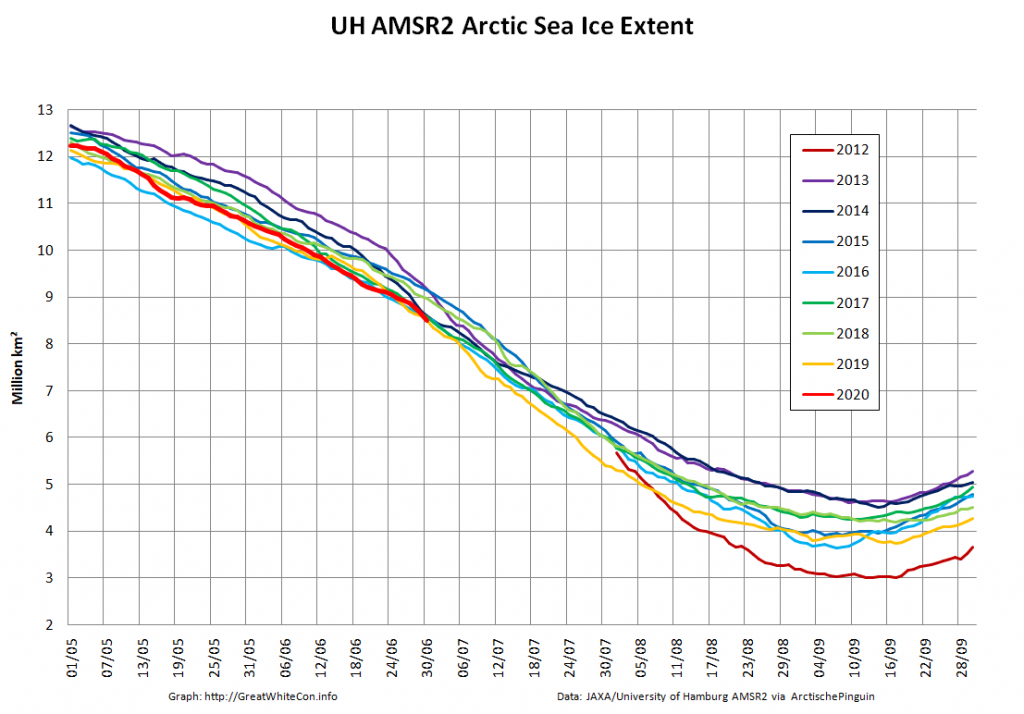
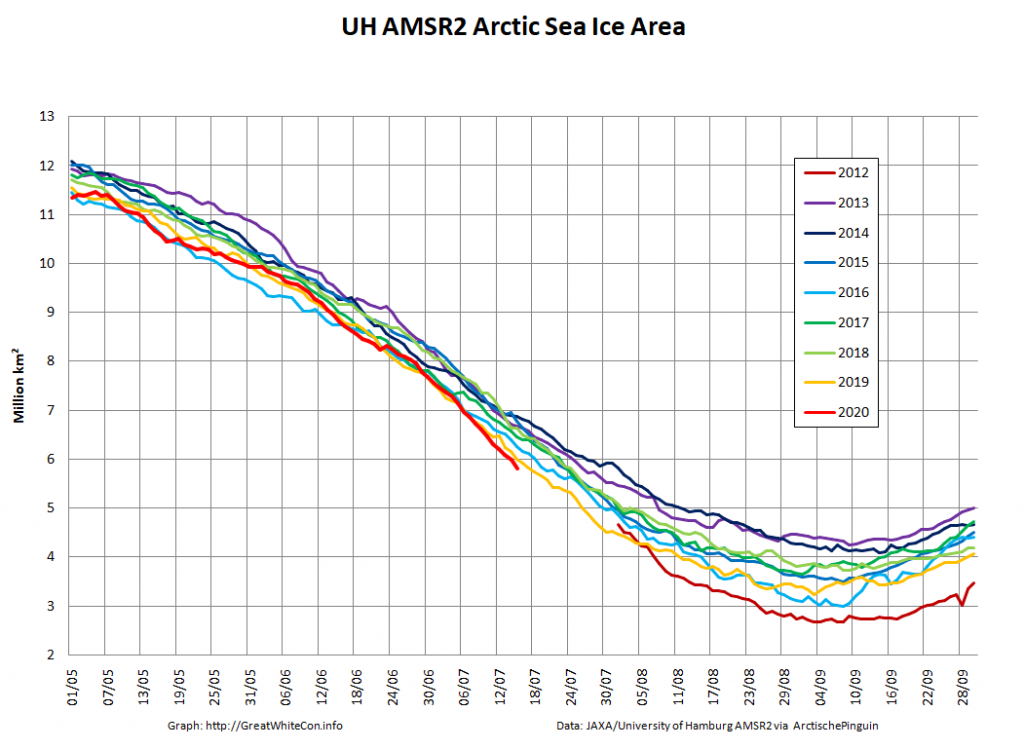
The high resolution Arctic sea ice area and extent graphs based on the University of Hamburg’s AMSR2 concentration data are also in “statistical ties” for that honour, in records going back to 2013:
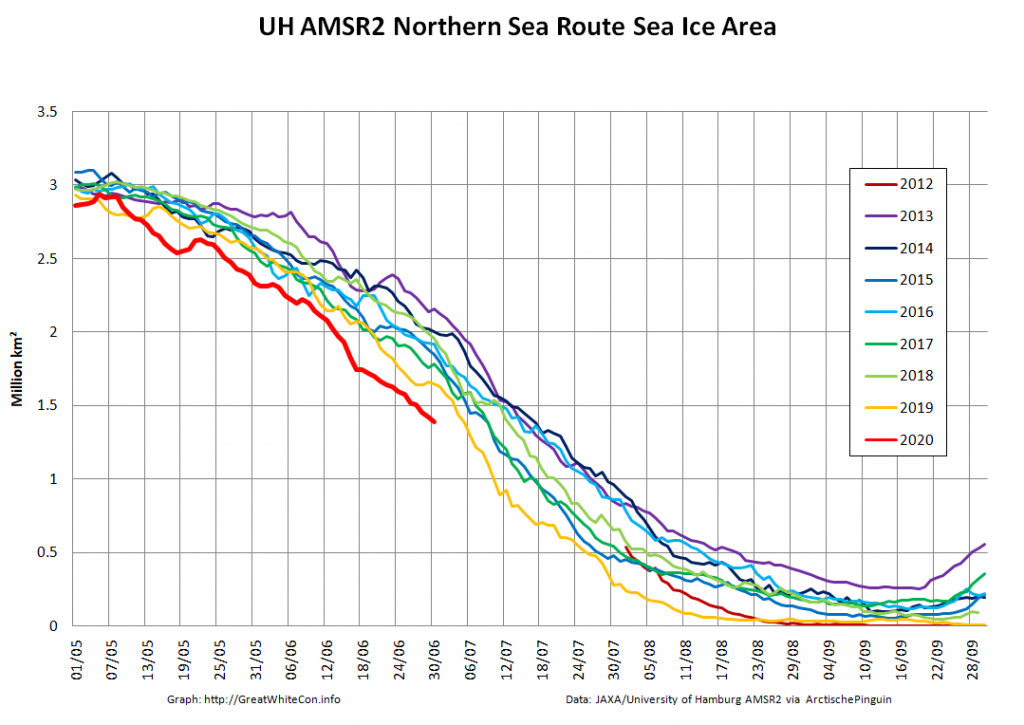
The 2020 melting season currently seems to be a game of two (geographical) halves. The sea ice on the Siberian side of the Arctic is currently at record lows:
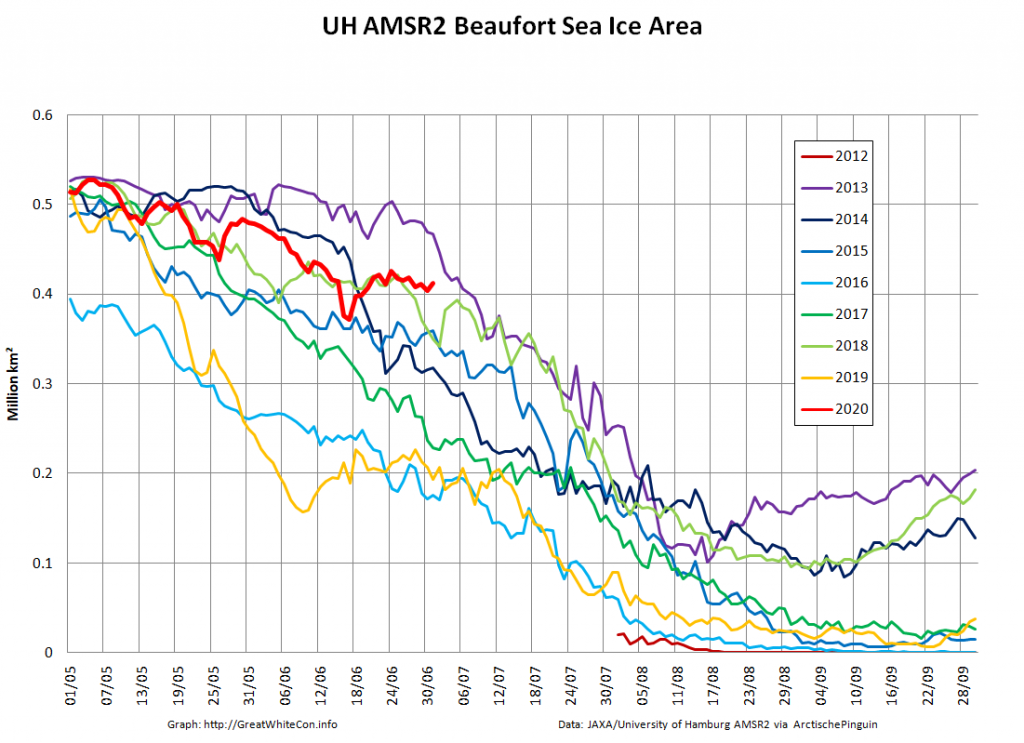
Whereas the Beaufort Sea is near a record high:
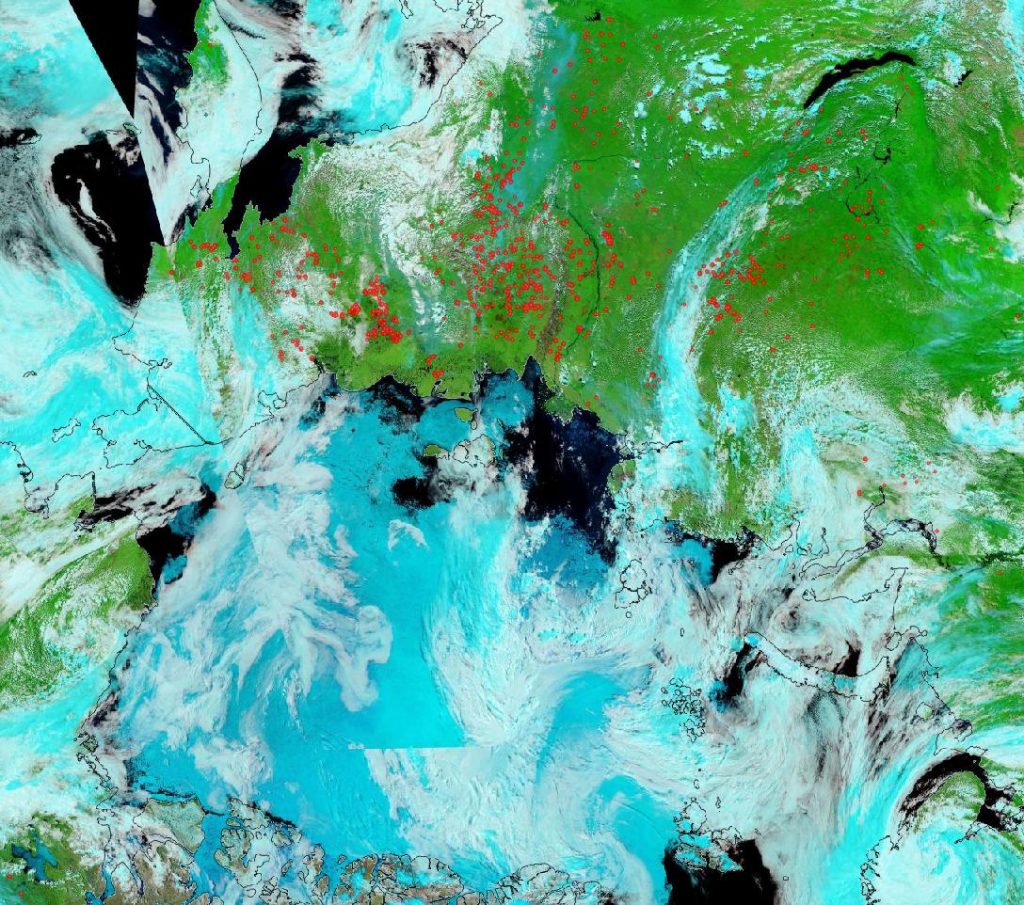
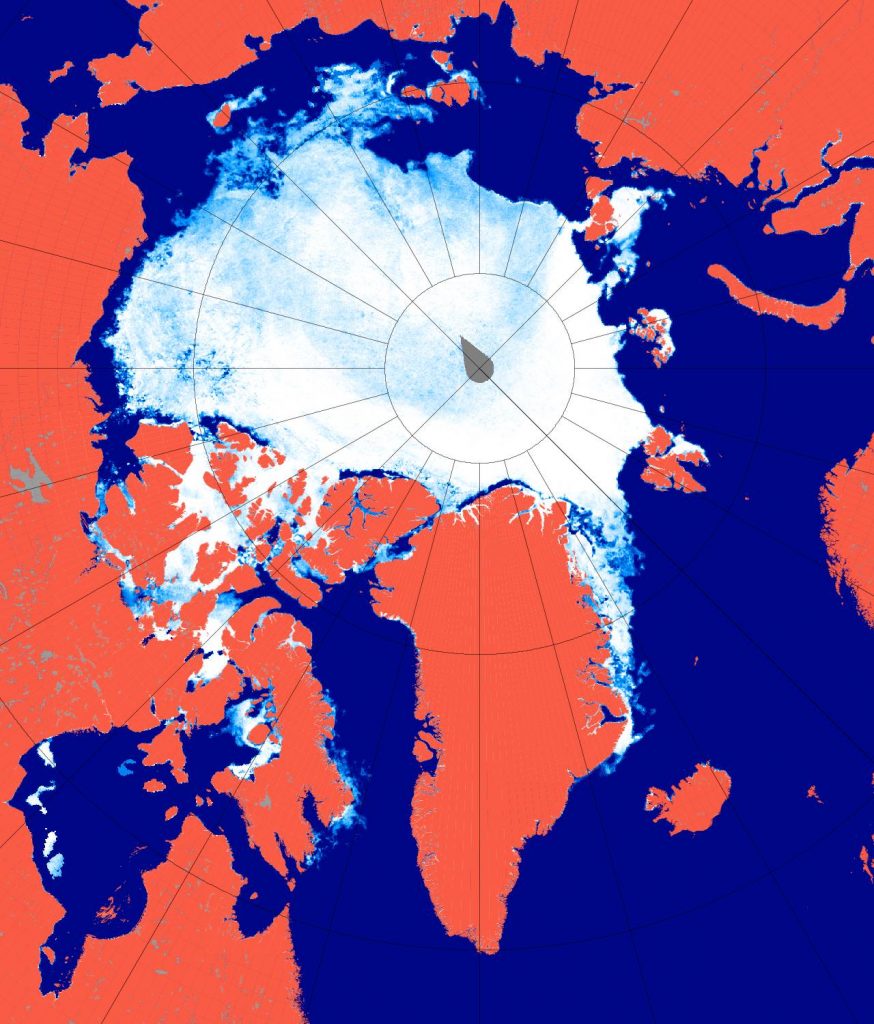
Currently the tell tale signs of surface melt are visible across most of the central Arctic, as are the large number of wildfires across Arctic Siberia:
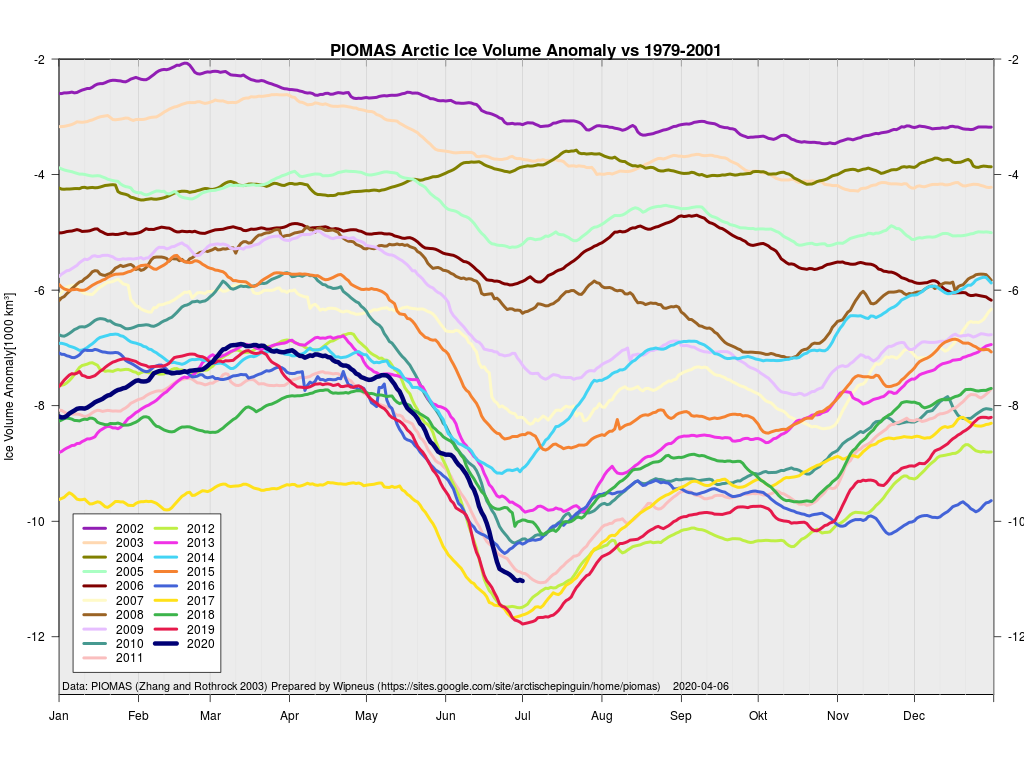
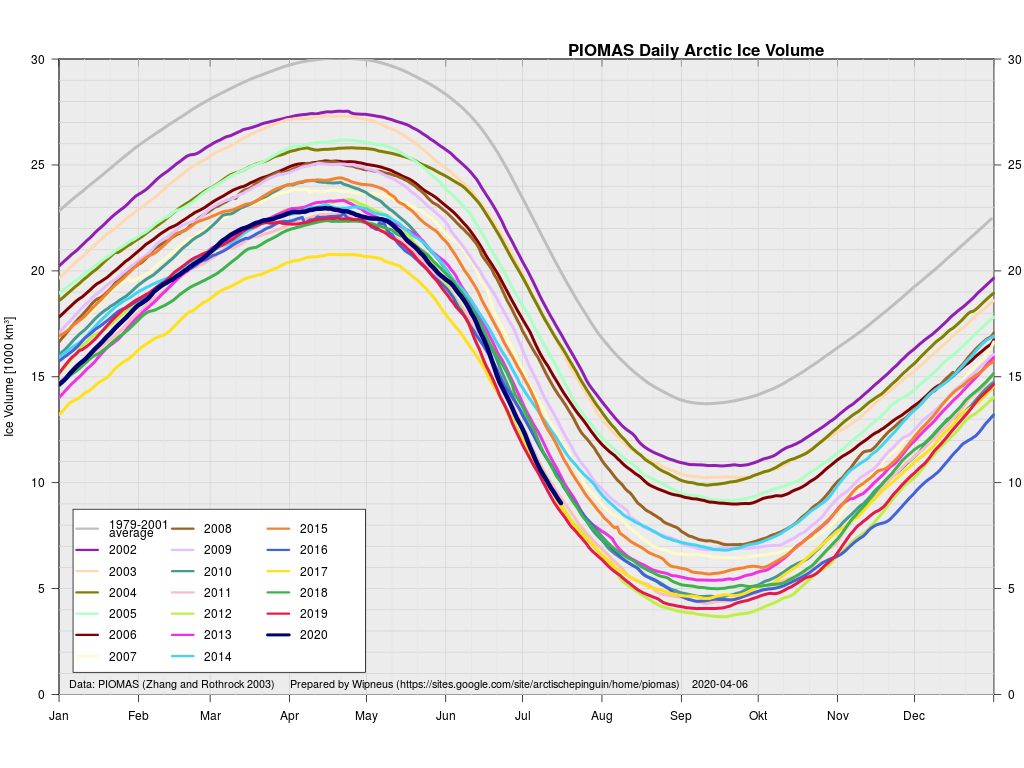
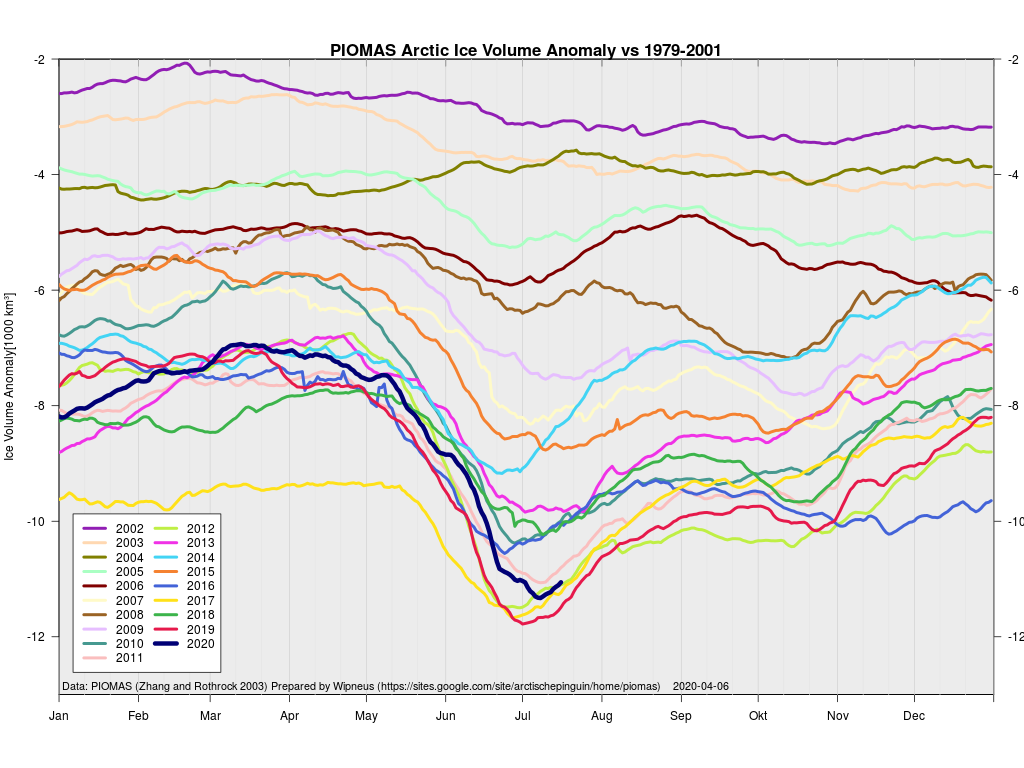
The June 30th PIOMAS gridded thickness numbers have been released, and here are the results of Wipneus’s number crunching:
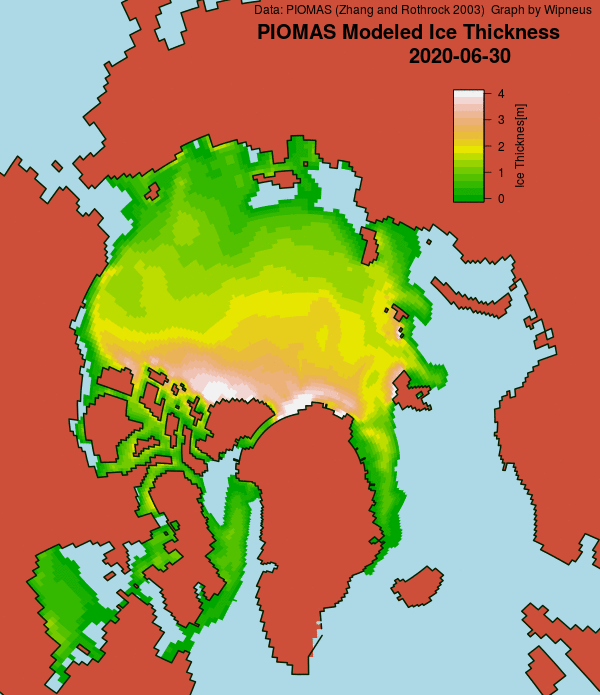
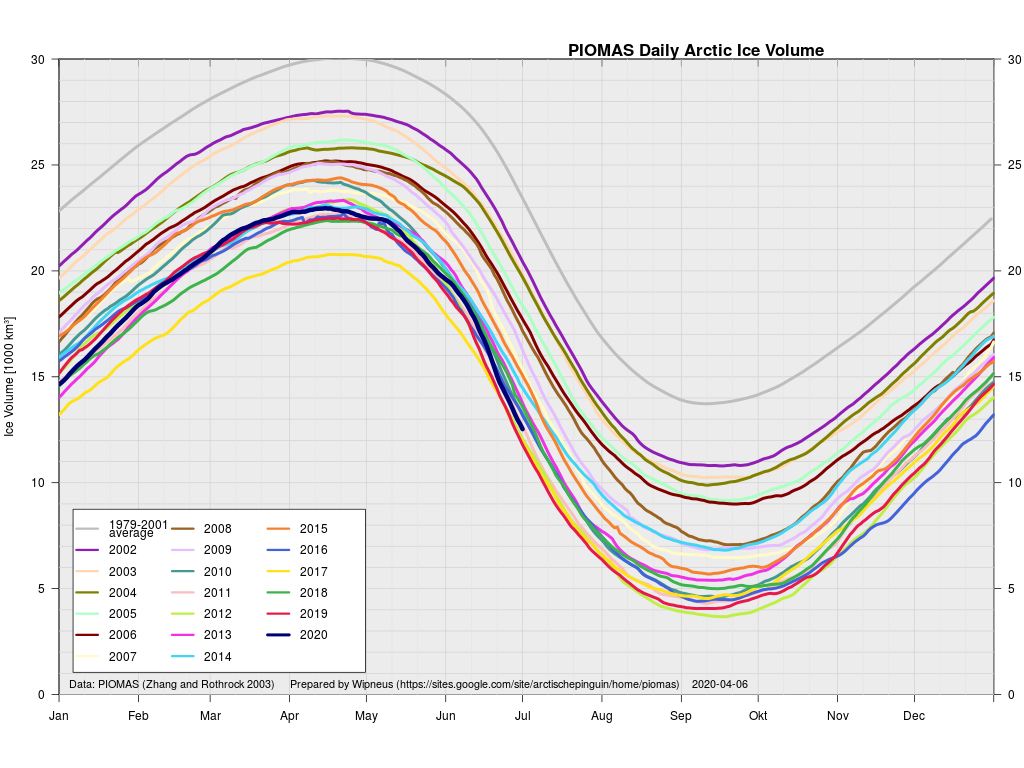
This month including a visualisation of the increasing negative anomaly:
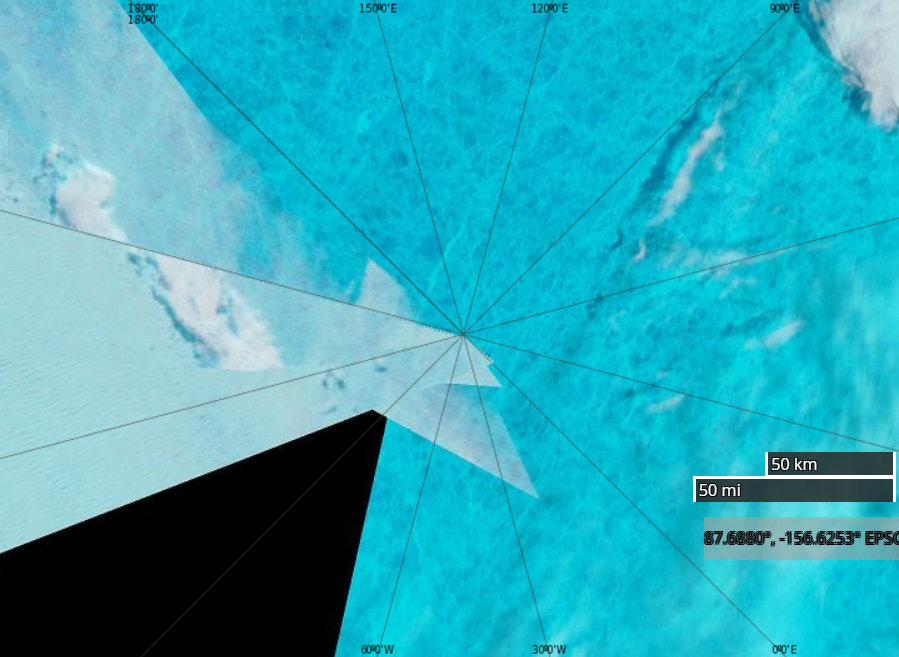
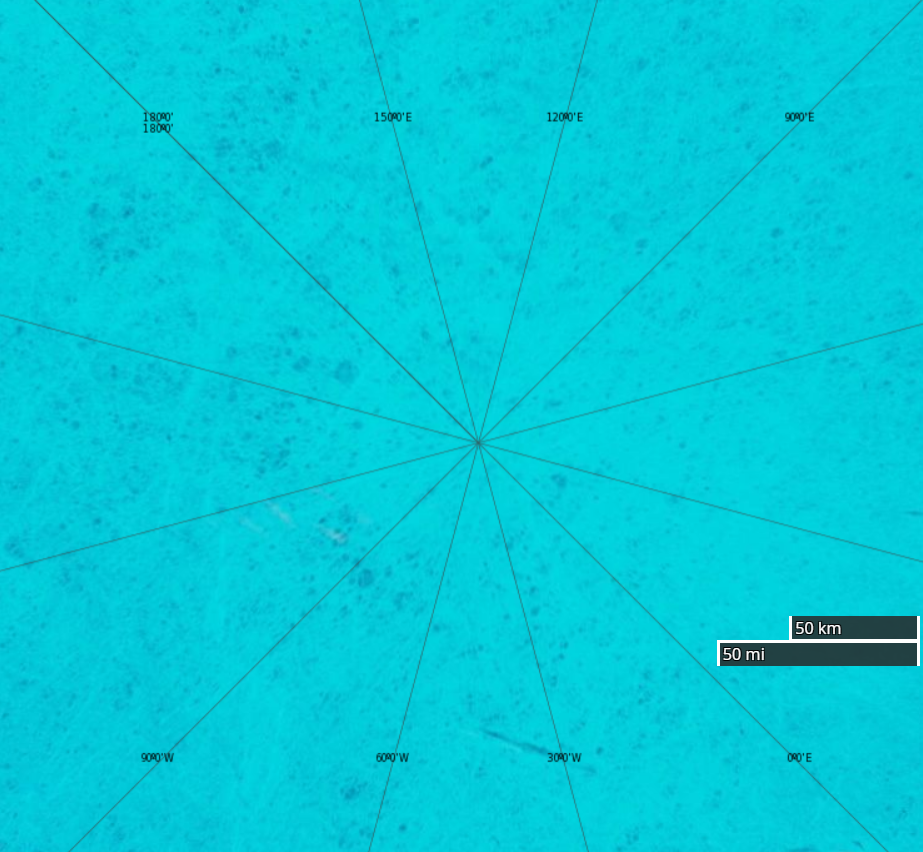
A break in the clouds over the North Pole reveals the onset of surface melt:
After a brief hiatus there are once again some ice mass balance buoys installed at assorted locations across the Arctic. Some have ceased to function, but one of the buoys installed as part of the MOSAiC expedition is still sending back data as it heads towards the Fram Strait. Buoy 387850 is currently located at 81.66 N, 4.19 E. Here’s its ice mass balance plot:
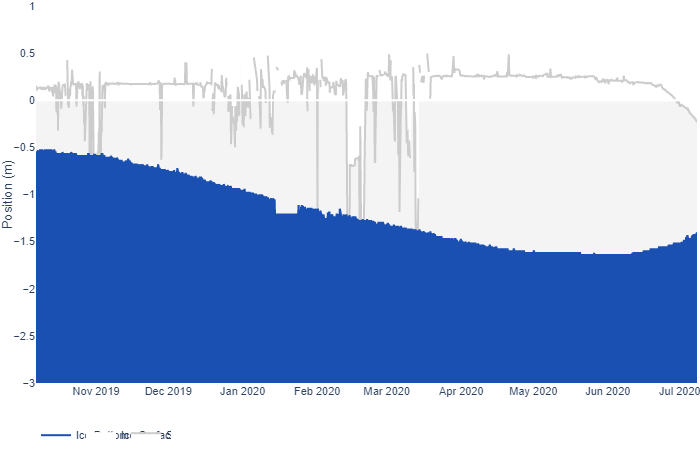
As you can see, both surface and bottom melt are well under way, with just over a meter of ice still remaining.
Now let’s take a look at buoy 386840, currently located at 74.30 N, 132.60 W in the Beaufort Sea:
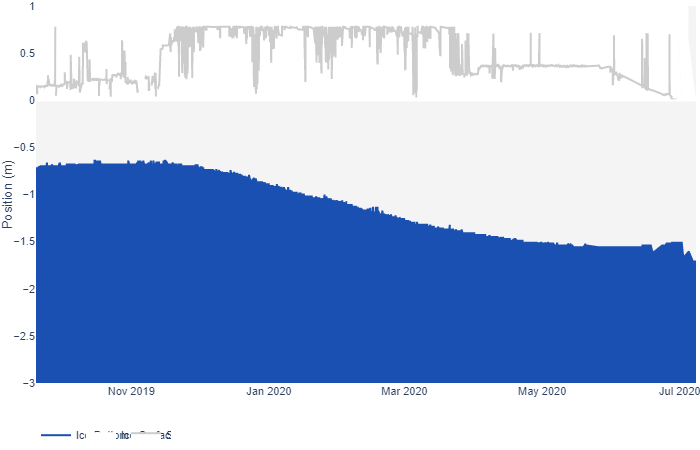
It looks as though the ice thickness has increased, but surely that can’t be right at this time of year? To try and find out I downloaded the raw data and plotted the temperature readings from the buoy’s thermistor string:
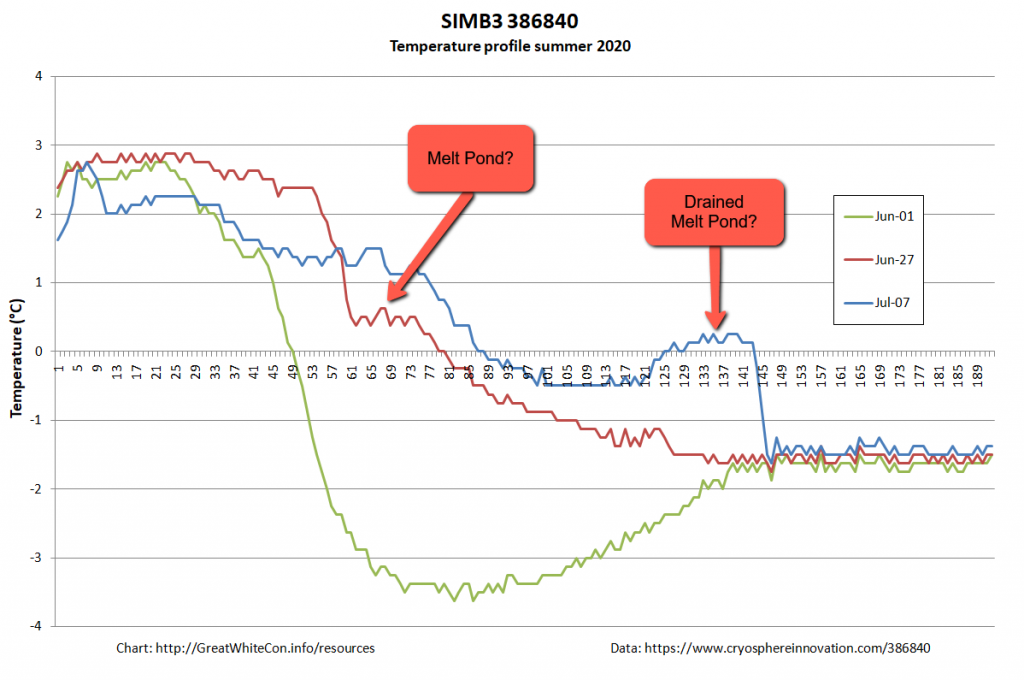
It looks to me as though the ice floe carrying the buoy is currently floating on some warm fresh water from a recently drained melt pond, which is confusing the sensor designed to measure the position of the bottom of the ice. There certainly seems to be far less than the claimed “1.653 m snow and ice thickness” still remaining to be melted!
A very unusual image. Hardly a cloud in the sky over the North Pole yesterday:
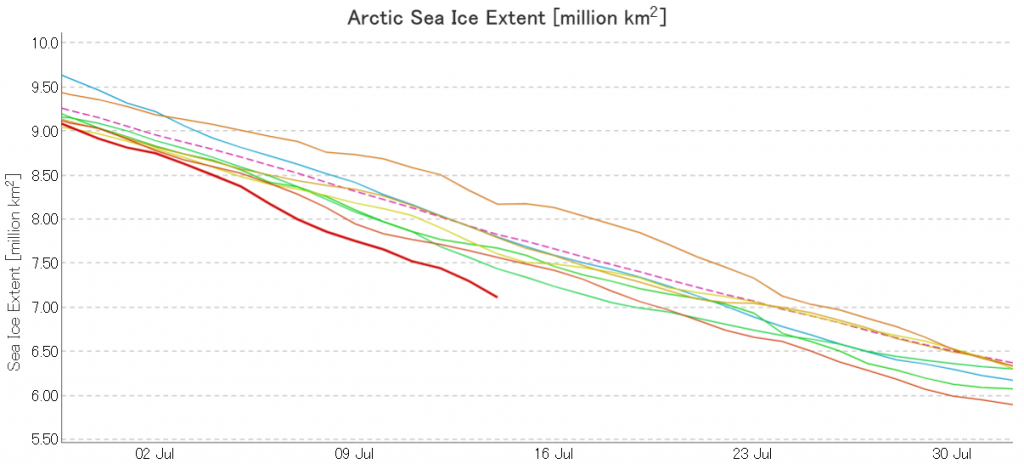
The July 2020 extent “plummet” shows no signs of ending just yet. Here’s the JAXA/ViSHOP version:
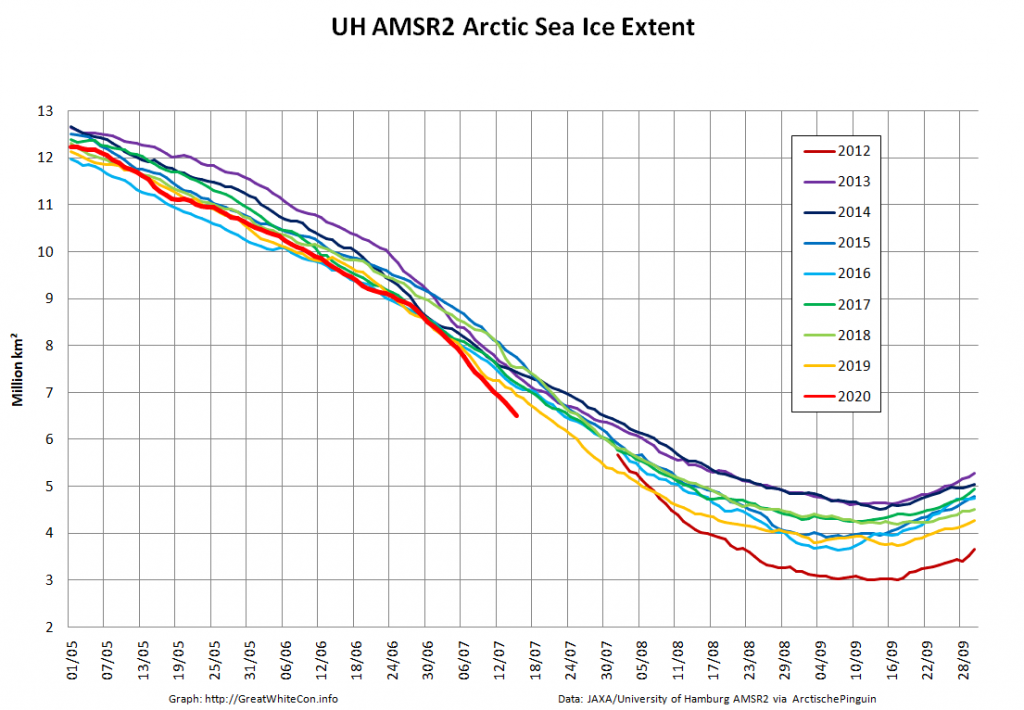
JAXA AMSR2 extent is now below 7 million km², and the high resolution version is lower still:
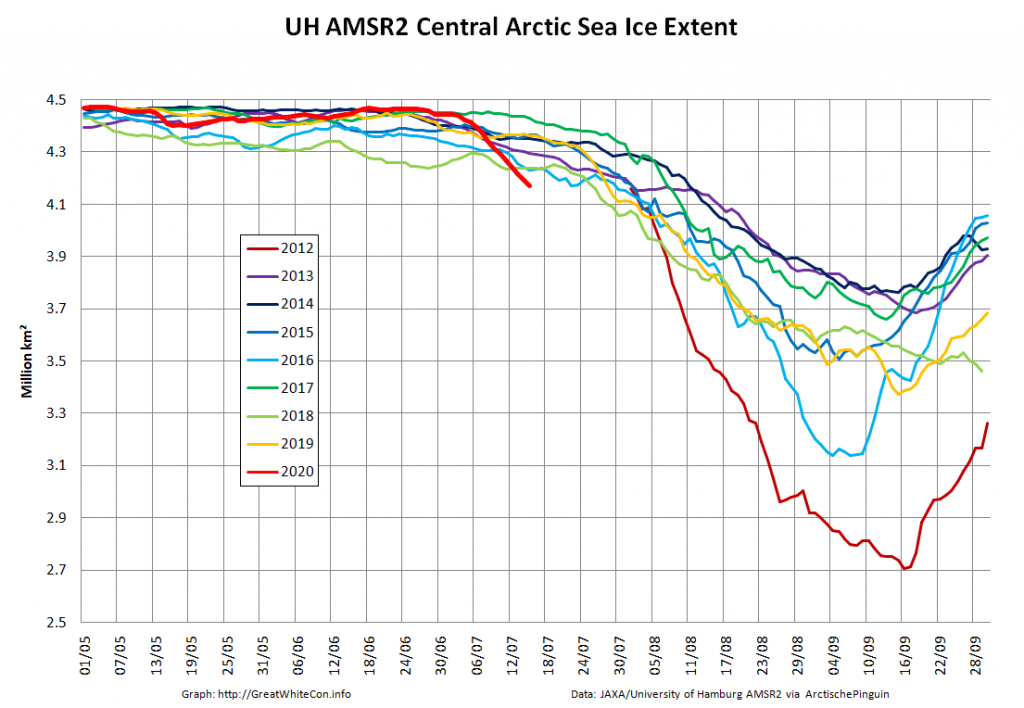
As the “Laptev Bite” and the Atlantic periphery of open water extends further towards the North Pole, Central Arctic Basin extent is now also at record lows for the date in the AMSR2 record:
Wipneus has crunched the mid month PIOMAS gridded thickness numbers, and here are the results:
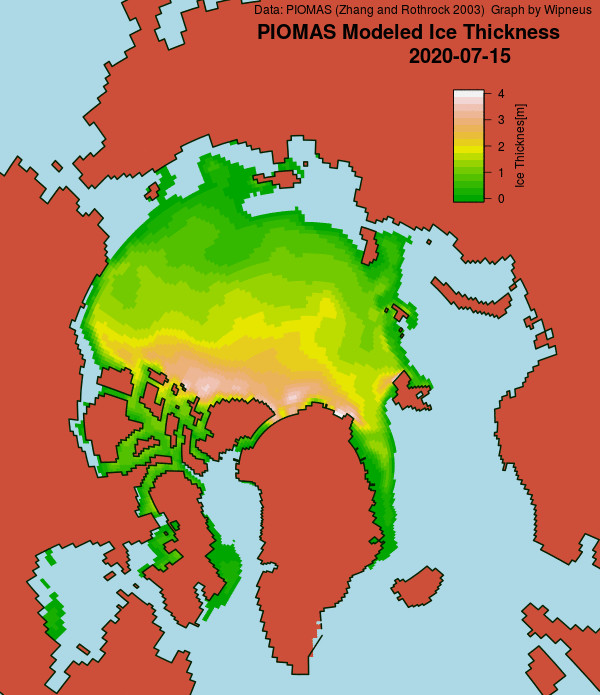
Extent is currently lowest in the satellite era by a long way, but modelled volume is only fourth lowest!
Watch this space!
At long last there’s a sub 1000 hPa MSLP low pressure area slowly wending its way across the central Arctic:
It seems to have bottomed out at 997 hPa. Perhaps this will inhibit the ongoing “plummet” in extent? JAXA extent fell by 114,342 km2 yesterday.
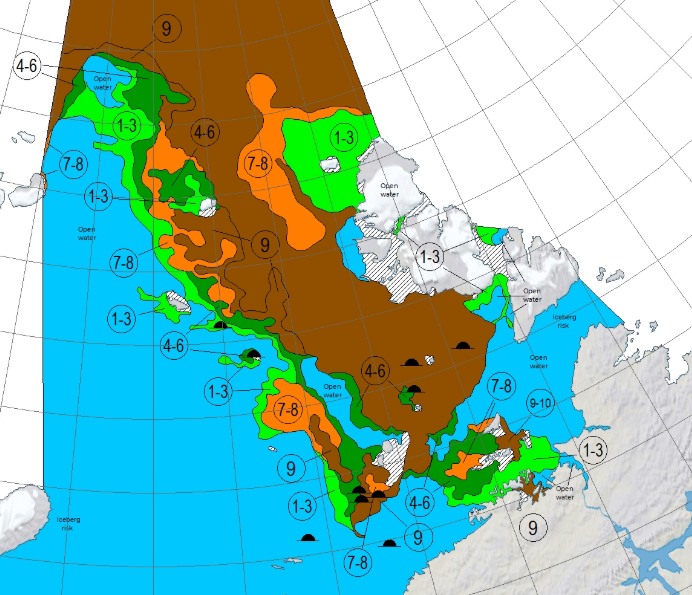
The Northern Sea Route has opened unusually early this year:
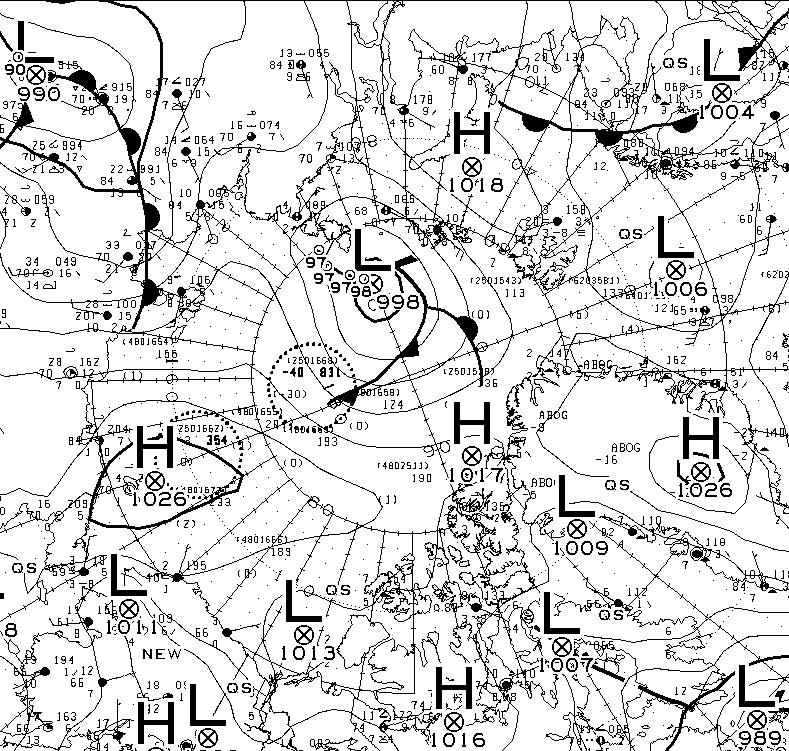
Based on the AMSR2 concentration maps from the University of Hamburg that happened on July 13th. The final choke point, as is so often the case, was the Vilkitsky Strait. According to the charts from the Russian Arctic and Antarctic Research Institute, by the 14th there was a narrow way through occupied by no more than 3/10 concentration ice:
A mere three days away, and the GFS and ECMWF forecasts are in agreement, so there is a decent chance this setup will materialise in the real world:
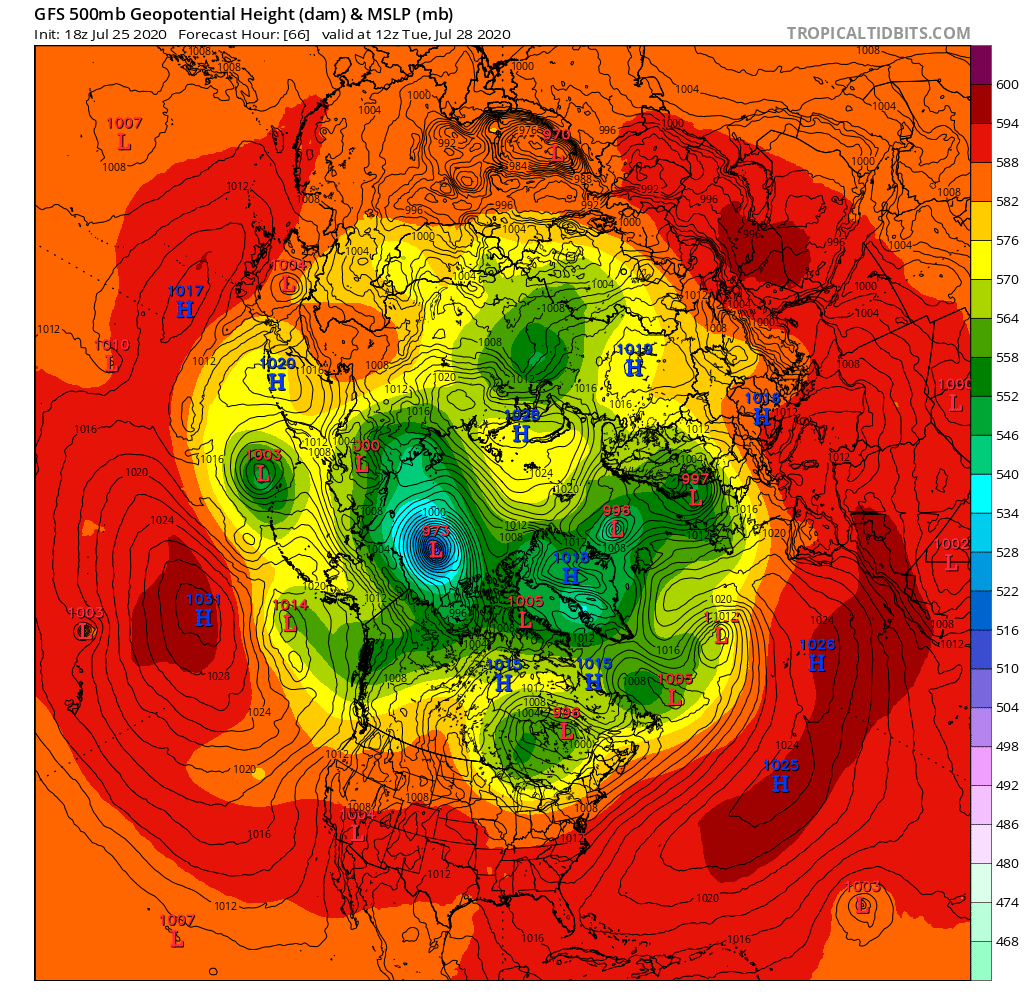
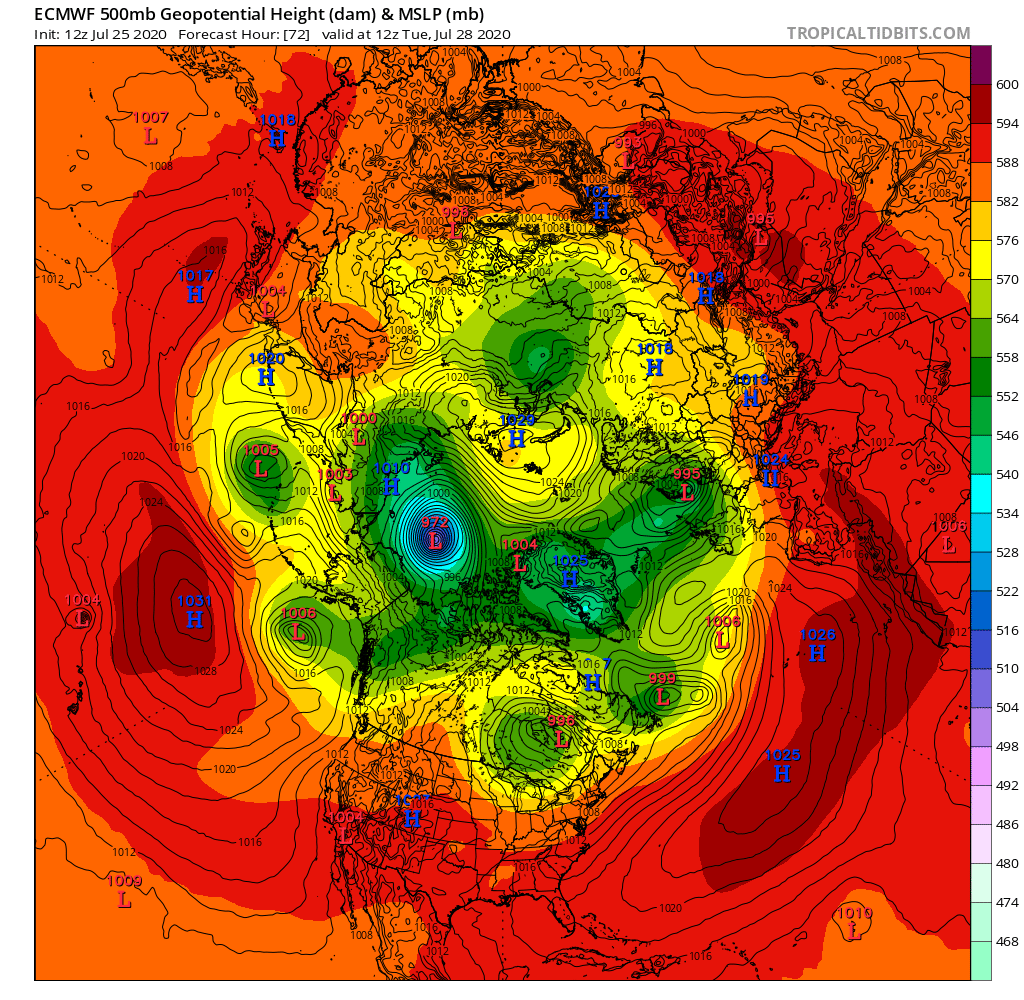
A 972(ish) hPa MSLP cyclone sitting over the ice Beaufort Sea by 12Z on Tuesday.
The Sea Ice Prediction Network July forecast for this year’s September minimum extent have been released. Here’s the graphical overview:
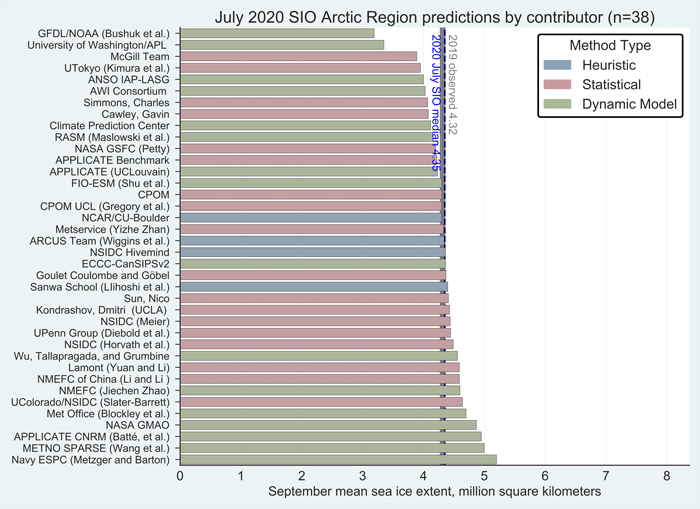
This year’s median projected value from the July forecasts of 4.3 million square kilometers is essentially identical to the median from the June forecasts. Quartiles are 4.1 and 4.6 million square kilometers. As was also the case for June, only two projections, both by dynamic models, are for a new record low, below the mark of 3.57 million square kilometers set in 2012. One dynamical model predicts the September sea-ice extent above 5.0 million square kilometers, compared to two in the June report.
Note that the numbers quoted are for the average NSIDC extent across the month of September, not the lowest daily JAXA extent, which I suggested earlier would be “below 4 million km²” this year.
Meanwhile over on Twitter this evening (UTC):
The MSLP of the (Great?) Arctic cyclone sank below 970 hPa overnight:
Here’s an early false colour snapshot of how (s)he looks from on high this afternoon (UTC), courtesy of the MODIS instrument on the Terra satellite:
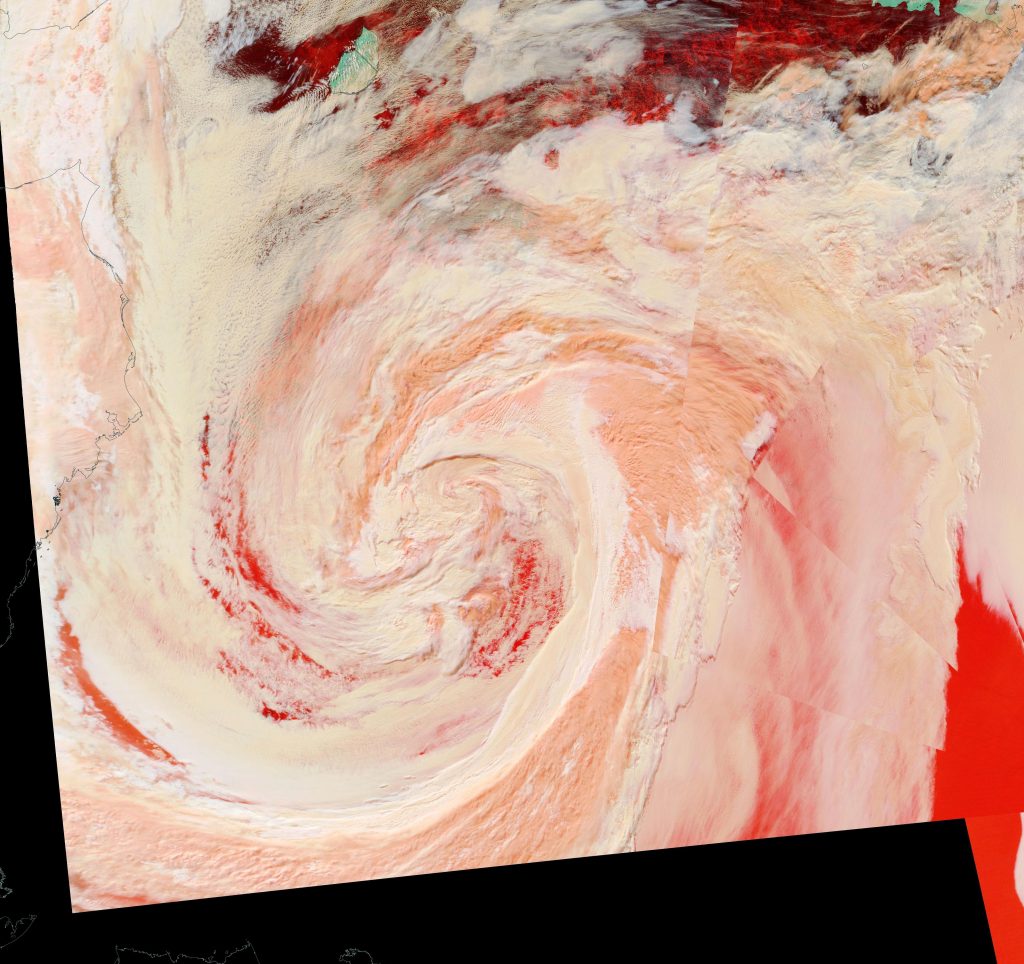
First up today we have a more complete “true colour” image of the cyclone doing its worst yesterday, including a fairly clear view in the bottom left corner of the initial damage to the sea ice covering the eastern Beaufort Sea. This one is from the Aqua satellite:

Watch this space!
Albedo looks frightening!
Then there’s the 50 day forecast
He’s predicting 4.05 for August 24 !!!!!
“He” being the late, great Andrew Slater. Here’s the prediction to which you refer:
It also shows no reduction in extent during the second half of July, which seems rather “non physical” to say the least?
Yes, now some science can be done. Not only a prediction of a 2nd half of July pause, but a clear ‘plummet’ afterwards which would signal a new record for September minimum. Near-term, theory-based predictions are most useful. At least we’ll know shortly if this one holds any water (or ice, for that matter).
I see it all as continuous recorrection: meaning the only thing that matters is where the blue line ends and so it’s history is of no importance.
Well, the data is in, and there was no ‘plummet’ at the beginning of July, we’ll see if there is a plateau toward the end of July. BTW, I don’t see a source for the “actuals” part of his graph. Depending on which one you use, there is a half million sq km difference, so I’m curious. Jim, do you know what his reference is?
Slater’s algo seems to have made a pretty good job of predicting the initial July “plummet”:
The “actuals” line is based on applying the NASA Team algorithm to SSMIS concentration data, as used by the NSIDC. There was a suggestion that the “pole hole” might be treated differently though.
My mistake, the graph is labeled “sea ice extent” which for NSIDC is now a bit under 9 million, you’re saying he’s actually using “concentration” and reporting a bit under 8 million. It’s either a bad graph label or a faulty calculation. In any case, he should predict a metric everybody has access to, not one he’s creating somehow himself. Not much science here…
It sounds like you’re not familiar with Andrew Slater? He was an NSIDC scientist, who sadly died at a very tender age in 2016.
https://neven1.typepad.com/blog/2016/09/in-memoriam-andrew-slater.html
His algo is still going however, and calculates extent from gridded SSMIS concentration data. I’ve been known to do that sort of thing myself. Here’s the source code if you’re interested:
https://forum.arctic-sea-ice.net/index.php/topic,3000
There’s lots of science here in actual fact!
Here also for your edification is the NSIDC version of the July 2020 “plummet” in Arctic sea ice extent:
7.919 million km² on July 12th. What do you suppose the September minimum will be this year?
Jim, yes, I was aware that Slater was no longer alive, you also mentioned him as the ‘late, great’ above. I should have said ‘his algorithm’, not ‘he’ in my post. I also misremembered the latest NSIDC extent number, should have said “just under 8”, not “just under 9” – should have checked before posting. Also, thanks for clarifying that the algorithm is predicting extent from concentration. I took a quick look at the Python code, looks pretty straightforward, but will look closer later. As for a prediction on September minimum, right now I’m somewhere between 4 and 4.5. Siberian side is pretty weak, but there is som pretty stubborn ice on the Canadian side and it’s not clear that bottom melting will be as strong as usual in the late summer. What’s your estimate?
It does of course still all depend on the weather!
However at this juncture I’m going to plump for JAXA extent below 4 million km², and hence at best the second lowest minimum extent of the satellite era.
2020 could drop below 3 million km^2
JAXA ARCTIC SEA ICE EXTENT: 6,551,222 KM2 as at 18-Jul-2020
Average remaining melt (of the last 10 years) would produce a minimum in Sept 2020 of 3.35 million km2, 0.18 million km2 above the 2012 minimum of 3.18 million km2.
In every year since 2007 remaining melt results in an extent below 4 million km2.
For a record low remaining melt needs to be 5.5% or more above average, as happened with remaining melt in 2012, 2015, 2016, and 2018
Plus another 100k lost yesterday.
The 2020 “plummet” will have to pause for breath at some point, but for the moment there’s still some low hanging fruit on the Siberian side.
Meanwhile holes are starting to appear in the Beaufort Sea ice cover, and buoy 386840 has recently melted out of its mounting hole at 74N, 132W:
Volume…. Thickness…. The price of gold might start to get interesting
I’m not sure that I’m speaking your language yet!
Do you mean that a “blue ocean event” will lead to a stock market collapse?
JAXA extent has finally broken its long sequence of over 100k daily drops.
A mere 99,785 square kilometres decline yesterday.
Plus another 118k yesterday. Is there still no end in sight?
There’s only a modest amount of wispy stuff left to melt out in the ESS, but now the sea ice cover in the Beaufort Sea is starting to look like Swiss cheese:
JAXA extent declined by a “mere” 69k yesterday.
The first signs of an extended slow down? Albeit long after the SPIE “prediction” of such a thing, which currently looks like this for September 10th:
JAXA extent declined by 5k yesterday.
A “slow down” at long last, albeit not yet an “extended” one.
The latest ECMWF 0Z run reveals a 970 hPa MSLP cyclone two days out. GFS concurs. This is the ECMWF version:
After a decline of 48k JAXA extent edged below 6 million square kilometres yesterday. 5.99 to be more precise!
The 12Z GFS run shows no significant change to the minimum MSLP of the forecast cyclone.
Nighty, night: