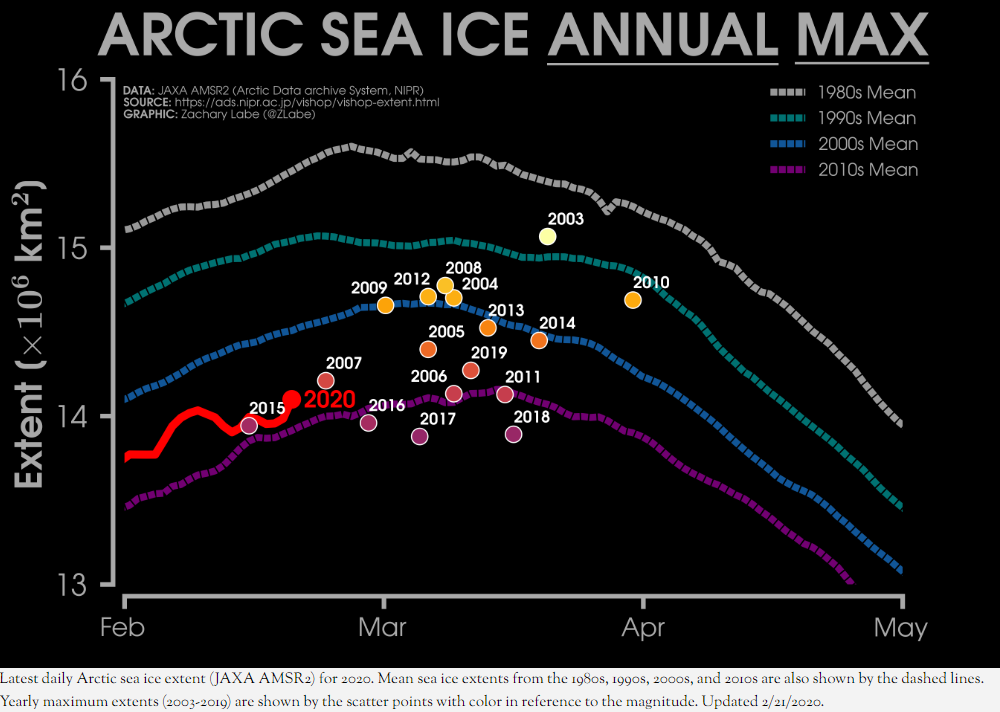
As Zack Labe has recently pointed out, in 2015 the Arctic sea ice maximum extent based on the JAXA numbers had already occurred on February 15th:
Perhaps it’s time we started paying attention this year! However the National Snow and Ice Data Center reported a significantly later date in 2015:
On February 25, 2015, Arctic sea ice extent appeared to have reached its annual maximum extent, marking the beginning of the sea ice melt season. This year’s maximum extent not only occurred early; it is also the lowest in the satellite record. However, a late season surge in ice growth is still possible.
Each year we keep track of the assorted Arctic sea ice metrics over the next month or so, and they rarely agree on the date of maximum extent, and never agree on the sea ice extent on that date! The reason for that is explained in a 2017 paper entitled “Variability and trends in the Arctic Sea ice cover: Results from different techniques“:
Reports on the sea ice cover have been provided by different institutions using basically the same set of satellite data but different techniques for estimating key parameters such as ice concentration, ice extent, and ice area. In this study, a comparison of results from four different techniques that are frequently used shows significant disagreements in the characterization of the distribution of the sea ice cover primarily in areas that have a large fraction of new ice cover or significant amount of surface melt.
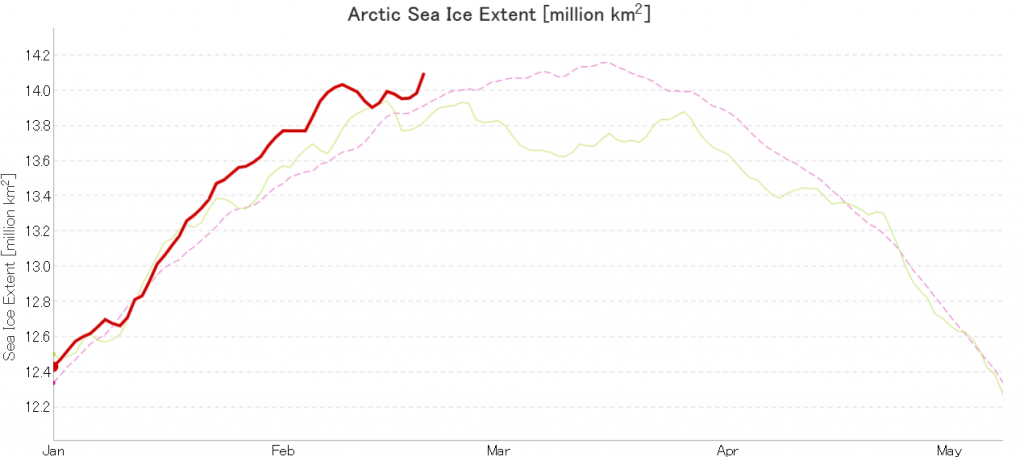
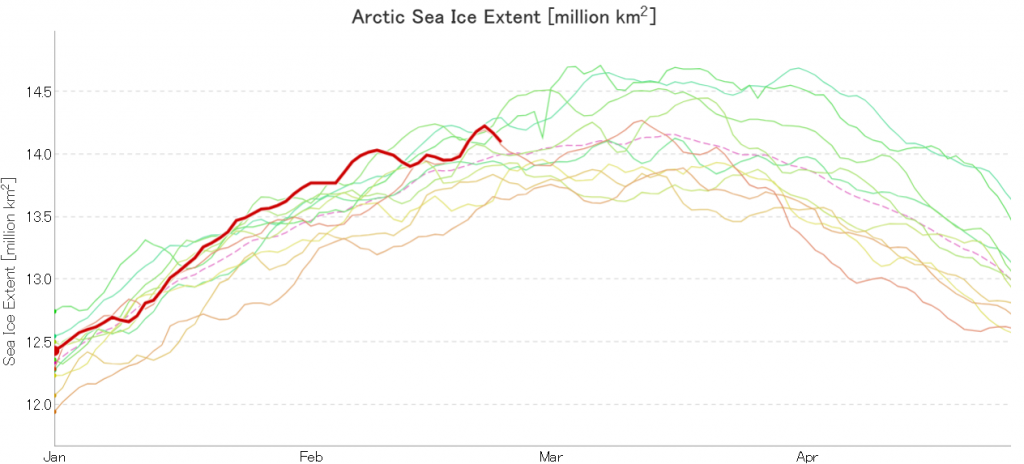
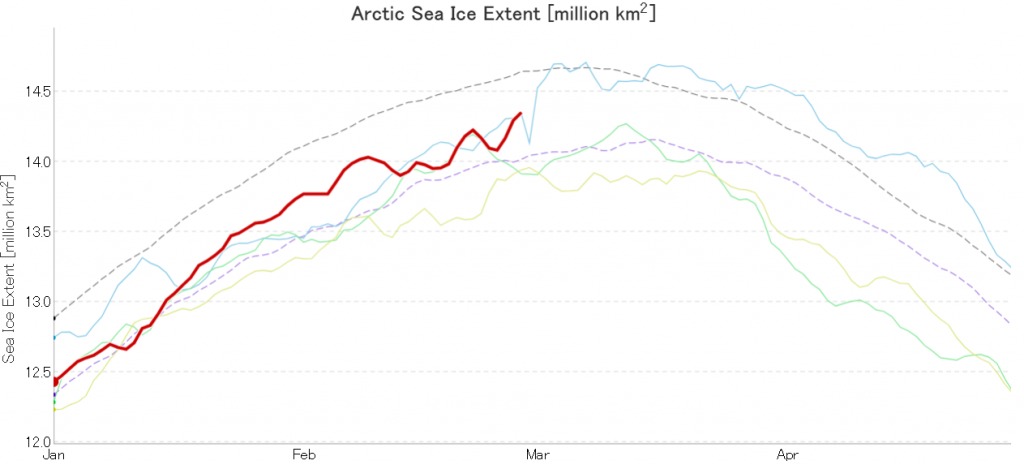
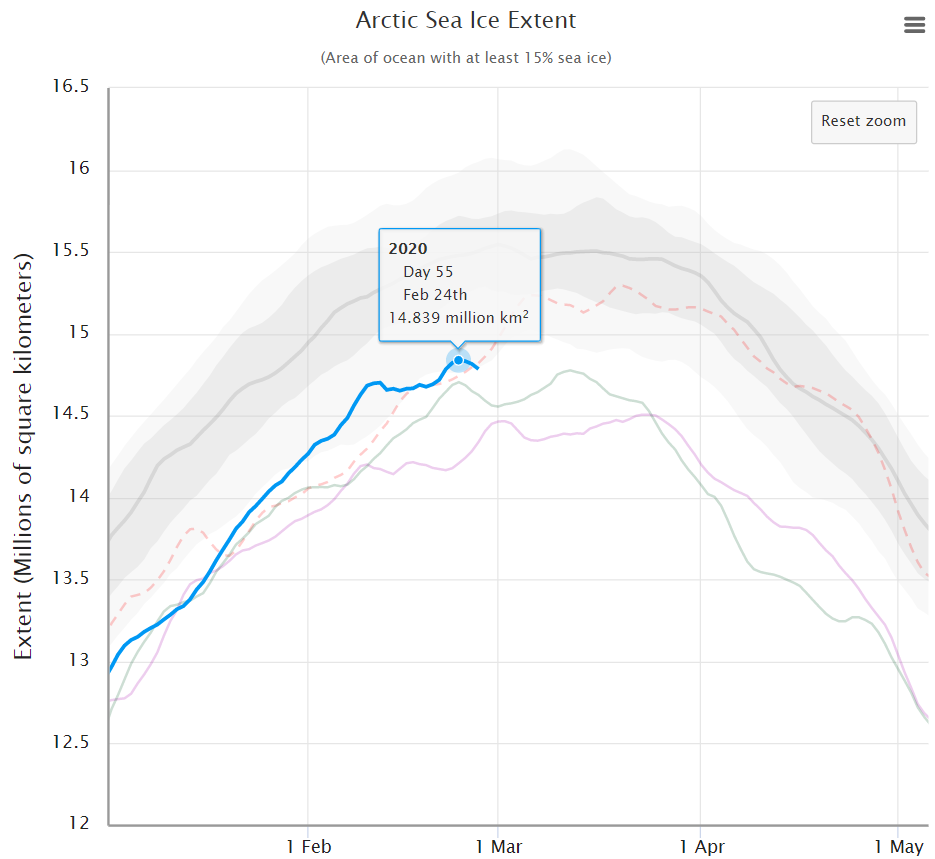
In due course we’ll look at the metrics from a variety of different institutions, but let’s start with JAXA, comparing 2020 with 2015 and the 2010s average:
Extent is clearly increasing just at the moment! Will the next peak prove to be the maximum for the year or will we have to wait another month or more to find out that value, as suggested by the average?
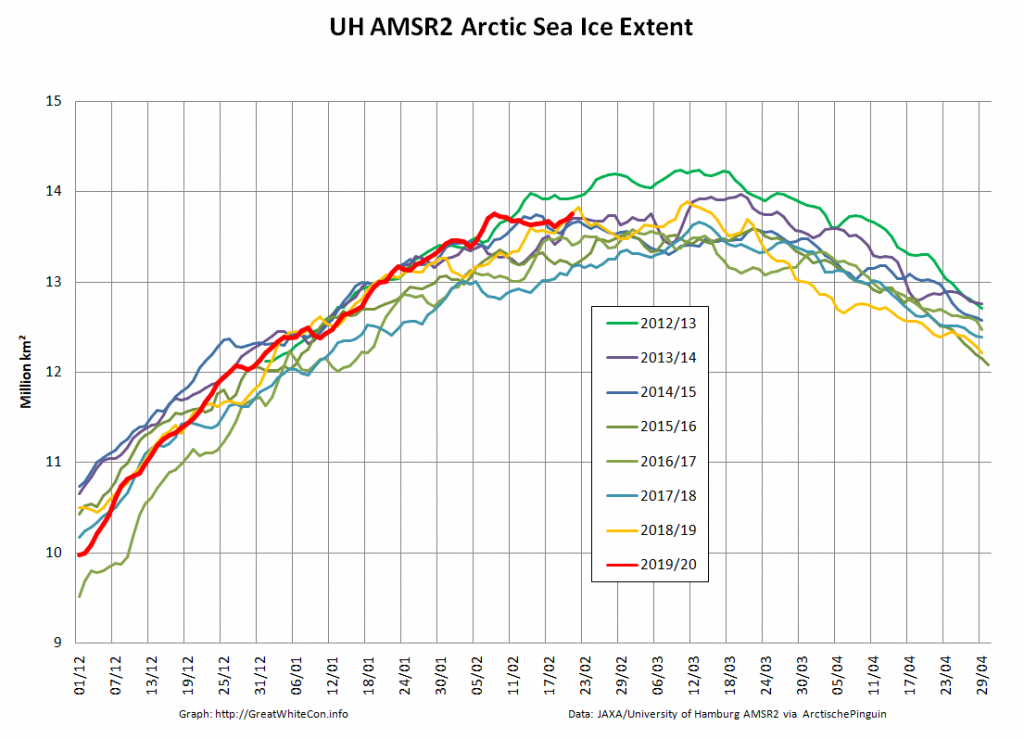
Compare and contrast JAXA extent with Wipneus’ high resolution AMSR2 extent and area:
Perhaps the 2020 maximum area has already been reached?
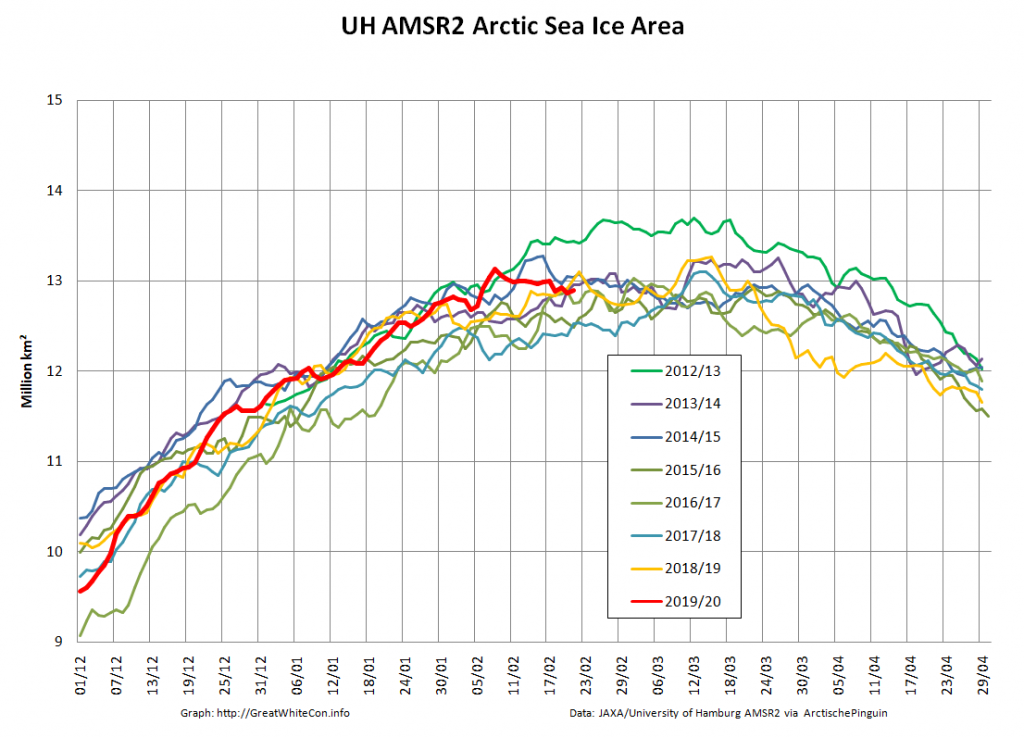
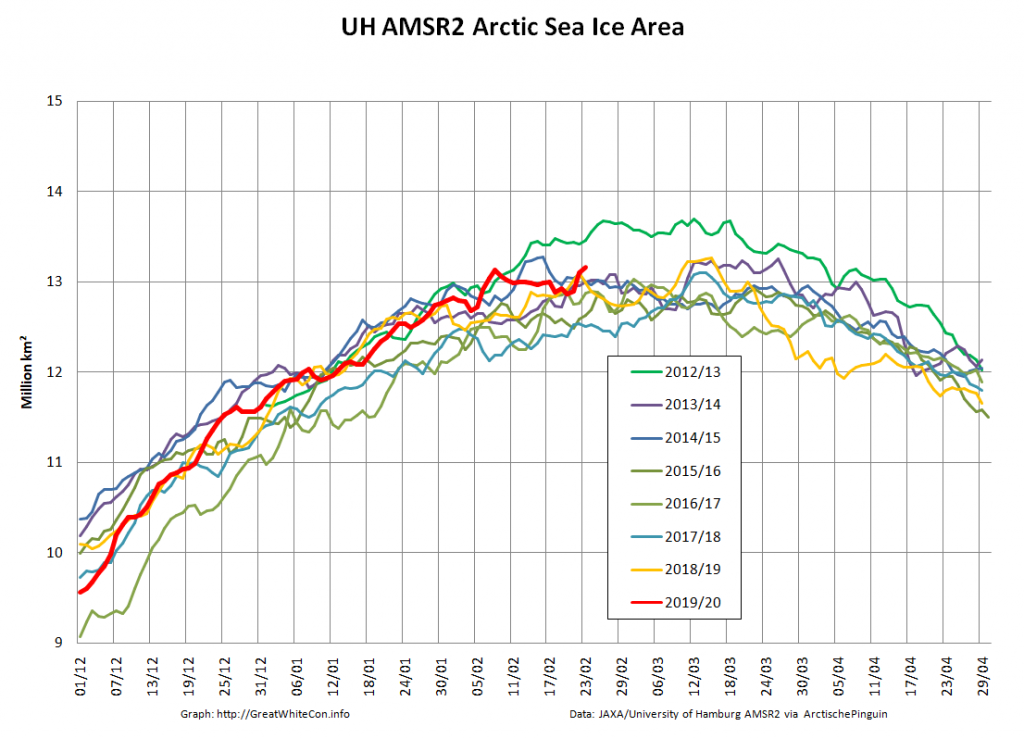
Or perhaps not! We’re playing mix and match this morning, since Wipneus’s new numbers haven’t been released yet. Here UH AMSR2 high resolution Arctic sea ice area from February 23rd:
Plus JAXA extent for the 24th:
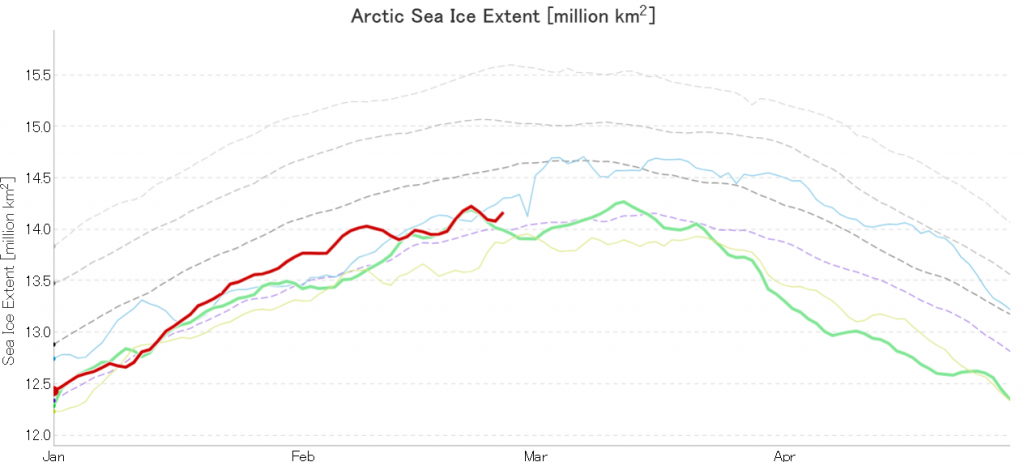
Tony Heller’s latest sea ice themed article claims “Normal Sea Ice Extent At Both Poles”. Hence today’s JAXA extent graph includes the averages for previous decades:
Extent is evidently increasing once again, and is even more evidently well below what passed for “normal” in the twentieth century!
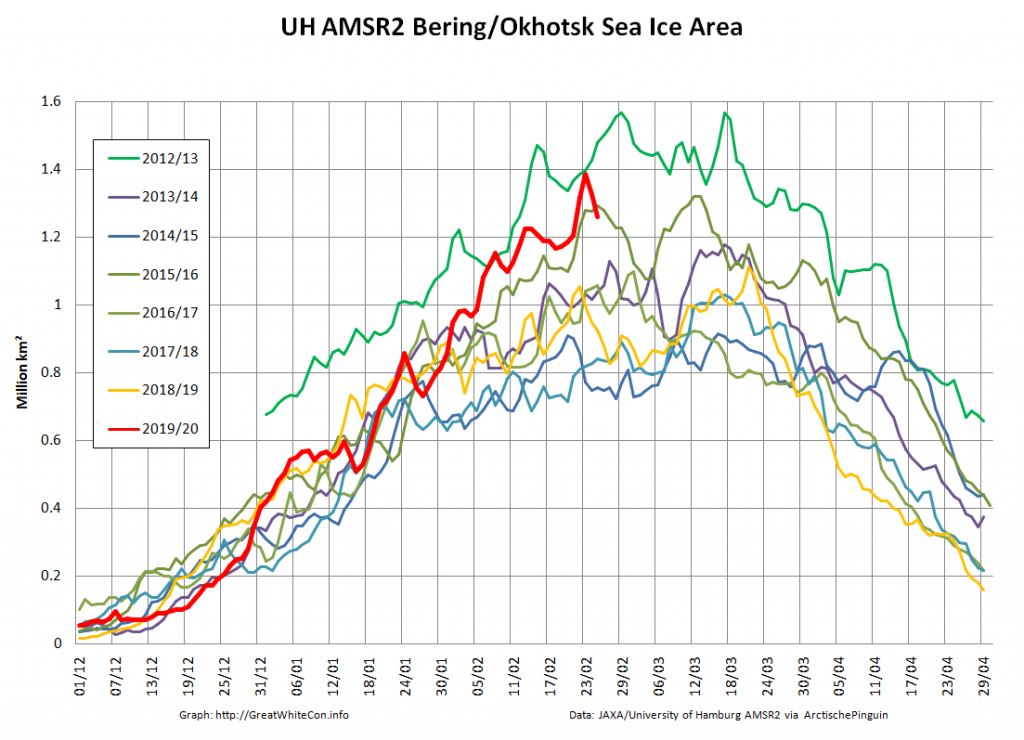
Let’s also compare the Pacific periphery:
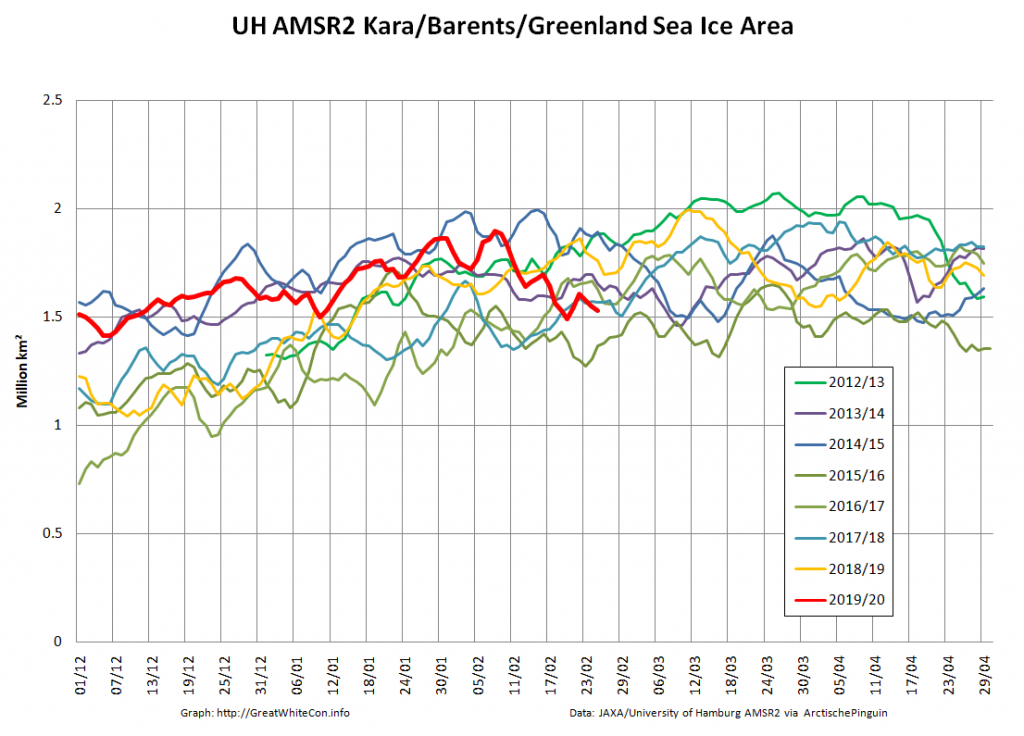
with the Atlantic side of the Arctic Ocean:
The Bering and Okhotsk Seas will be sea ice free by the time September 2020 arrives. How about the Kara, Barents and particularly Greenland Seas though?
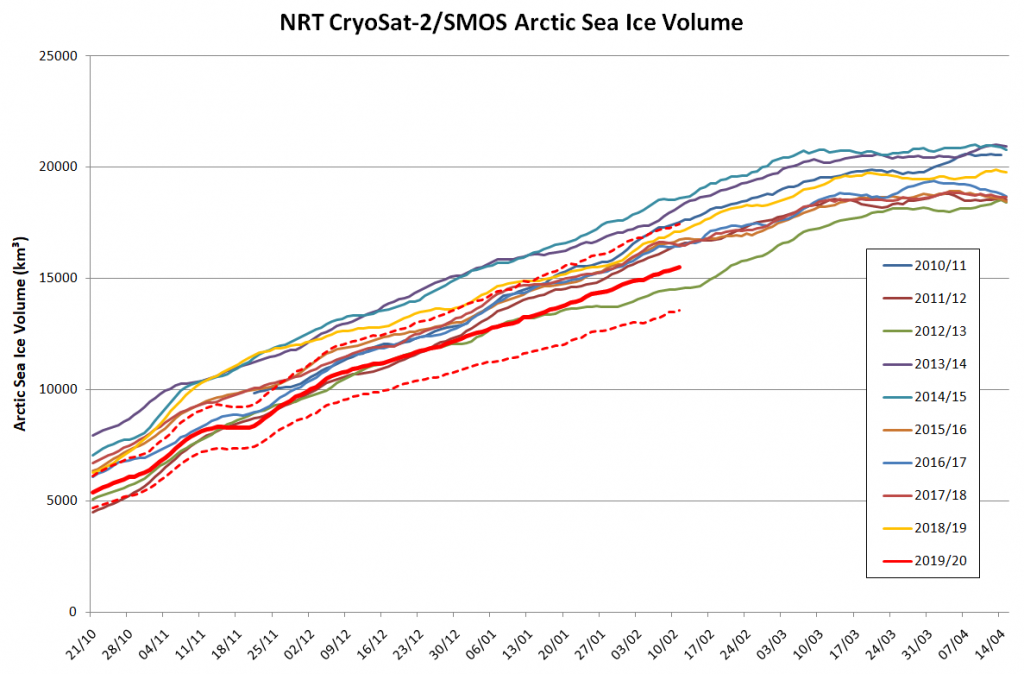
Arctic sea ice maximum volume usually occurs in April, but nonetheless let’s keep an eye on the metric that most nearly measure the “amount” of sea ice left in the Arctic in 2020. Here’s our “measured” CryoSat-2/SMOS volume metric, using reanalysed data up to February 12th:
PIOMAS “modelled” volume for February should be released soon, but getting back to extent the JAXA flavour has been setting new highs over recent days:
whereas the NSIDC’s Charctic 5 day averaged extent has not!
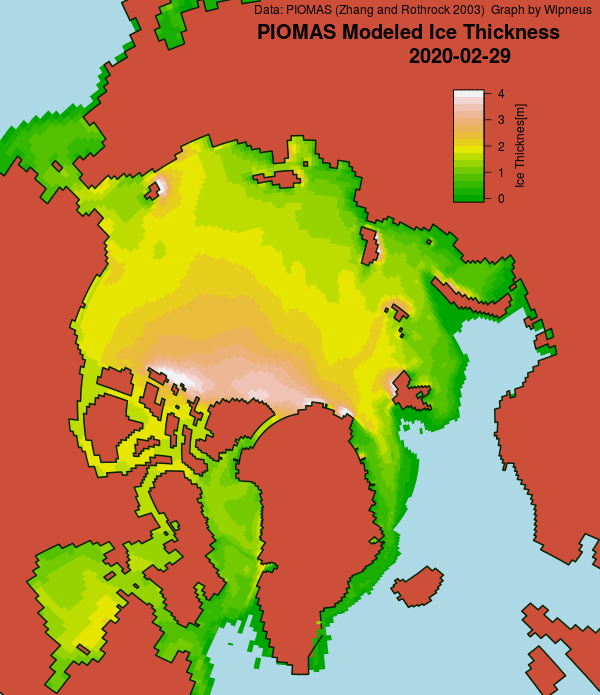
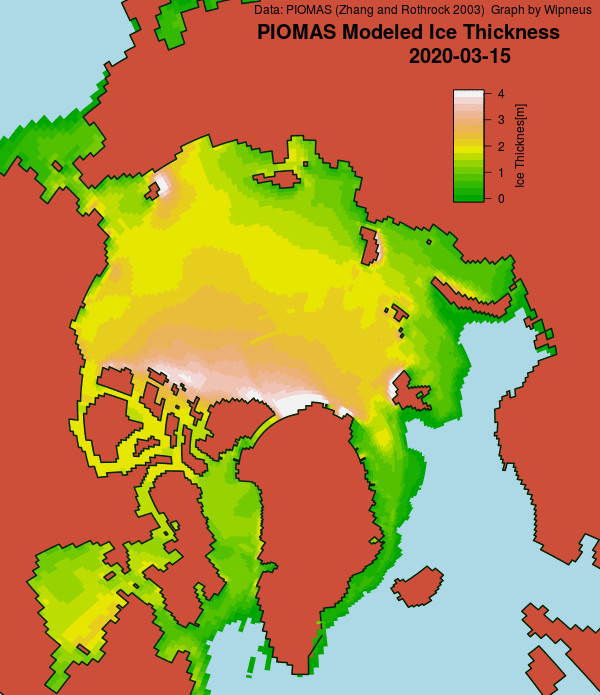
Here’s the February PIOMAS gridded Arctic sea ice thickness map, courtesy of Wipneus on the Arctic Sea Ice Forum:
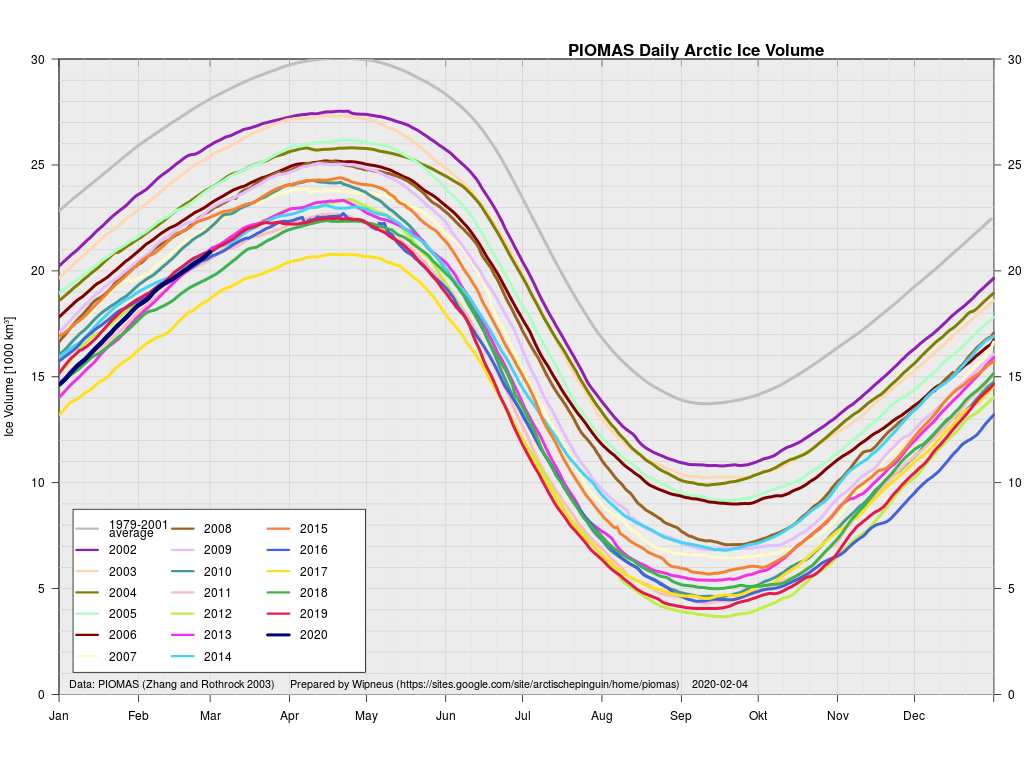
plus the traditional modelled volume graph:
As angech has pointed out elsewhere, according to the PIOMAS team:
CryoSat-2 data show total volume for February 2020 substantially lower than PIOMAS with 2020 Febuary near record low levels over the 2011-2020 period
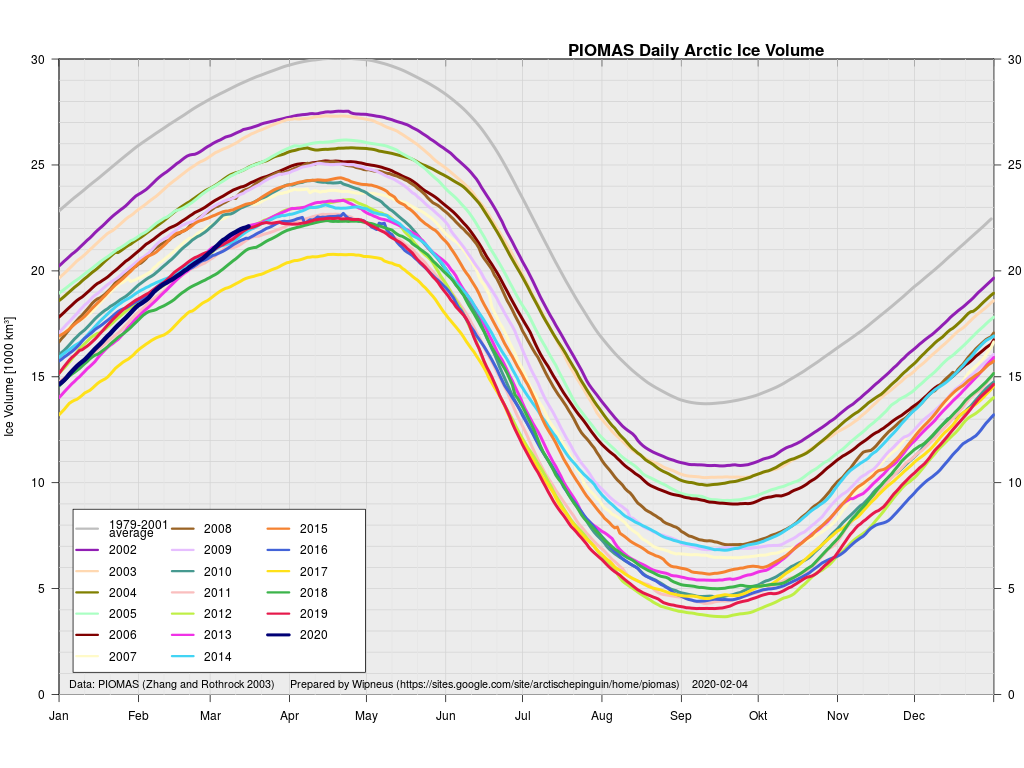
The March mid month PIOMAS numbers have been crunched by Wipneus. Here’s how things look at the moment:
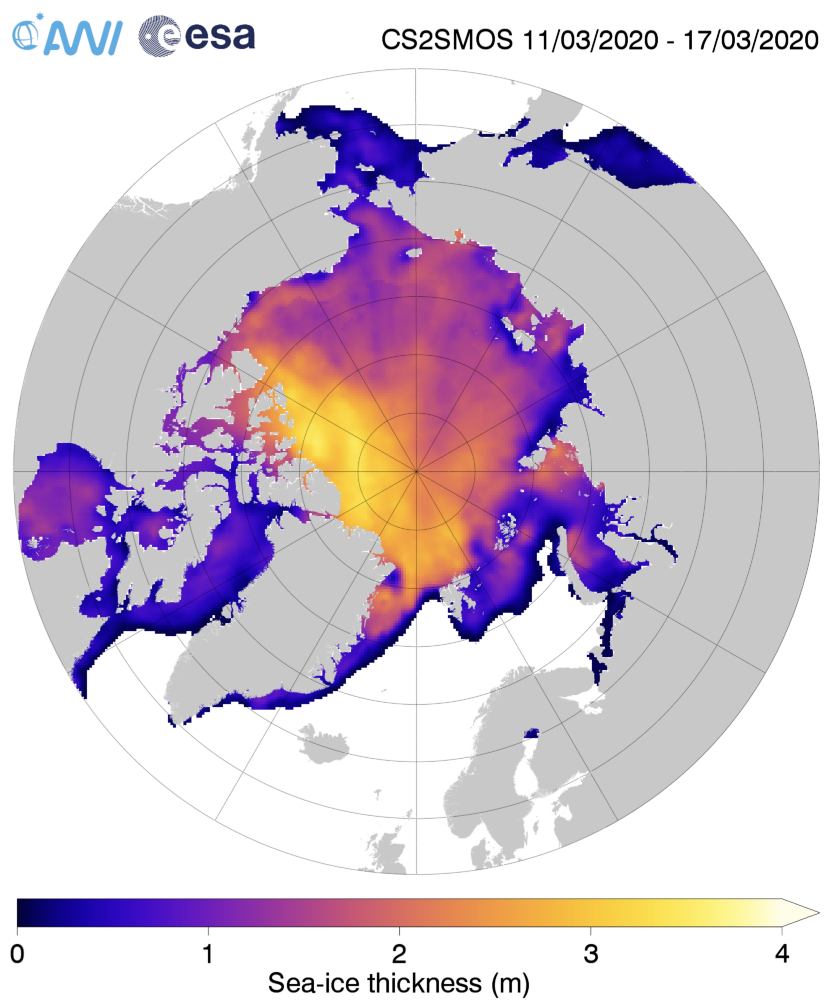
For comparison purposes here’s the current CryoSat-2/SMOS Arctic sea ice thickness map:
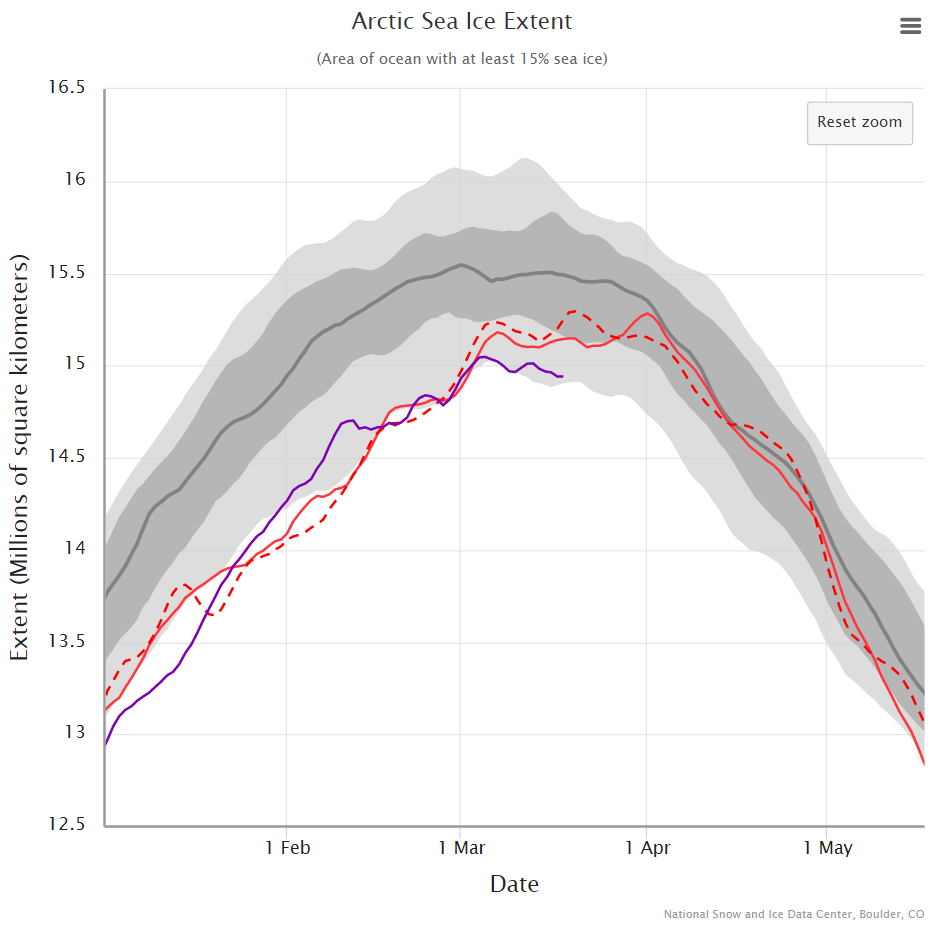
After flatlining for a long time JAXA extent has posted significant declines for two days running. There’s been no official announcement from the NSIDC as yet, but it now seems safe to conclude that there won’t be a late surge in extent similar to 2010. Here’s the current JAXA graph: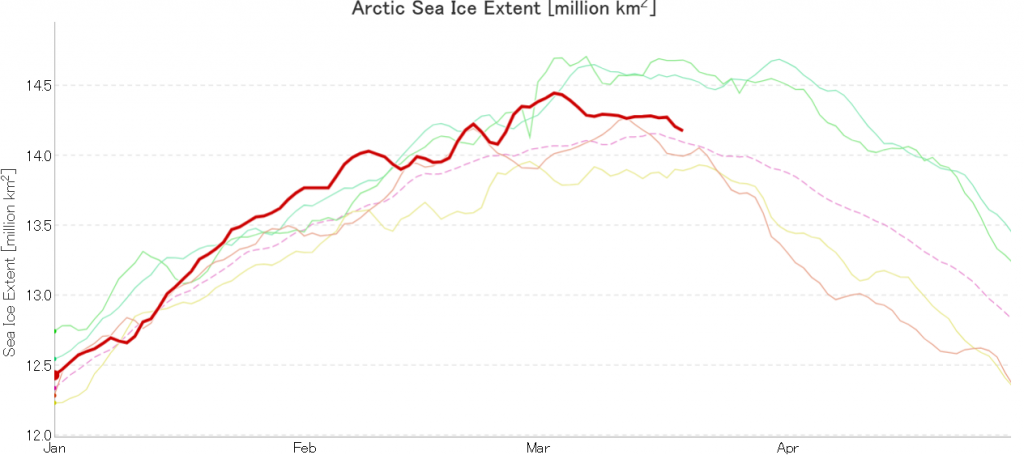
plus NSIDC’s 5 day averaged extent:
Hence the (still provisional!) maximum numbers for 2020 are:
JAXA/VISHOP AMSR2 – 14.45 million square kilometres on March 3rd
NSIDC 5 day SSMIS – 15.05 million square kilometres on March 5th
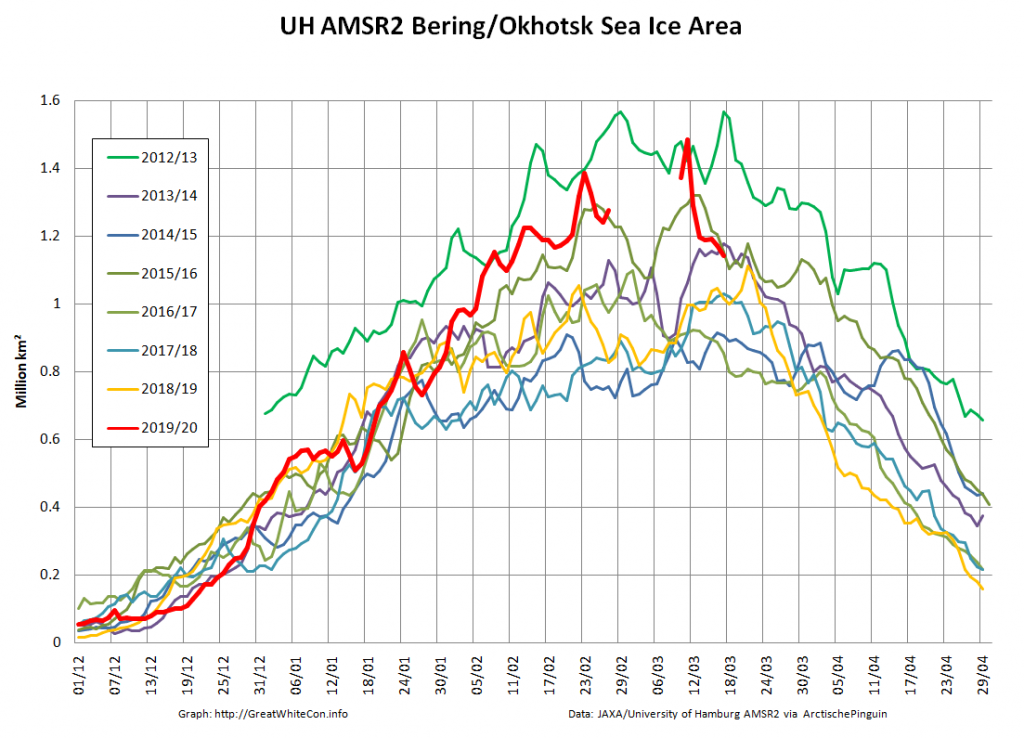
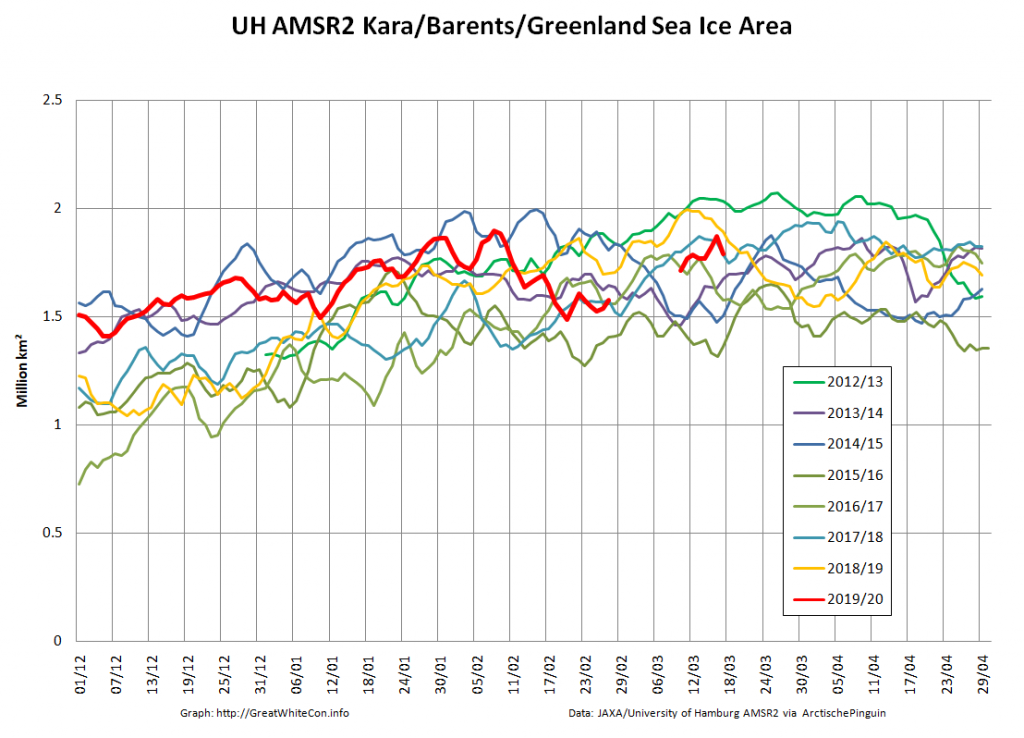
The University of Hamburg’s JAXA AMSR2 concentration data seems to have suffered an outage over the crucial period. Hopefully the gaps will be filled in due course. However more recent regional graphs reveal the following:
The recent declines in overall extent are evidently driven by declines on the Pacific periphery.
Further to a discussion about Arctic temperatures elsewhere, here’s the current DMI temperature graph, together with the freezing degree days graph derived therefrom:
Contrary to assertions in certain circles, the winter of 2019/20 has been pretty run of the mill for the second decade of the twenty first century, and significantly warmer than the long term climatology. Albeit not as warm as the juicy cherry of 2016!
Jim, thanks for the new thread. However, I would urge caution re: your February 27th edit. What ‘passed for normal in the 20th century’ is unknown to us, at least with respect to sea ice extent, and seems to me to be highly unlikely to be the averages in the 1970’s and ‘80s, when it was first measured on a regular basis by satellite.
Not exactly “unknown” Taylor. See for example this:
and/or this:
Ok, ‘not exactly unknown’, just ‘highly speculative’. These graphs (particularly the one back to 1850) would appear to suffer from “MBH98 disease”, the result of splicing reasonably accurate modern records with relatively well known error bars onto historical anecdotal records with less fine resolution and highly variable error bars. In short , my original comment stands. While I appreciate your attempt to illuminate the situation, the graphs you show are inadequate for the purpose. I’ll keep looking for more evidence.
If you come across any more “authoritative” historical records than those I’ve quoted please do not hesitate to let me know.
Meanwhile 2020’s Arctic sea ice extent is currently rapidly heading back towards the “2010’s average”:
https://GreatWhiteCon.info/2020/02/the-2020-maximum-arctic-sea-ice-extent/#Mar-20
Here’s the Rutgers Snow Lab February anomaly graph, now including 2020:
plus their current anomaly map:
The NSIDC have now called the 2020 maximum:
http://nsidc.org/arcticseaicenews/2020/03/no-record-breaker-maximum/
Plus some additional context: