At the beginning of April 2019 all the assorted Arctic sea ice extent metrics are at their respective lowest levels for the date in the satellite record. Just for a change let’s start with the JAXA/ViSHOP graph for April 1st, based on AMSR2 data:

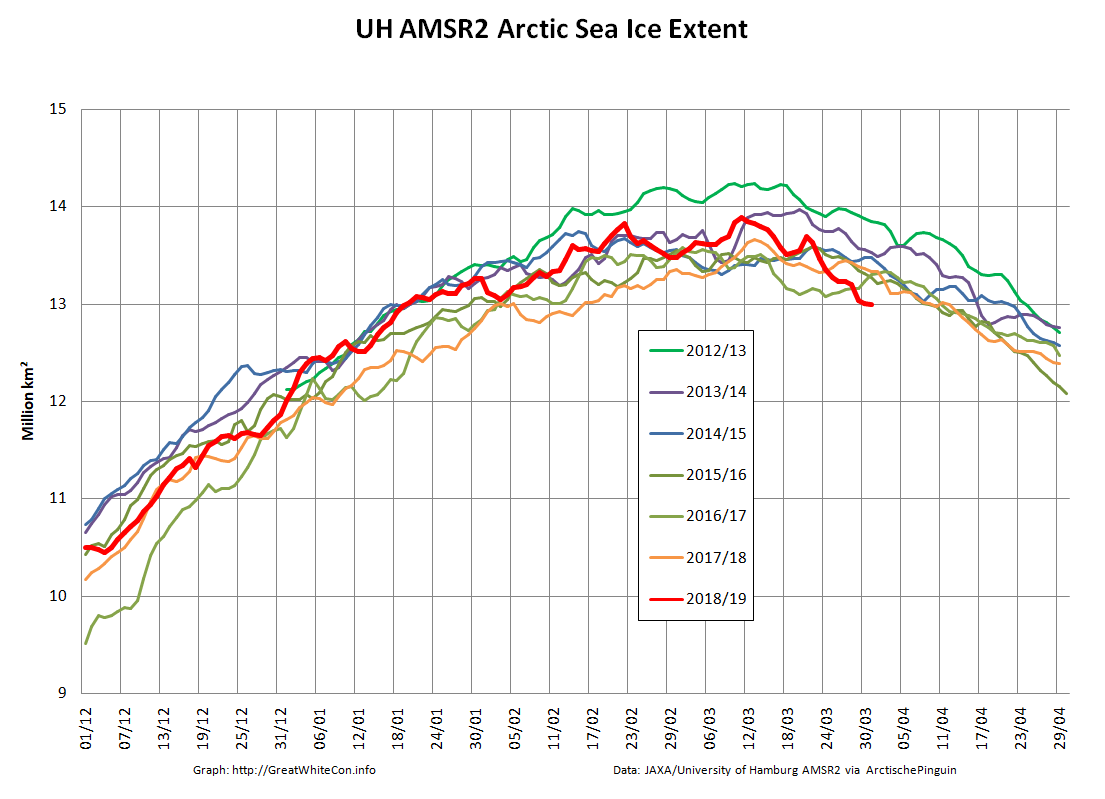
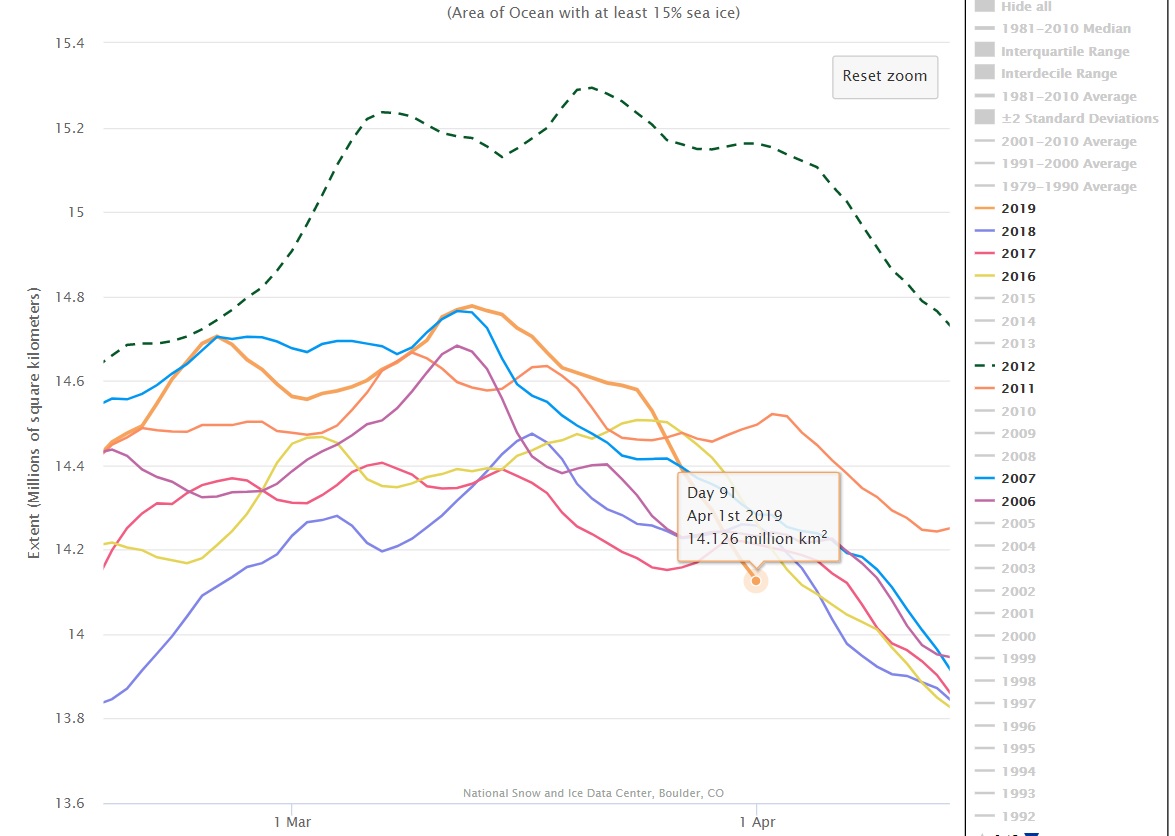
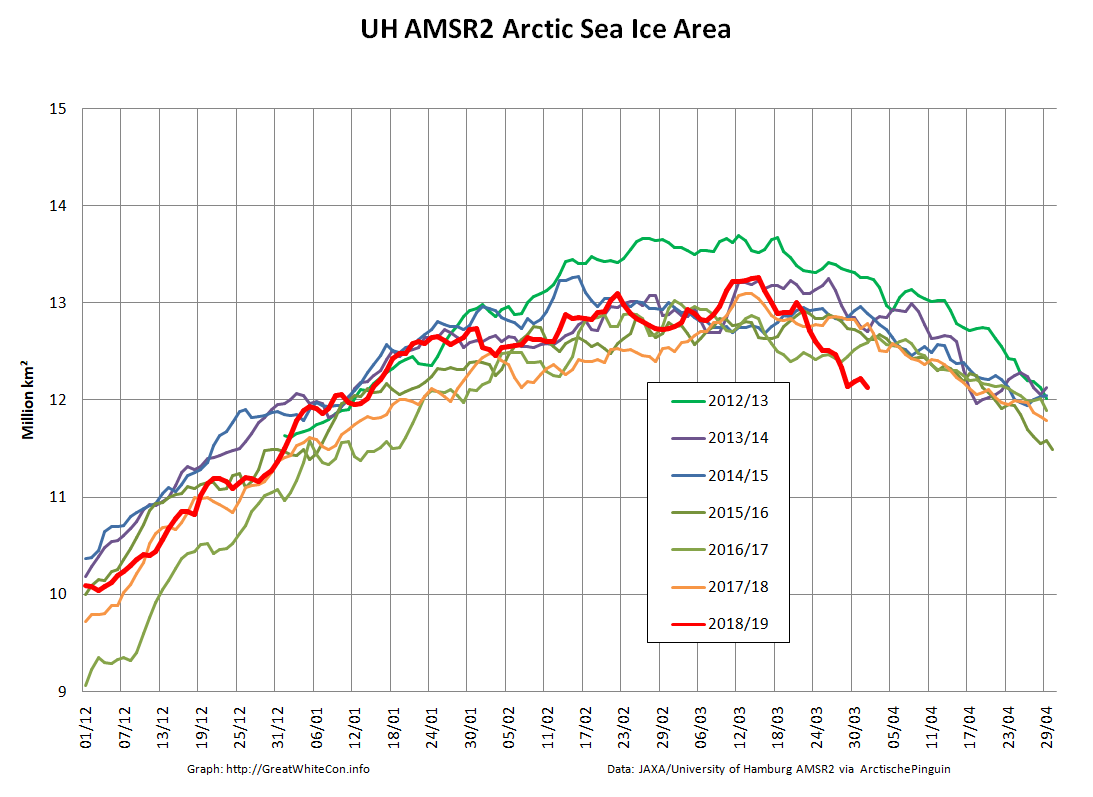
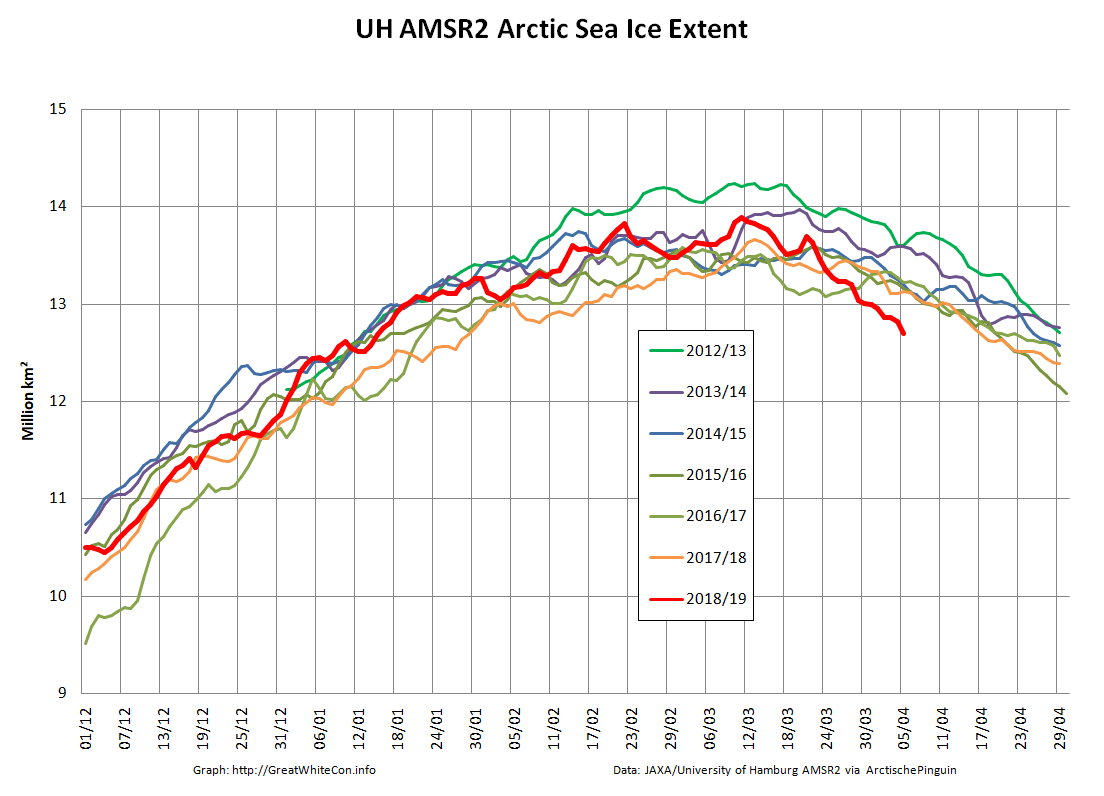
That shows extent apparently on an inexorable decline. However the higher resolution graphs derived by Wipneus from University of Hamburg AMSR2 concentration data reveal that Arctic sea ice extent has changed little over the last couple of days, and area has even increased somewhat:

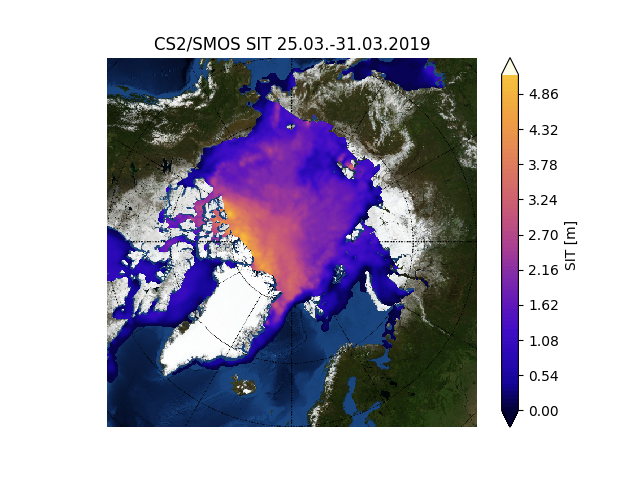
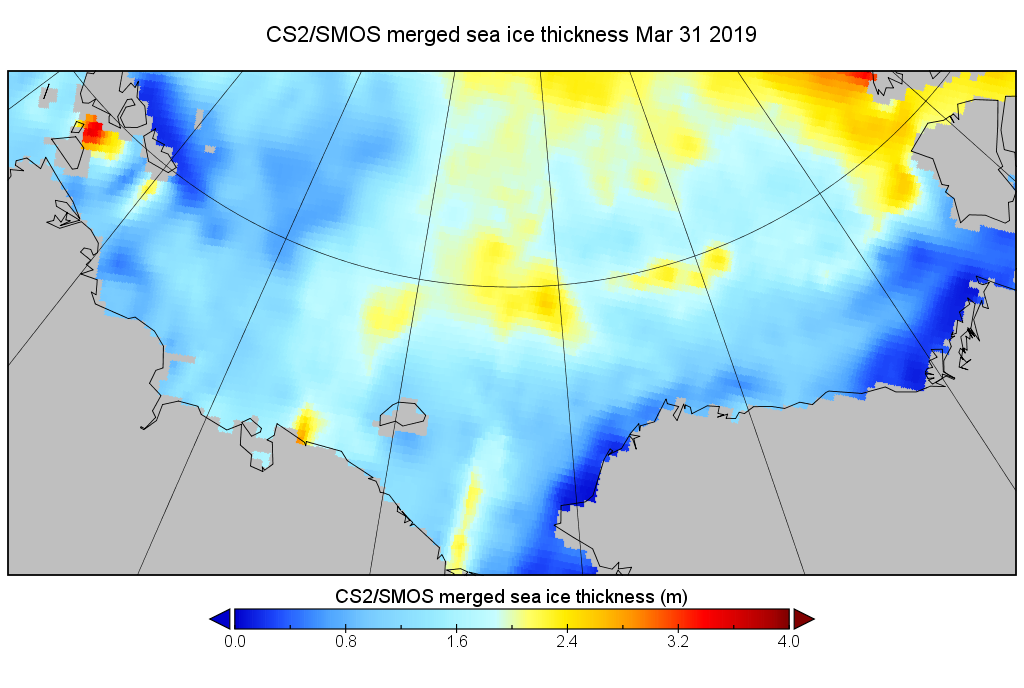
Whilst we wait for Wipneus’ latest PIOMAS thickness and volume update, here’s the gridded merged CryoSat-2/SMOS thickness data from the Finnish Meteorological Institute:
Watch this space for some other extent graphs once they’ve updated to April 1st. In particular the DMI’s version of events will be of great interest, since by way of a little All Fools Day fun I passed on the latest Arctic sea ice news to Tony Heller and the denizens of his “Deplorable Climate Science Blog” yesterday. They were not amused! By way of example, Rah solemnly informed me that:
Tony consistently has used the DMI data as his primary source on the conditions in the Arctic, while you jump to whatever source you think justifies your bias. Get a life. Arctic air temps this year so far have been running below what they were at this time last year.
This is the graph that Steve/Tony used in an attempt to make his point:
Accompanied by his sage thoughts on the matter:
That has to be your lamest cherry-pick on record.
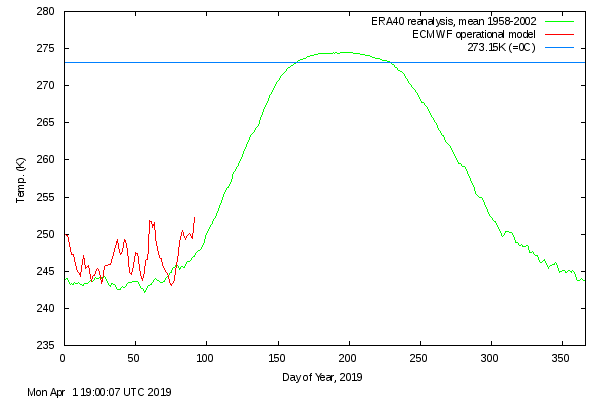
Here too is the latest graph of Rah and Tony’s beloved DMI “Arctic air temps”:
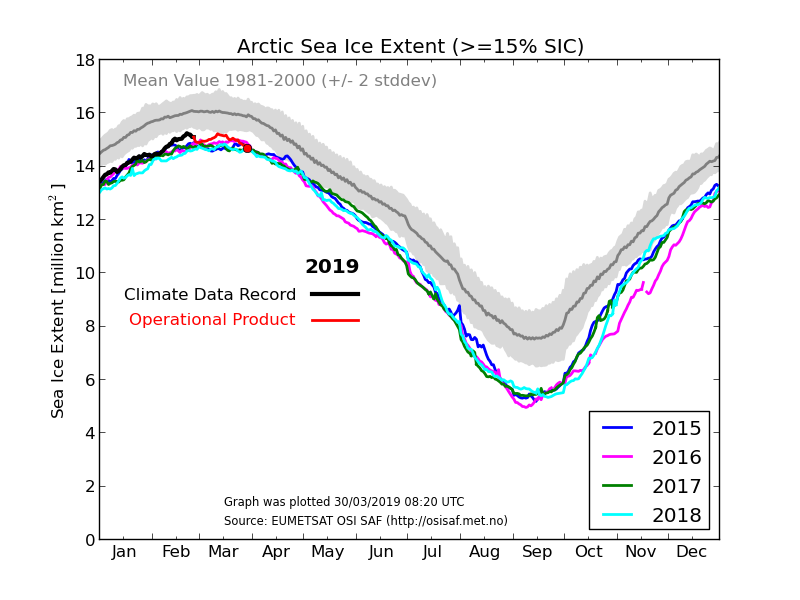
P.S. Here are the April 1st numbers from Steve/Tony’s current metric du jour:

and from the National Snow and Ice Data Center:
Plus the April 2nd DMI “Arctic temperature” graph:

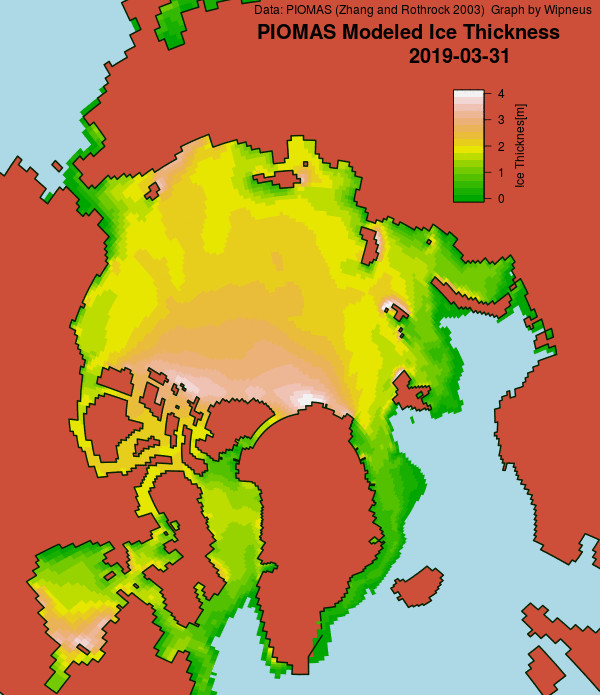
Snow White asked Axel Schweiger nicely on Twitter, and as if by magic the PIOMAS numbers for March have been released, including gridded thickness. Wipneus has crunched them to reveal the following end of March sea ice thickness map:
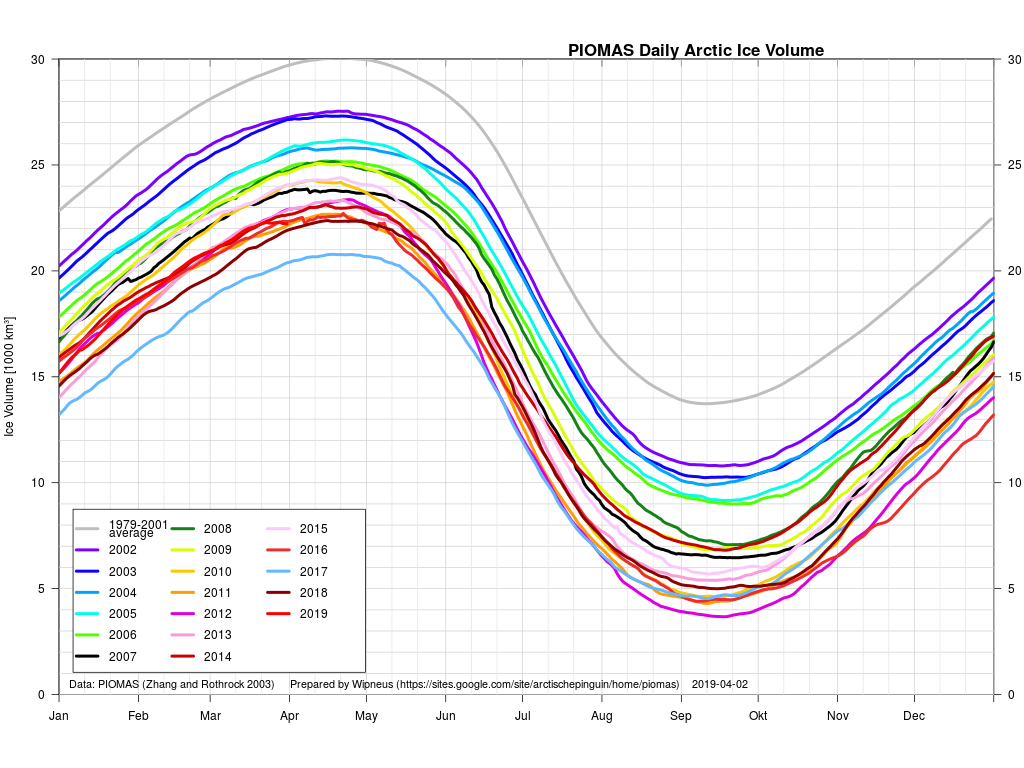
plus a rather unusual volume graph:
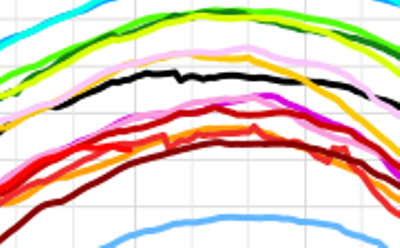
Here’s a closeup view:
According to the PIOMAS model Arctic sea ice volume has been flatlining for the last couple of weeks, and may even have peaked already!
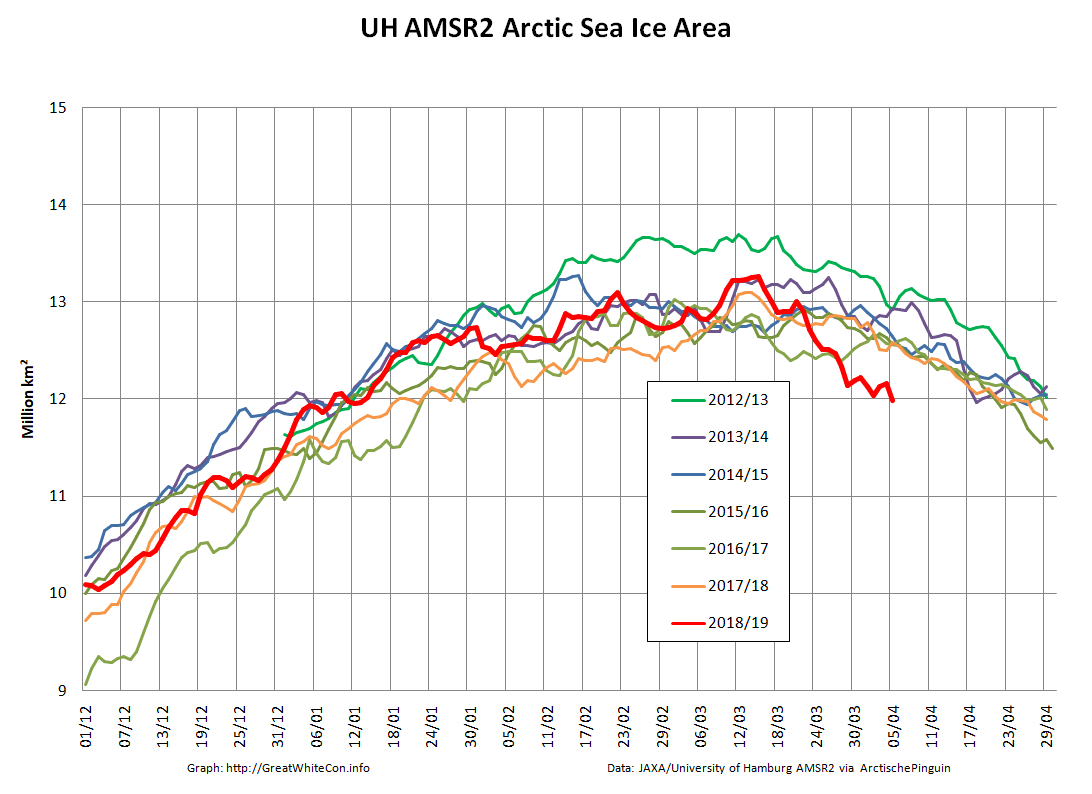
Meanwhile returning to 2 dimensions the decline in area has resumed:
Wipneus’ UH high resolution extent fell another 129k yesterday:
Plus a close up look at the FMI merged Cryosat-2/SMOS thickness for both the Atlantic and Pacific sides of the Arctic:
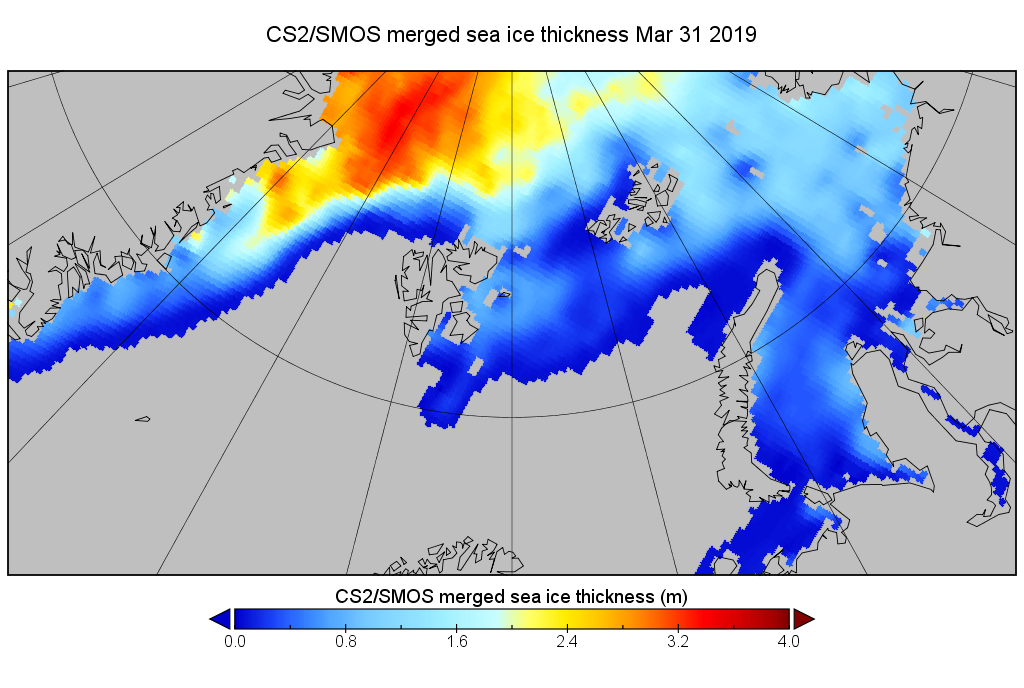
Apart from the usual thick ice queueing for the Fram Strait exit there’s not a lot to prevent the comparatively swift early melt from continuing apace.
Hi Jim
It seems the link “a little All Fools Day fun” is not working, I guess someone doesn’t have a sense of humour?
That’s curious Neville, because it still works for me here in the once Great Britain.
Where are you located when you click that link, and what error message do you see?
Here’s a taste for you:
Tony also uses the DMI ice thickness charts… which to me are at odds with every other ice thickness chart out there, consistently showing ice in late season where satellite photos show open water
People think DMI ice thickness charts are dodgy …
If Steve/Tony had any sense he’d have started using the new FMI thickness product.
However…………
Melting a Million: How fast and how early can we lose the first million km² of sea ice in the Arctic, after the winter ice maximum? Well, 2019 has set new records for both, as you will see in this graph:
https://frozen.earth/2019/04/melting-a-million/
Another “drive by” FE?
I dunno, you’re starting to sound like the deniers of climate change. Maybe change your doctor? 🙂
Thanks for your concern FE, but normal service has now been resumed:
https://GreatWhiteCon.info/2019/05/the-northwest-passage-in-2019/
A long Easter vacation followed by moving to a new hosting provider explains the brief hiatus.
Jim, in the Andrew Slater probability graph(s) what does the extent forecast anomaly mean and why does it change into anomaly persistence when looking at it from an archived point of view?
(I’ve tried to figure it out but it just makes my head go crazy,… so I thought I might ask!)
Jim, are you saying the DMI 80N graphs aren’t worth the address space they’re displayed on?
Also, where can I find the DMI 66N graphs?
Bozzza – The DMI product is heavily weighted towards the North Pole, and there isn’t a >66N version.
The alternative is to roll your own metric using one of the reanalysis products. See:
https://greatWhiteCon.info/2017/07/reanalysis-of-arctic-climate/
Lastly, what does the possibility of a strong el nino look like?
FYI – The latest ENSO forecast from ex Prof. Judy:
Meanwhile the Australian Government Bureau of Meteorology reckon that:
Who saw the graph by oren about BEAFORT SEA ICE VOLUME BY DAY OF YEAR in the forum today?
I’ll go take a look!
Meanwhile, here’s Beaufort Sea ice area:
There’s no sign of a significant slowdown yet:
Another day dawns, and the apparently inexorable decline continues. Here’s JAXA extent:
By way of comparison, here’s Steve/Tony’s metric du jour:
Beaufort sea ice are is extremely interesting.. cheers!
See also the Beaufort/Chukchi thickness above.
Hey! What happened to this site during Easter? Was getting a bit worried for you.