Our old friend Tony Heller has been publishing a glorious Gish gallop of articles showing OSI-SAF Arctic sea ice type maps and claiming amongst other things:
“103% Increase In Multi-Year Sea Ice Since 2008” and
“Extent Of Multi-Year Sea Ice At Ten Year High” and
“Multi-year Arctic Sea Ice Extent At Ten Year High” and
“Multi-Year Arctic Sea Ice Continues At Ten Year High“.
The most recent episode in the long running series is entitled “Multiyear Ice Extent up 116% Over The Past Decade“, wherein Tony claims that:
A decade after declaring the end of Arctic multi-year sea ice, it has increased 116% and now covers nearly half of the Arctic.
That is of course not true. In actual fact it’s an “alternative fact” par excellence!
I have been endeavouring to point out to Tony the error of his ways for weeks now, but my words have wisdom have fallen on deaf ears. My graphic graphics have been viewed only by “snow blind” eyes. My incontrovertible arguments have been misapprehended by purpose built dumb and dumberer wetware illogic. By way of example, here’s a refreshingly ad hom free riposte from a typical commenter:
Jimmy Boy actually thinks his honesty and integrity are equally to that of Anthony Watts???

No doubt we’ll get around to discussing Anthony Watts “honesty and integrity” again soon, but for now let’s see if we can finally set this particular badly warped record straight shall we?
Here is the latest OSI-SAF ice type map, for March 16th 2017:
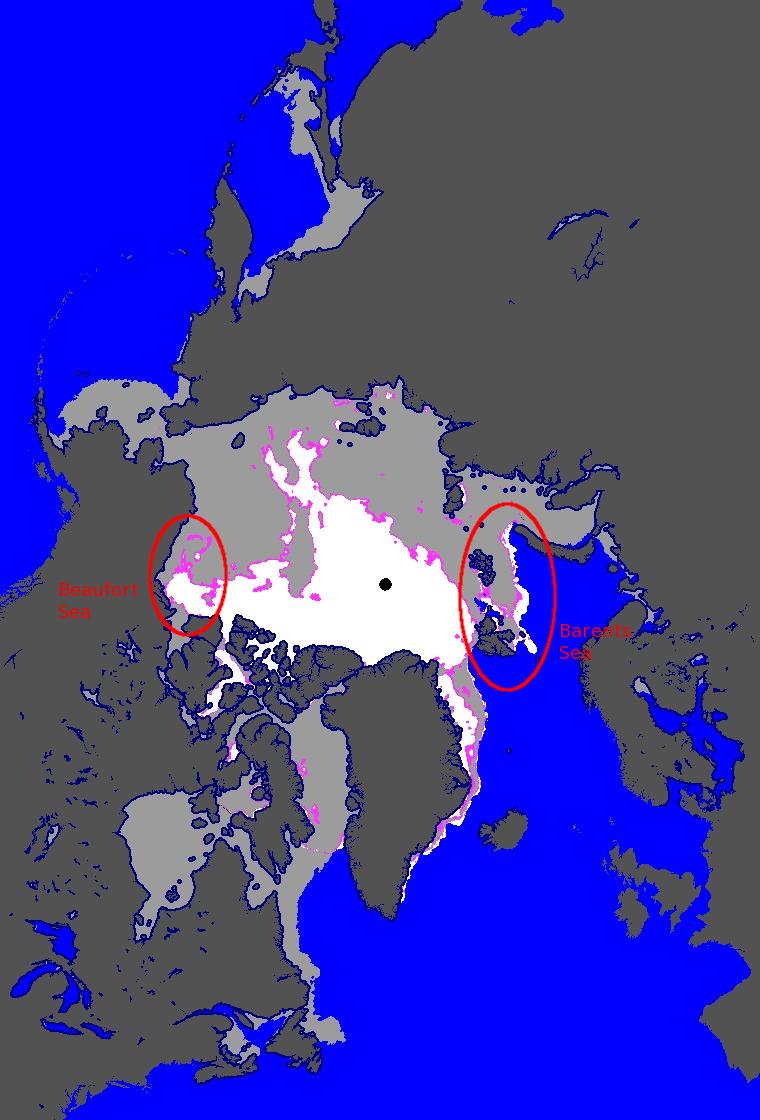
The highlighted area on the left is the Beaufort Sea to the north of Canada. If you’re not “snow blind” you can no doubt readily perceive a large area of allegedly “multi-year sea ice” coloured white. Let’s now take a look at the most recent Canadian Ice Service map of the same area, for March 13th 2017:
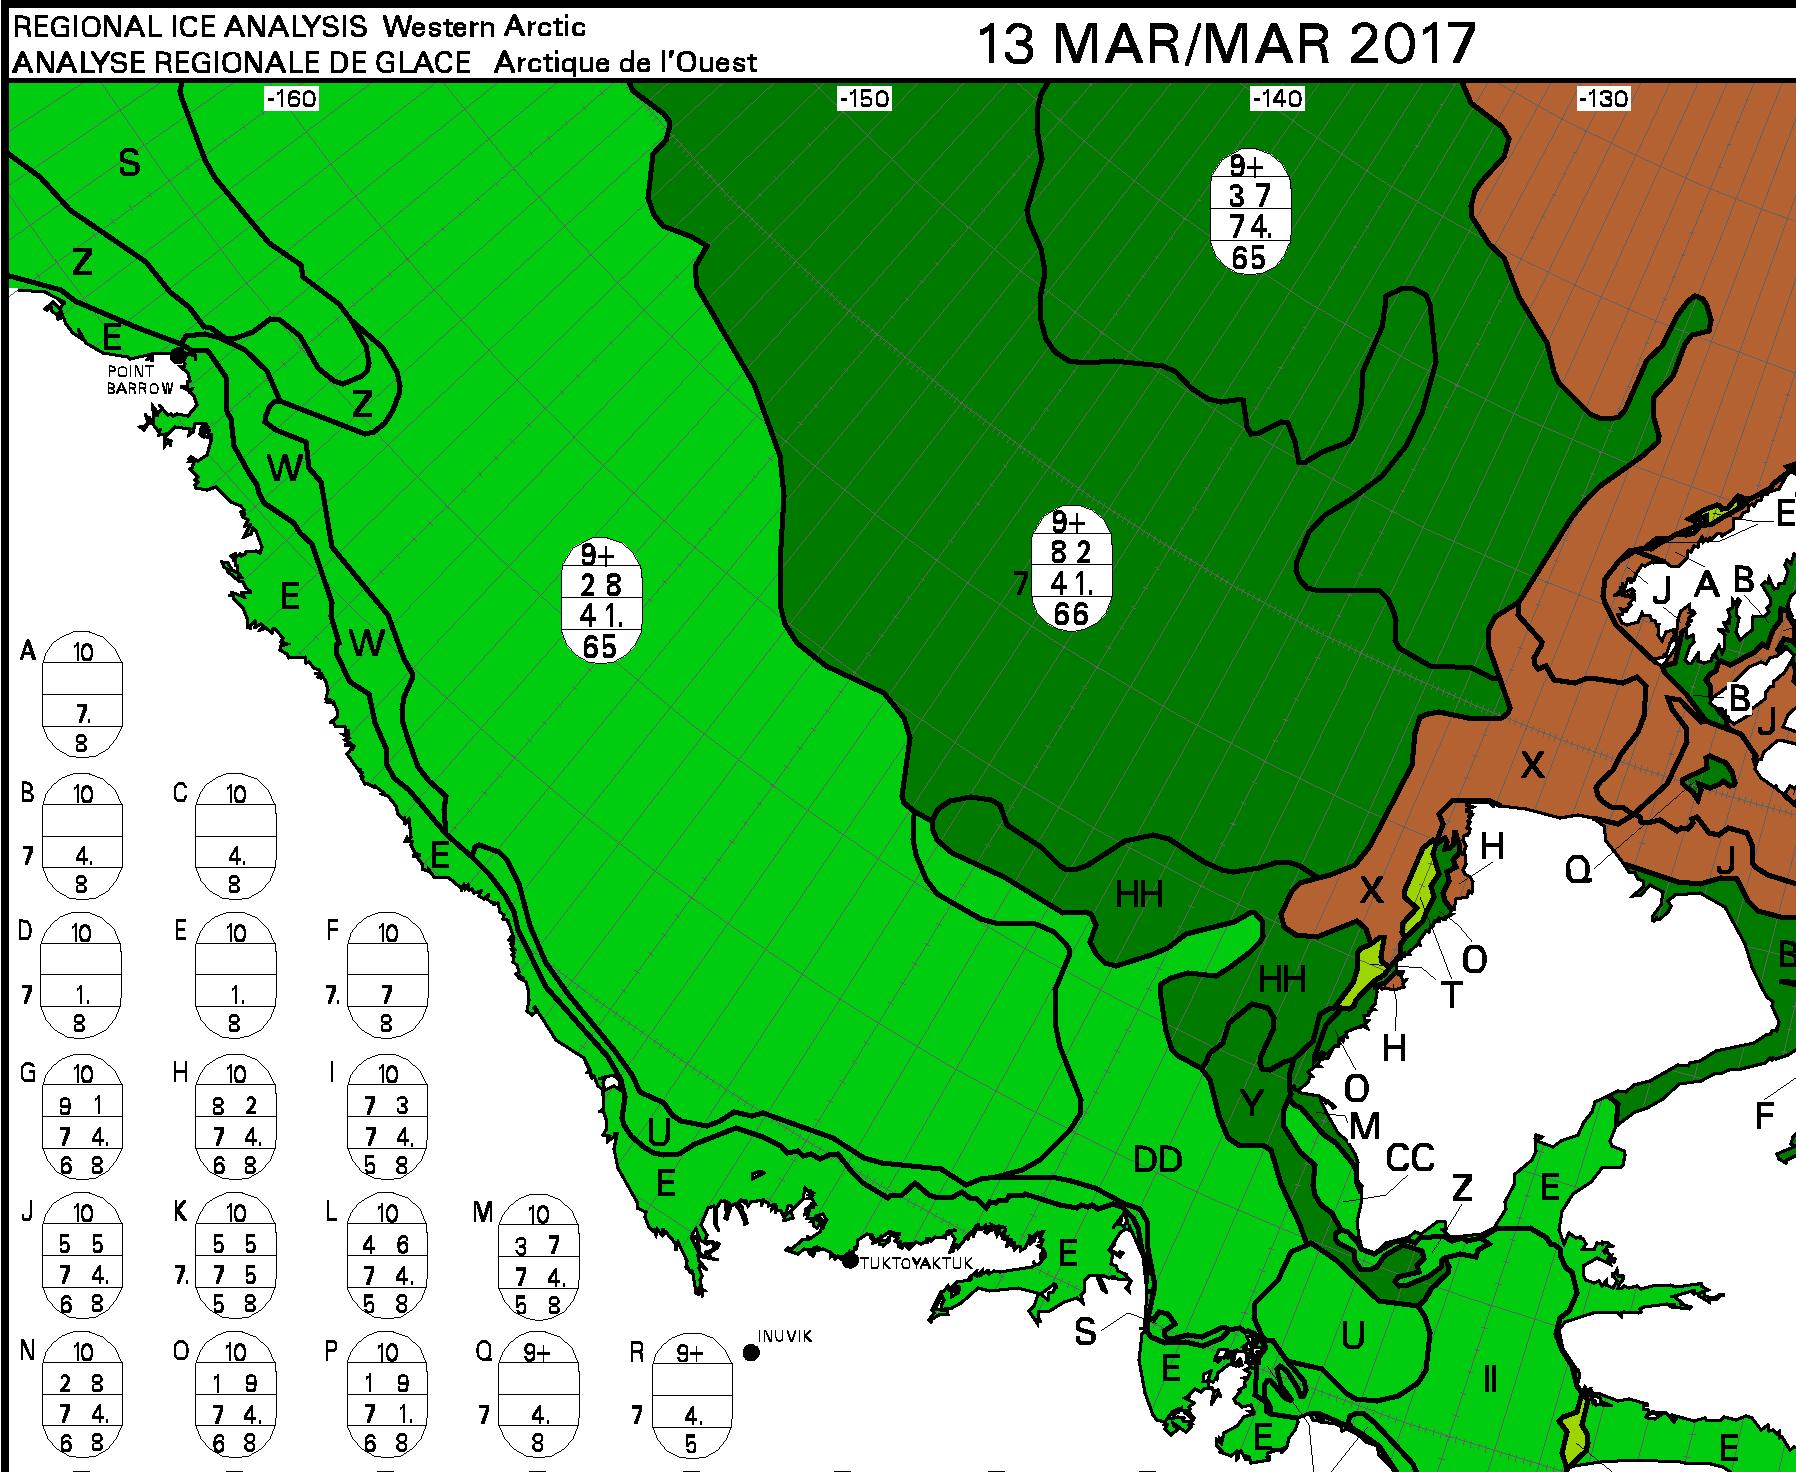
Can you see a large area of brown “old ice” covering most of the surface of the Beaufort Sea?
Now let’s take a look on the other side of the Arctic at the area north of the Barents Sea. Can you see a large area of allegedly “multi-year sea ice” coloured white inside the red ellipse on the OSI-SAF map? Next let’s take a look at the most recent University of Bremen SMOS map of the Arctic, for March 15th 2017:

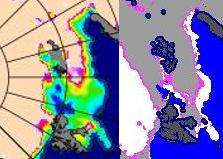
On this map the brightly coloured areas show sea ice that’s less than 50 cm thick. Even when two people explain this point slowly to them the “deplorable denizens” at Mr. Heller’s blog do not manage to get the message! So now let’s look at a closeup comparison between the OSI-SAF ice type map and the University of Bremen SMOS sea ice thickness map:
As I popped the question to the deplorable denizens over on Tony Heller’s Deplorable Climate Science blog:
For anybody else here who isn’t deaf, dumb and blind, please note all the young, thin sea ice around Svalbard identified by SMOS that OSI-SAF currently classifies as “multi-year” ice.
At the risk of (repeating myself)^n, n → ∞:
Why do Tony, Tommy and Andy persist with this nonsense?
We won’t get fooled again! Will we?
https://youtu.be/ZgubG-MOPT4
Amazing isn’t it. I give you koodo’s for trying to set these people straight. A bit like beating a dead horse though. Gotta wonder if it’s worth your effort. A little observation about the OSI-SAF ice map. If the ice that shows up grey in the Gulf of St, Lawerence between the Gaspe and Cape Breton is the same as the ice showing grey else where, we’re in big trouble. I live in Nova Scotia and can say that that grey area in the gulf wouldn’t hold back a dory powered by oars.
You’re very kind Red!
I persevere because this is all part of a little research project I’m working on currently:
https://www.researchgate.net/project/Alternative-Facts-in-the-Arctic
Which reminds me. I’ve been so busy researching recently that I have to try and catch up with a considerable documentation backlog!
The grey area ought to be a region with sea ice concentration >= 15%. Does your “backyard” not satisfy that criterion?
Oh it does but the density is that of slush. This ice if you can call it that wasn’t there 10 days ago and one or two mild days will remove it. That’s my point. Its not ice that would hold anything much heavier than a gull. Satellites are easily fooled it would seem. I’m not saying that the grey ice north of 60 is of the same quality but a portion of it may well be of less integrity than we would hope for.
The Spring sun seems to be getting to some of that stuff now. JAXA extent just fell by over 200K in two days:
https://greatWhiteCon.info/2017/02/the-2017-arctic-sea-ice-maximum-extent/#Mar-18
Yes the extent is a bit concerning already!
I can’t help but wonder how much is really due to ocean heat. The sun will cause melt no argument, but the low angle that it is at this early would suggest that it’s keeping the atmosphere from cooling enough to hold that ice for a few weeks longer yet. As most who are interested know, the freezing season never really got into full swing this past winter. If insolation had a lot to do with it I would expect to see more brown on the continents than there appears to be. The sun being higher at those lower latitudes would be stronger there than in the Arctic, no? Plus a little bare ground quickly gives way to more due to albedo.
Red – But ice in the Sea of Okhotsk and St. Lawrence gets almost as far south as 45N. Surely freezing versus melting of the “slush” you describe is very finely balanced thereabouts at present?
Snow cover is in amongst the pack of recent years, but currently falling fast:
The snow is interesting for sure. The fact it is in the middle +/- and the sea ice is looking crippled says something in itself. As for here the melt is pretty much on at this point. From here on we should steadily see more warmth. As for comparing the Gulf of ST. Lawrence to the Sea of Okhotsk would be kind of like comparing the UK to Labrador. Same latitude more or less. The Okhotsk is wide open to the Pacific and the gulf is quite constrained as well as being less saline (I would think) due to the fresh water supply from the great lakes.
This link shows the extent and quality of ice at present in the gulf. Most of it is grey first year ice (FYI). The best we have is a small amount of medium FYI.
The seals of the gulf have been birthing on land the last number of years because there isn’t enough strong ice to hold them. For some past context the following link shows the average sea ice concentration in the gulf. Click the date and it will show the coverage based on the 1981-2010 average.
http://iceweb1.cis.ec.gc.ca/30Atlas/page1.xhtml?grp=Guest&lang=en
I hope the links work!
[I took the liberty of embedding the CIS chart – Jim]
Just thought I’d try to show the NASA shots of the gulf on the 18th for comparison to the Canadian Sea Ice Chart. If I haven’t buggered it up I’ve also included the shot of the gulf one week later. You can see how little ice there really is and how much less one week later, to spite the fact that the week has been relatively cool. The first image is the 18th, the second is the 25th.
https://gibs.earthdata.nasa.gov/image-download?TIME=2017077&extent=-66.1640523245941,45.80899162197929,-58.473622637094095,50.45840568447929&epsg=4326&layers=MODIS_Aqua_CorrectedReflectance_TrueColor,Coastlines&opacities=1,1&worldfile=false&format=image/jpeg&width=1750&height=1058
https://gibs.earthdata.nasa.gov/image-download?TIME=2017084&extent=-66.1640523245941,45.80899162197929,-58.473622637094095,50.45840568447929&epsg=4326&layers=MODIS_Aqua_CorrectedReflectance_TrueColor,Coastlines&opacities=1,1&worldfile=false&format=image/jpeg&width=1750&height=1058
Comparing the first image to the chart you can see how the chart may lead one to think the ice is in better shape than it really is.
A question: Is an El Nino starting? On another note I find the people Tony’s web site rather abusive; so be it. alf
Evenin’ Alf (UTC),
The Australian Bureau of Meteorology ENSOmeter is currently on El Niño “watch”, so in answer to your first question, quite possibly:
http://www.bom.gov.au/climate/enso/outlook/archive/20170314.archive.shtml
Regarding your final point, I would classify the deplorable denizens as “extremely abusive”! Assuming you’re the same Alf, their response to your point about putting off passers by seemed to fall on utterly deaf ears.
Jim; it is scary to think that people can show such raw emotion in some stupid blog. I am afraid to think what people like that would be like if they had the liberty to take action against people with whom they vehemently disagree. alf
Alf,
As regards the formation of another el Nino, the Australian BoM and NOAA tend to be close, but not identical.
I would suggest that you might care to peruse…
https://www.climate.gov/news-features/department/enso-blog
NOAA’s rolling 3-month numbers for the Nino3.4 Region are given in…
http://www.cpc.noaa.gov/products/analysis_monitoring/ensostuff/ensoyears.shtml
Whereas their actual monthly values are here…
http://www.cpc.noaa.gov/products/analysis_monitoring/ensostuff/detrend.nino34.ascii.txt
I suggest that the sea ice has become the primary sink for for the heat in water vapor that finds its way into the north. In the past, that heat was radiated into space, but now is trapped by water vapor acting as a greenhouse gas. Thus, atmospheric transport of water vapor north and from the North Atlantic Drift has has become a larger factor in the condition of the ice and angle of the sun and albedo have become smaller factors.
Quite so Aaron. See for example:
https://greatWhiteCon.info/2016/11/nasa-researches-storm-frank-in-the-arctic/
and
https://greatWhiteCon.info/2016/12/arctic-sea-ice-news-from-agu/
I fear he knows the numbers are false because he made them up, with the dedication of a professional writer writing stories for a commercial news letter. Whether he is actually being paid is another question. He may simply believe in “God’s Covenent”. Which ever, being truthful is not likely his goal.
Our problem is that we think people are honest. Used car salesmen, folks that run golf courses, the Kock Brothers, and Russian oligarchs are not honest.
If the dishonest get some of his nonsense published in a newspaper, he can suck up hours of your time, when you could be doing more useful things. Liars only need a few such trouble makers to make a good bit of trouble.
My guess is that it is possible to hire folks in Eastern Europe to put up fake news (climate info) for 10 Euros per day. If so, perhaps we should hire some to seek out fake news and post corrections. It might be a better use of our resources.
I do not suffer from the delusion that the likes of “Goddard”, Bannon or the Daily Mail Group are honest!
Are you aware that in its current war on evidence driven policy making the House Committee on Science, Space & Technology quotes the likes of Delingpole, Rose and Curry?
Are you also aware that in his recent ramblings “Goddard” claims that:
Assuming one were to implement your cunning plan in an attempt to counter this tsunami of “alternative facts” the question then is what should one instruct one’s mercenary army of robotniks to write, and where should one instruct them to write it?
More news on those robotniks:
http://www.mcclatchydc.com/news/politics-government/white-house/article139695453.html