Monthly Archives: September 2016

Could Northabout Sail to the North Pole?

No is the obvious answer just at the moment, since the plucky little yacht is currently parked at a pontoon in Tuktoyaktuk. However actual facts aren’t sufficient to stop Tony Heller suggesting that Andrew Freedman suggested on Mashable that Mark Serreze of the NSIDC said that such a feat is feasible:

Mark “Arctic Is Screaming” Serreze says the Ship of Fools could sail to the North Pole.

Tony (AKA (m)Alice) attempts to justify his scurrilous allegation by referencing Andrew’s recent article entitled “After unusual Arctic storms, sea ice coverage in region is plummeting“. According to Andrew:

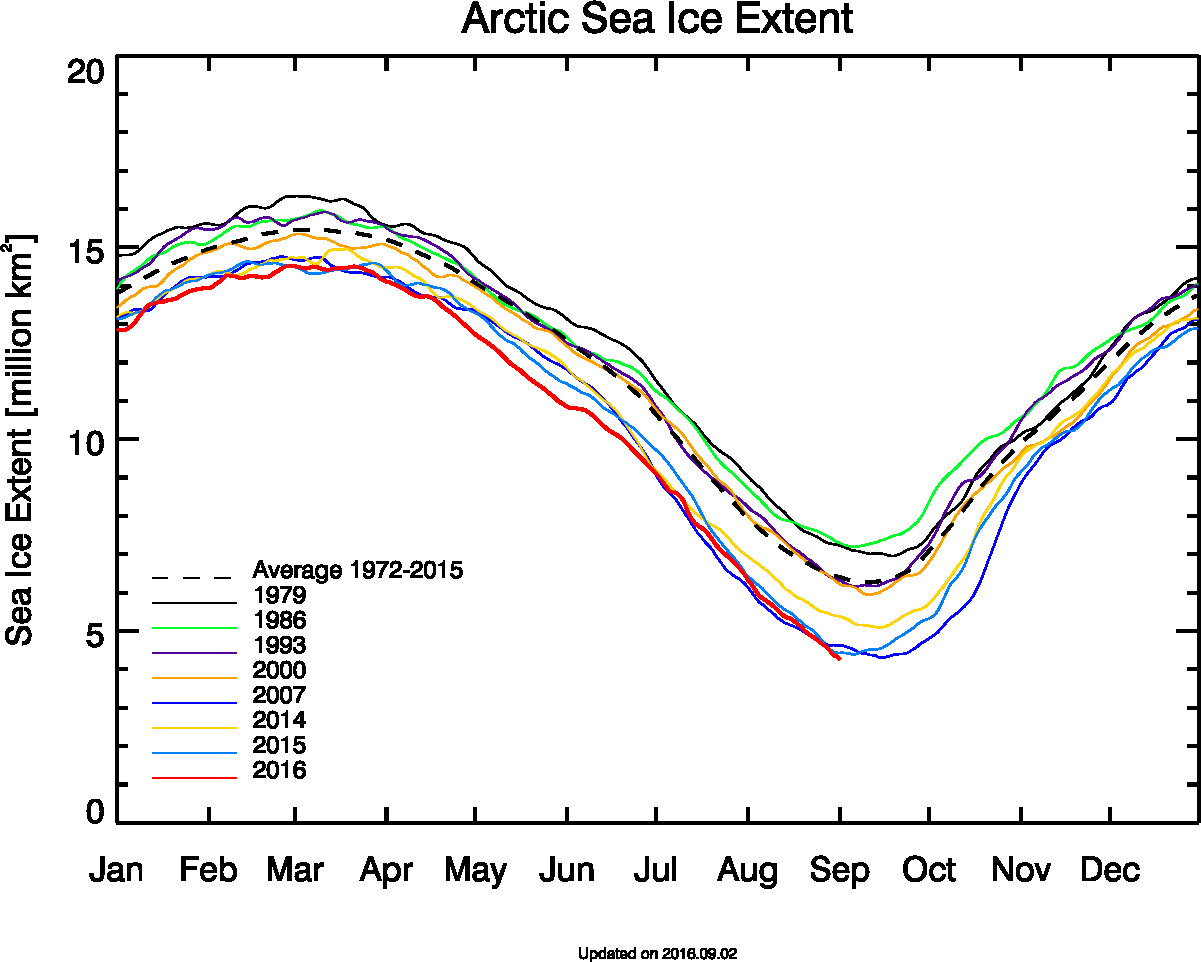
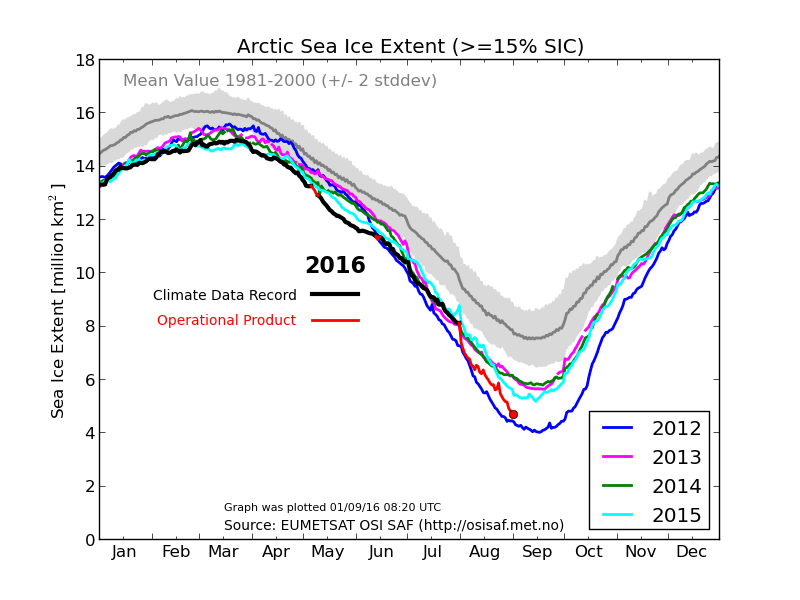
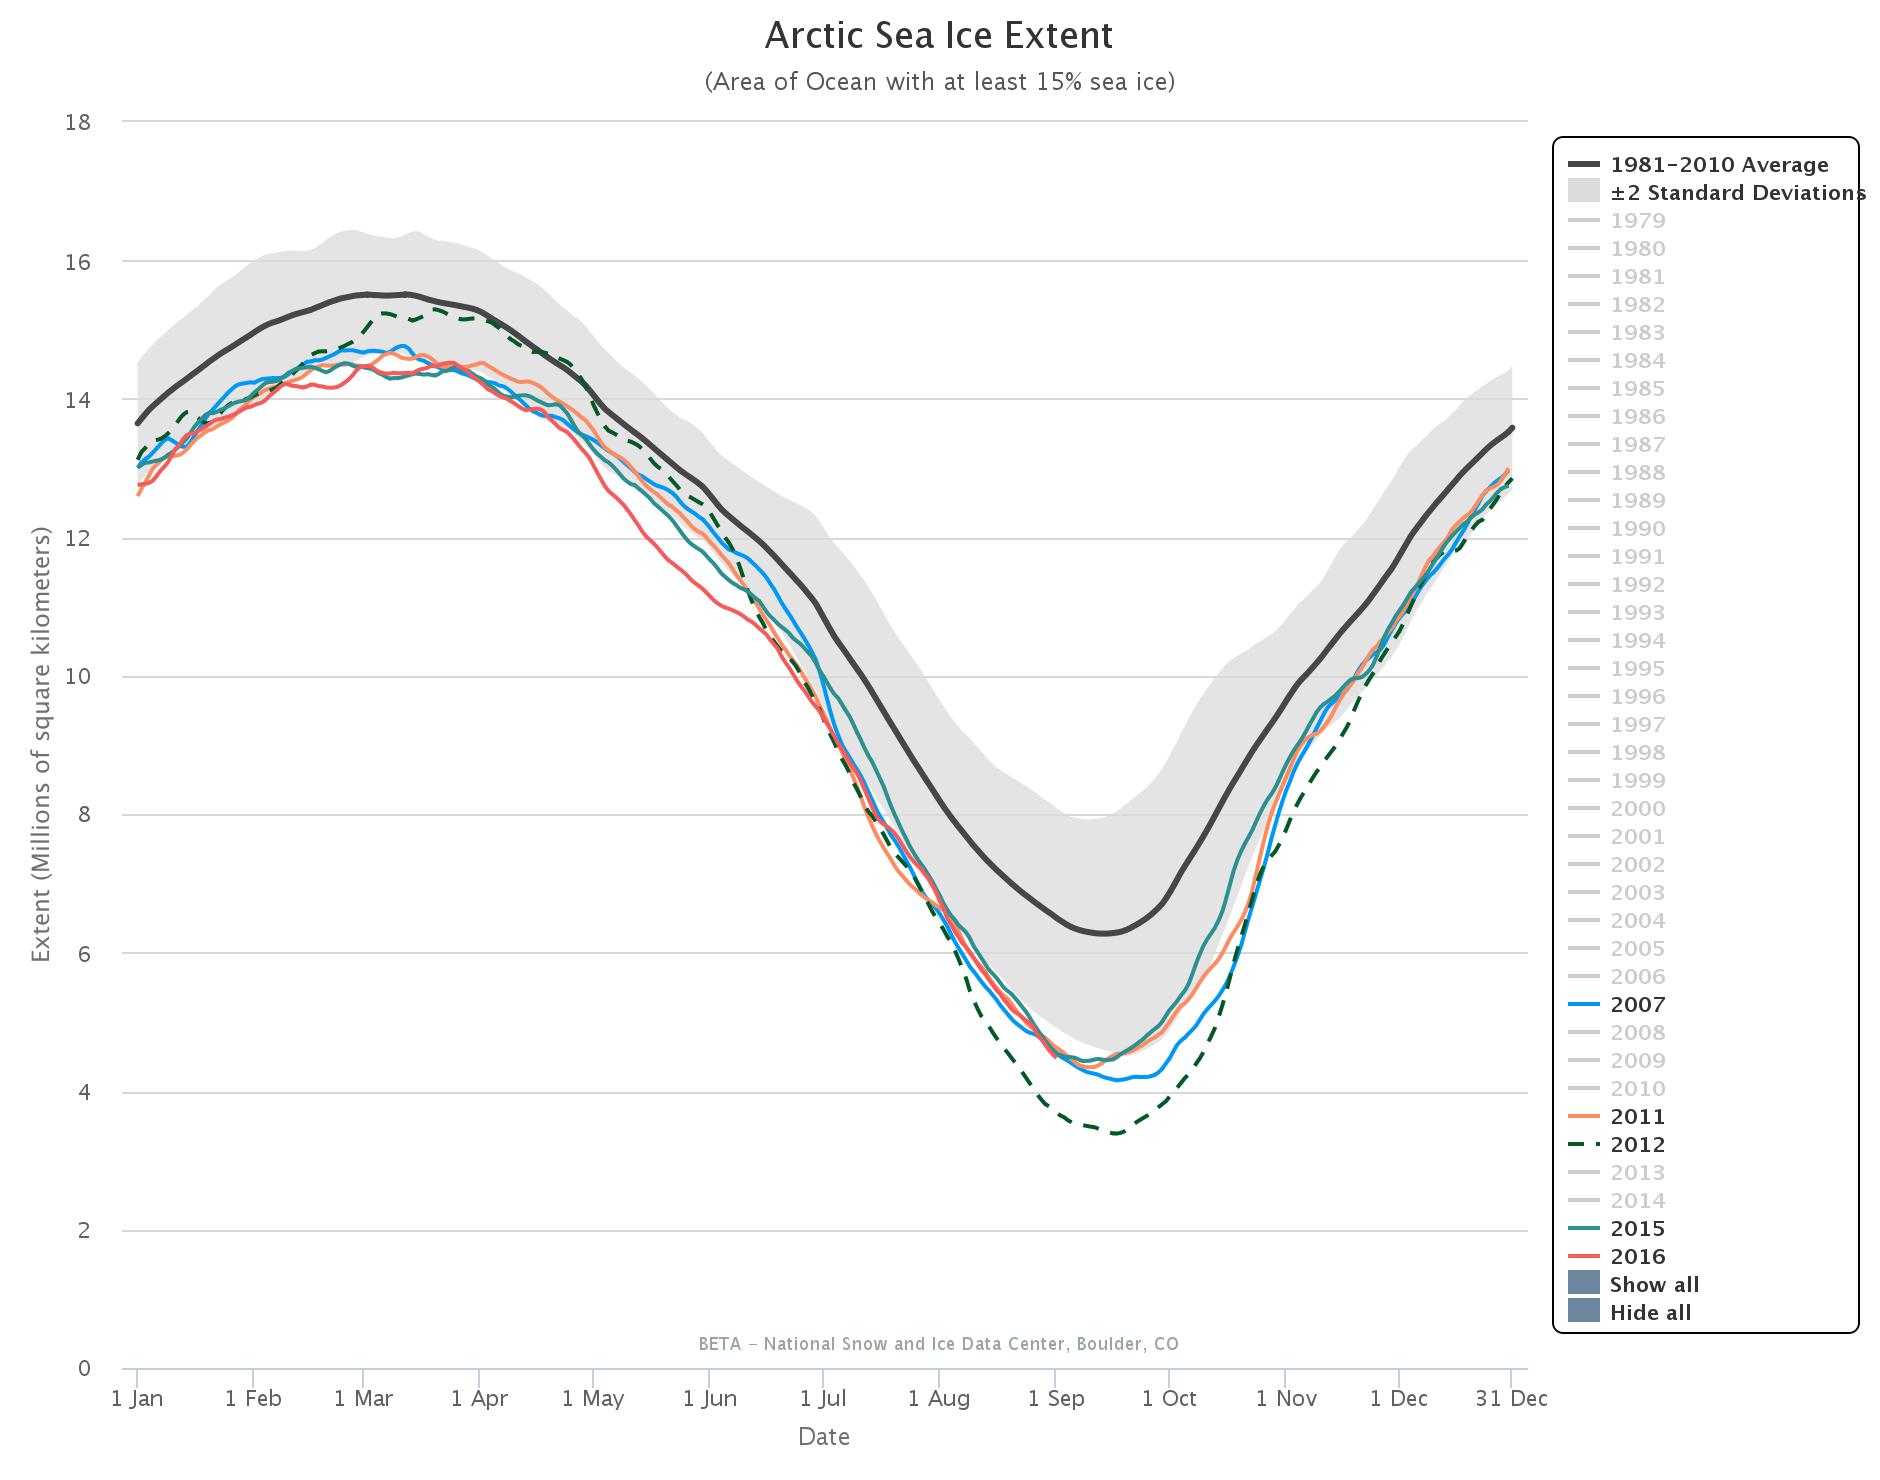
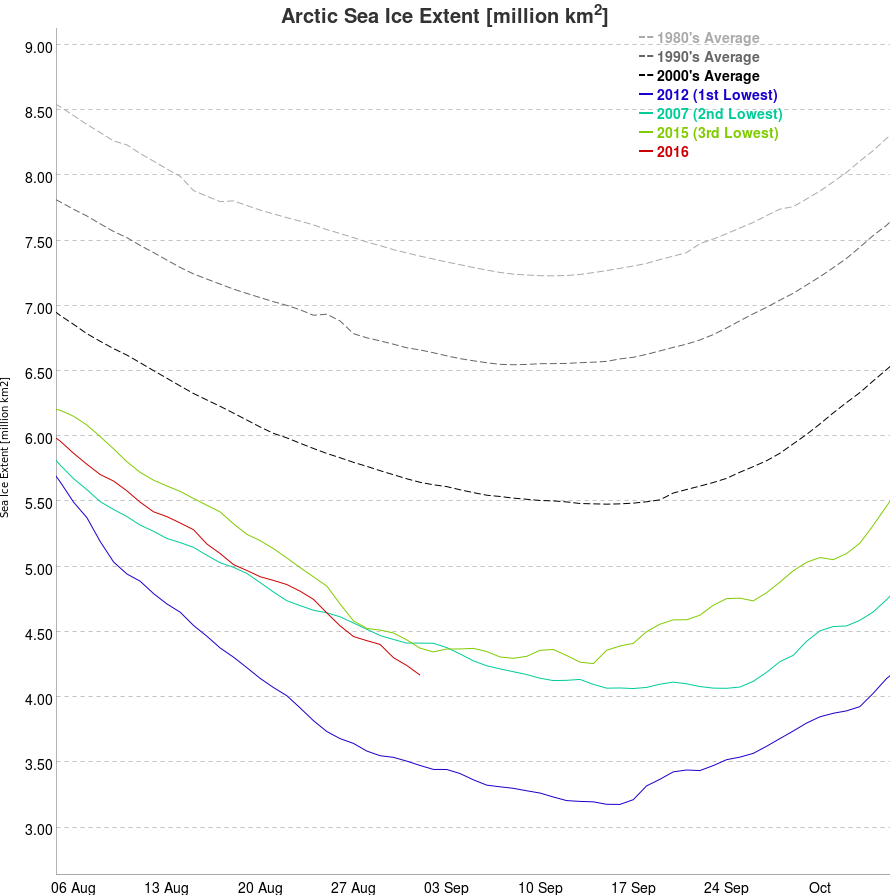
In an interview with Mashable, Serreze said sea ice coverage across the different regions of the Arctic has fallen dramatically in association with a series of unusually powerful summertime Arctic storms during August.

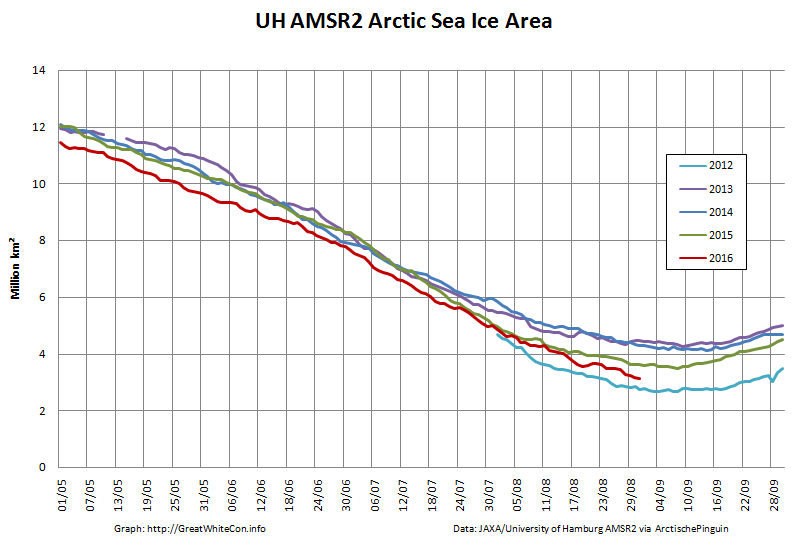
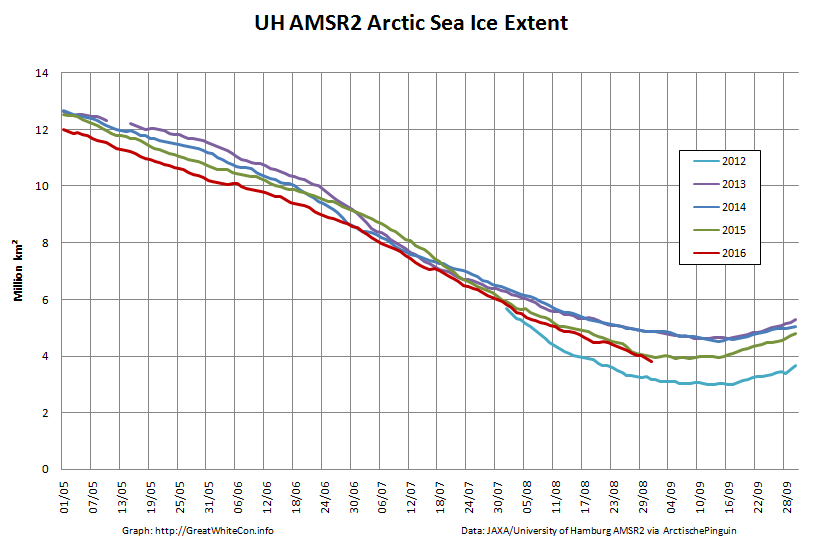
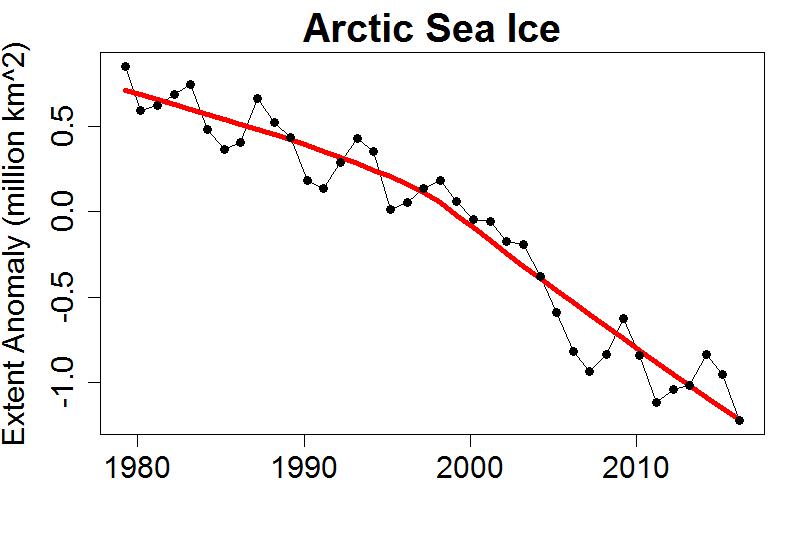
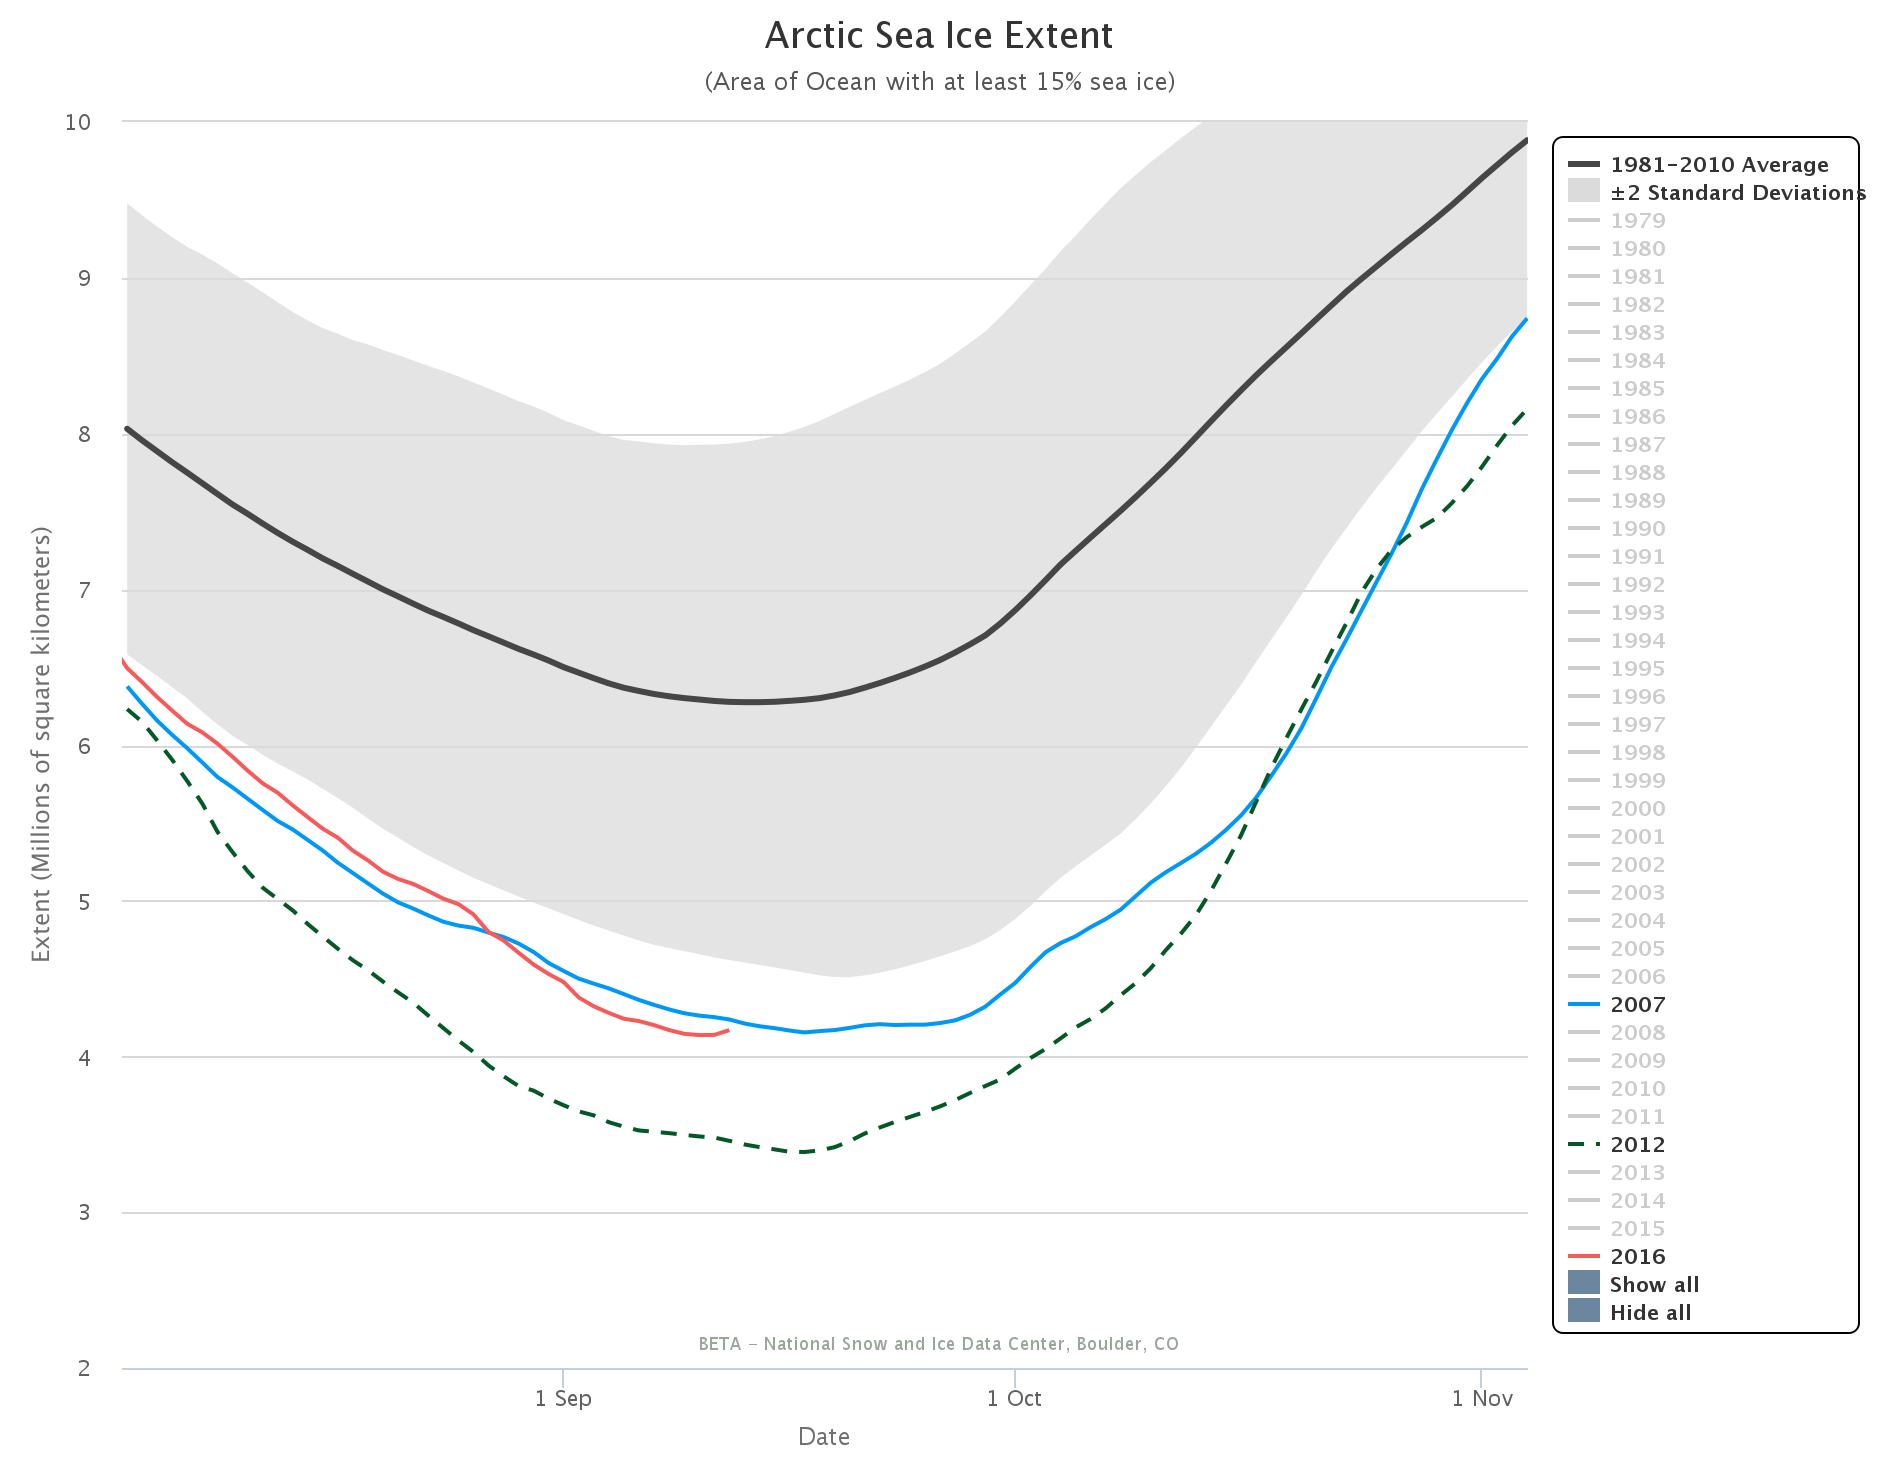
That much is certainly true, as we here at Great White Con have documented in detail. Mr. Heller however highlights this section of Mr. Freedman’s article:

In fact, if they want to, the Hempleman-Adams and the rest of the ship’s crew could actually sail nearly all the way to the North Pole, since sea ice cover is largely absent to about 86 degrees north, according to Mark Serreze, director of the National Snow and Ice Data Center (NSIDC) in Boulder, Colorado.

It’s not out of the question that the North Pole will become a geographical marker in open water, rather than ice cover, sometime in the next few weeks.

Serreze called this situation “pretty darned unusual.”

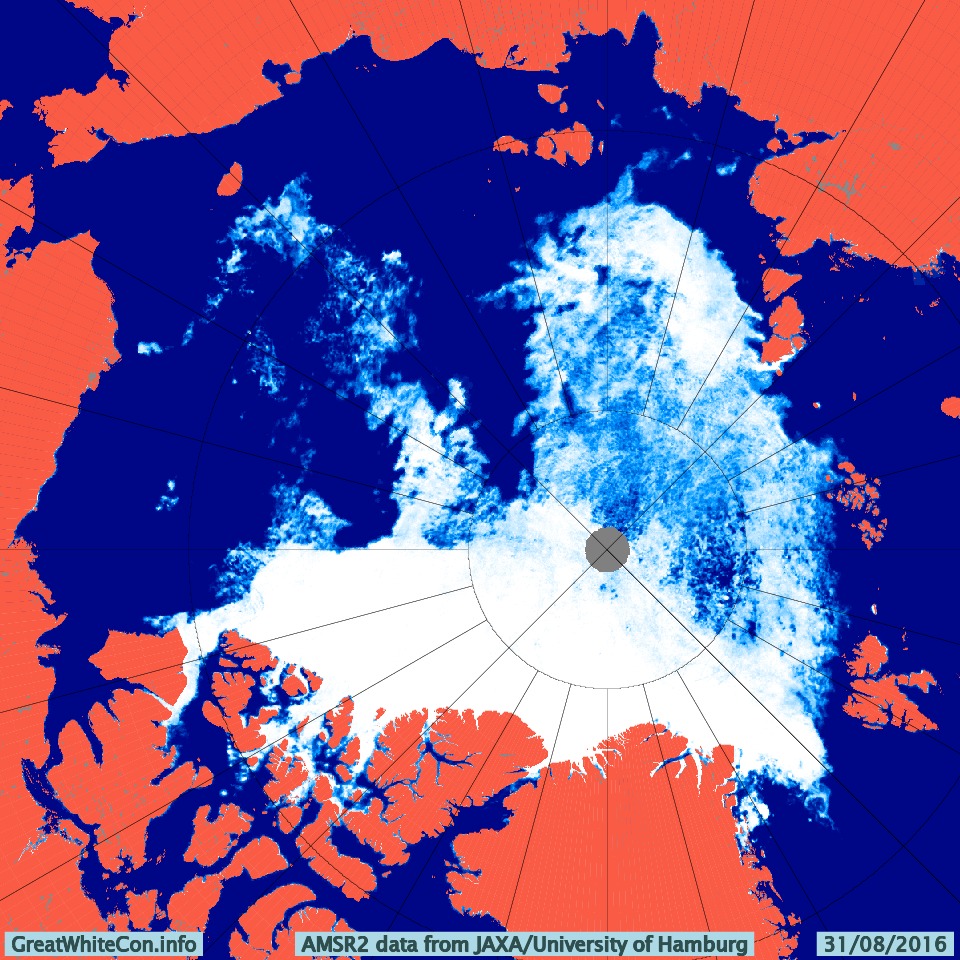
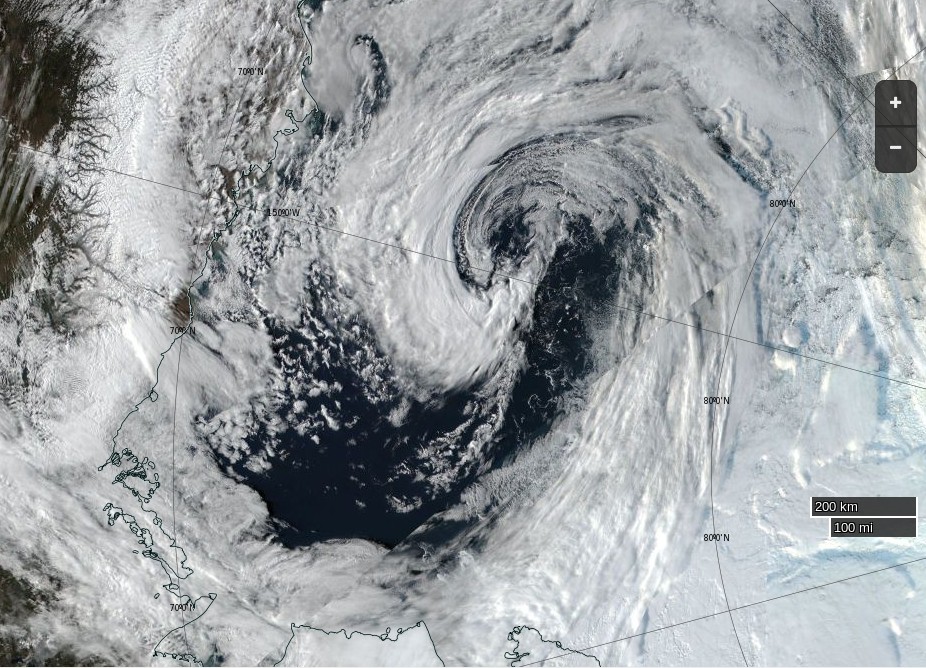
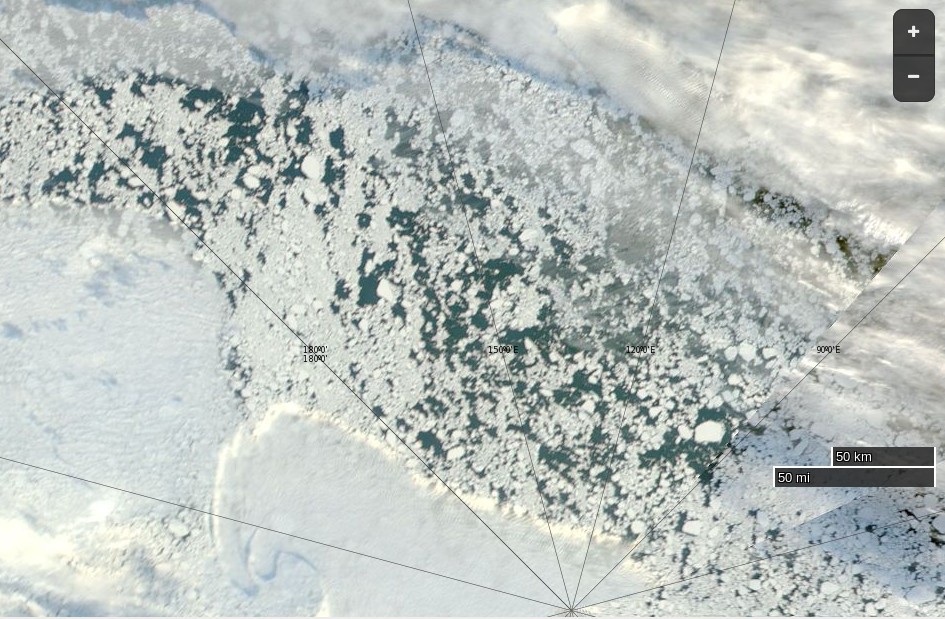
Let’s examine the facts about this “pretty darned unusual” situation shall we? Here is the latest high resolution AMSR2 visualisation of Arctic sea ice concentration:

Arc_20160902_res3.125

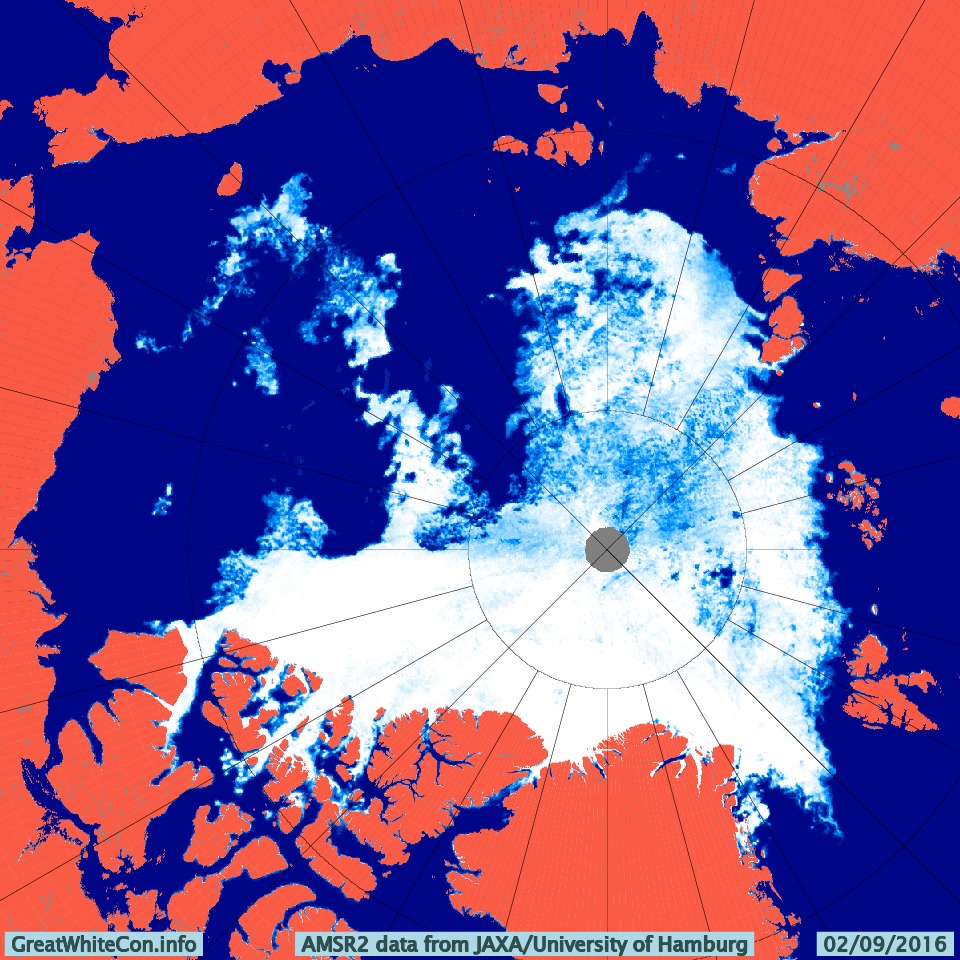
Can you see the stretch of open water leading all the way from the East Siberian Sea, where Northabout was a couple of weeks ago, to 86 degrees north? Apparently Tony Heller and his faithful followers cannot! Not only that, but also supposedly:

A NASA image [shows that] the North Pole is indeed encased in Thick ice right now.

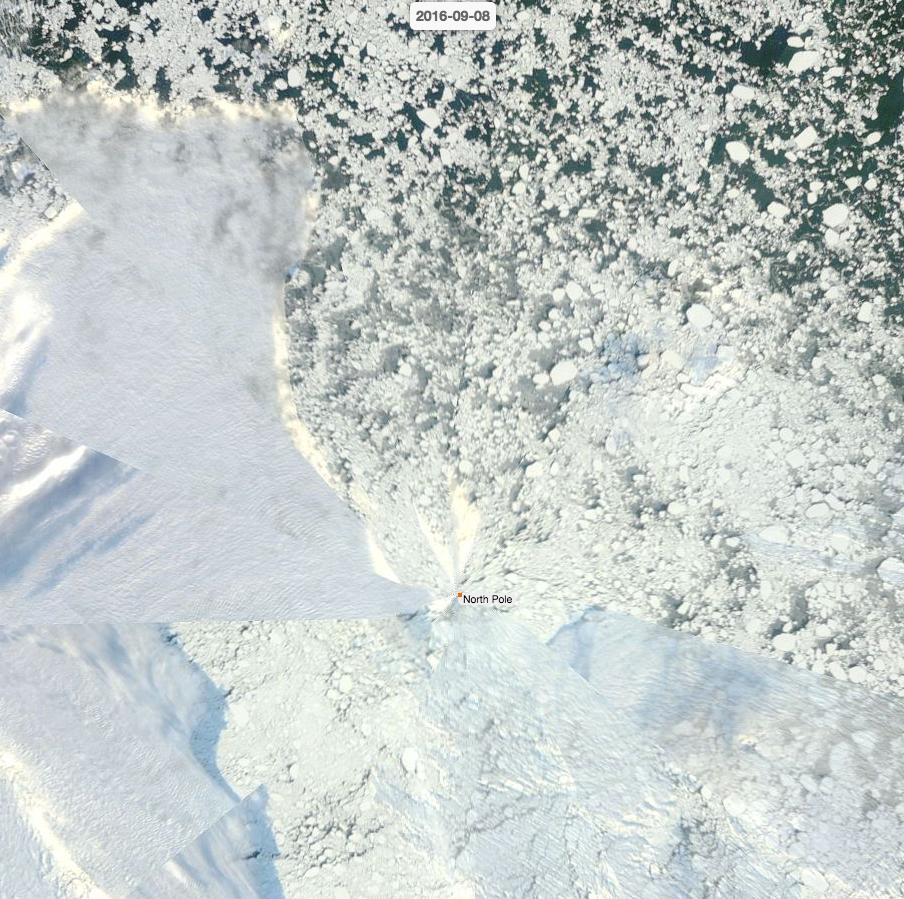
Here’s a (somewhat foggy) NASA image of the North Pole right now:

NASA Worldview “false-color” image of the North Pole on September 3rd 2016, derived from the MODIS sensor on the Terra satellite

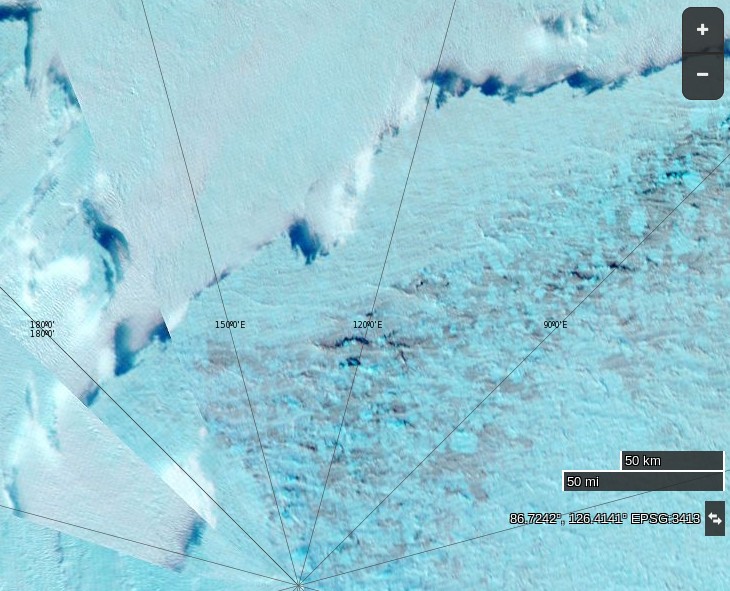
and for good measure here’s a (somewhat foggy) NASA image from 86 degrees north in the Central Arctic Basin right now:

NASA Worldview “false-color” image of the Central Arctic on September 3rd 2016, derived from the VIIRS sensor on the Suomi satellite

Need I say more?


[Edit – September 4th]

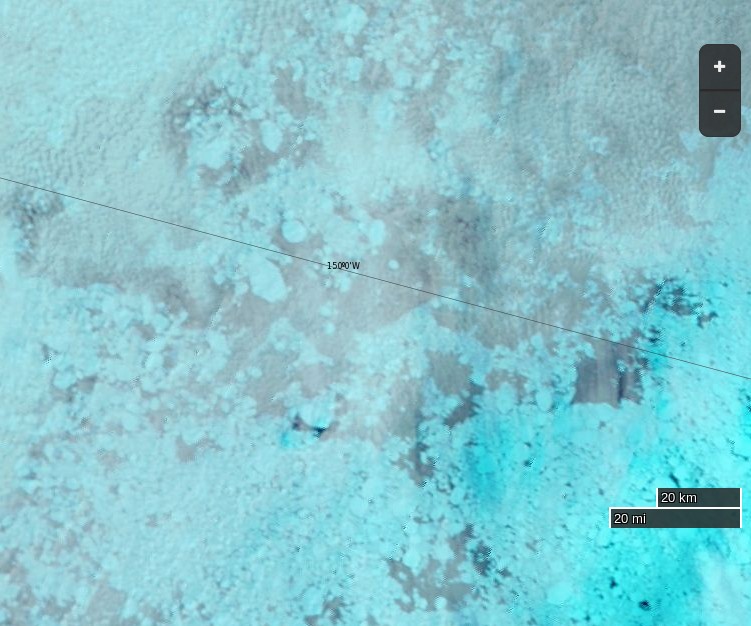
Today Terra offers a glimpse of the Greenland side of the North Pole:

NASA Worldview “false-color” image of the North Pole on September 4th 2016, derived from the MODIS sensor on the Terra satellite


[Edit – September 5th]

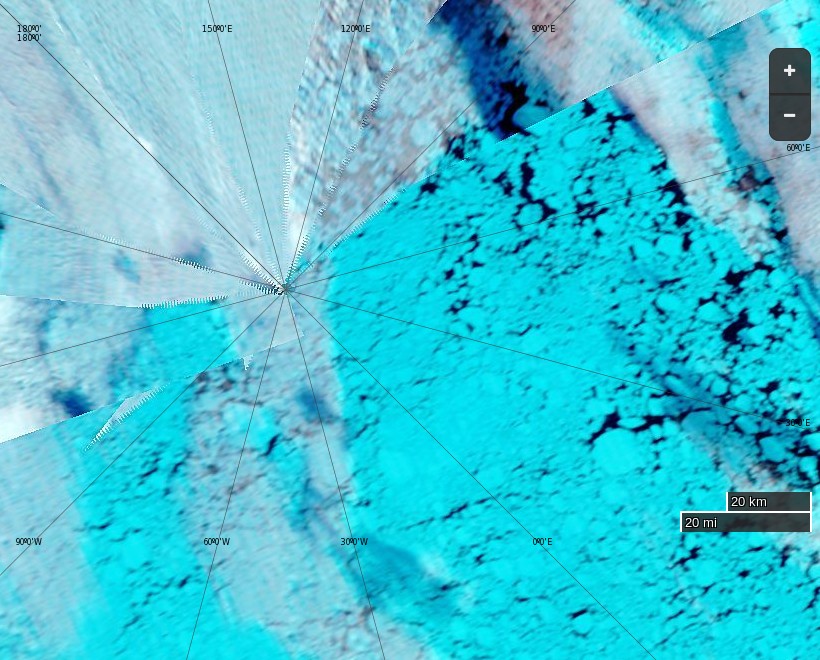
Today Aqua offers us a view of what’s left of the sea ice on the Siberian side of the North Pole:

NASA Worldview “true-color” image of the North Pole on September 5th 2016, derived from the MODIS sensor on the Aqua satellite


[Edit – September 9th]

SHOCK NEWS!!!

Tony Heller has just posted an accurate image of the state of the sea ice near the North Pole! Here it is:

unreal-pole-20160908

The accompanying text is nonsense of course:

The Ship Of Fools is facing a -10C weather forecast in five days, which would be impassable. They better put their fossil fuel powered pedal to the metal and get out of there fast, so that they can go back to Bristol and lie about the ice.

Meanwhile, professional fraudster Mark Serreze said last week they could sail to the North Pole

Needless to say Tony doesn’t provide a link to his source. Try this one and then have a good look around on NASA Worldview.


[Edit – September 10th]

Lord Soth on the Arctic Sea Ice Blog mentions this image of the 2016 version of Santa’s secret summer swimming pool:

The 2016 Arctic Sea Ice Metric Minima

September 2016 is here at last! I posed this question at the start of the recent “Great Arctic Cyclone“:

I wonder what the minimum for 2016 will be, and on what date?

I’m still wondering, and the answer does of course depend on which Arctic sea ice metric you happen to be looking at. Here’s a few examples to be going on with. Firstly there’s Tony Heller’s extent metric du jour, from the University of Bremen:

extent_n_running_mean_amsr2_regular_20160902

and then there’s (one of) his previous one(s), from the Danish Meteorological Institute:

osisaf_nh_iceextent_daily_5years_20160901

Amongst the “industry standards” Cryosphere Today area is missing in action so here’s the National Snow & Ice Data Center’s 5 day average extent:

charctic-20160901

and JAXA extent:

JAXA_Extent_20160901

Finally here are “Snow White’s” favourite high resolution AMSR2 metrics derived by “Wipneus” from University of Hamburg AMSR2 concentration data:

UH-Arctic-Area-2016-08-31

UH-Arctic-Extent-2016-08-31

Are there any other suggestions for numbers to keep a close eye on over the next few weeks?


[Edit – September 3rd]

Arctic sea ice volume, as modelled by PIOMAS, has been updated to August 2016:

piomas-201608

It’s currently 3rd lowest for the month, just a whisker behind 2011. Here’s the PIOMAS gridded data for August 31st 2016:

PIOMAS-20160831

and for comparison purposes here’s the high res AMSR2 concentration map for the same date:

Arc_20160831_res3.125

As suggested by Bill, here too are the Arctic Regional Ocean Observing System numbers. Much like the high res AMSR2 data they allow comparison between area and extent from the same sensor/algo combination, in this case SSMIS/NORSEX on a 25 km grid:

NORSEX-area-20160901

NORSEX-extent-20160901

Both sources agree that currently the remaining ice is less compact in 2016 than it was in 2012.


[Edit – September 4th]

An interesting inter-metric comparison from Lars Kaleschke of the University of Hamburg:


[Edit – September 5th]

Here’s another twist on the University of Hamburg’s AMSR2 extent, courtesy of Lars Kaleschke:

UH-AMSR2-20160904


[Edit – September 11th]

Several of the metrics displayed above have increased over the last day or two. The 2016 minimum may be upon us, but another few days will have to go by before that’s finally confirmed. Whilst we wait here’s another metric to consider, as described on “Tamino’s” Open Mind blog:

A plot of annual average extent also clearly shows the decline, and includes data from throughout the year rather than just the annual minimum. The figure for 2016 is the lowest on record, but the year isn’t done yet. If instead of averaging January-through-December we do September-through-August (to make the final year complete), we find that the most recent year is still the lowest on record:

taminoannualanomaly-aug-2016

Any way you look at it, Arctic sea ice is in decline. If you look at the entire year rather than just the annual minimum, the record year is this one.


[Edit – September 14th]

The refreeze has certainly started now. A quick look through the metrics. First of all the Hamburg University high resolution AMSR2 matched set:

uh-arctic-area-2016-09-13

uh-arctic-extent-2016-09-13

Area just squeezed under 3 million km². Next up is JAXA extent:

jaxa_extent_20160913

which just failed to fall below 4 million km². Last but not least, just for the moment, is the NSIDC 5 day trailing averaged extent:

charctic-20160912

The most striking this year is the unusually large gap between area and extent for this time of year, illustrated by this “compactness” graph from Arctische Pinguin:

amsr2-compact-20160913

Note too the striking difference between different sensor/algo combinations for this metric!


[Edit – September 15th]

With the minimum now beyond doubt, here’s a new graphic from Lars Kaleschke of the University of Hamburg:

uh-min-temp

Need I say more?


[Edit – September 20th]

The September cyclone has now done its worst:

NASA Worldview “true-color” image of the Beaufort Sea on September 18th 2016, derived from the VIIRS sensor on the Suomi satellite

Leaving the area and extent metrics with an intriguing “double dip”:

uh-arctic-area-2016-09-20

uh-arctic-extent-2016-09-20


2016 Minimum Milestones

September 3rd – JAXA extent dropped to 2nd place below the 2007 minimum at 4.05 million km²

September 7th – JAXA extent minimum of 4.02 million km²

September 8th – NSIDC single day extent dropped to 2nd place below the 2007 minimum at 4.083 million km². This proved to the minimum value for the year as a whole.

September 9th – NSIDC 5 day trailing averaged extent dropped to 2nd place below the 2007 minimum at 4.146 million km²

September 10th – NSIDC 5 day trailing averaged extent minimum of 4.137 million km²