For some reason best known to himself Anthony Watts has jumped on the “DMIGate” bandwagon started by Paul Homewood over on this side of the Atlantic a few days ago. In his latest article Mr. Watts quotes with approval the “Not A Lot Of People Know That” article which we have already covered in some depth.
Here yet again is one of my comments that recently ended up on the NALOPKT cutting room floor:
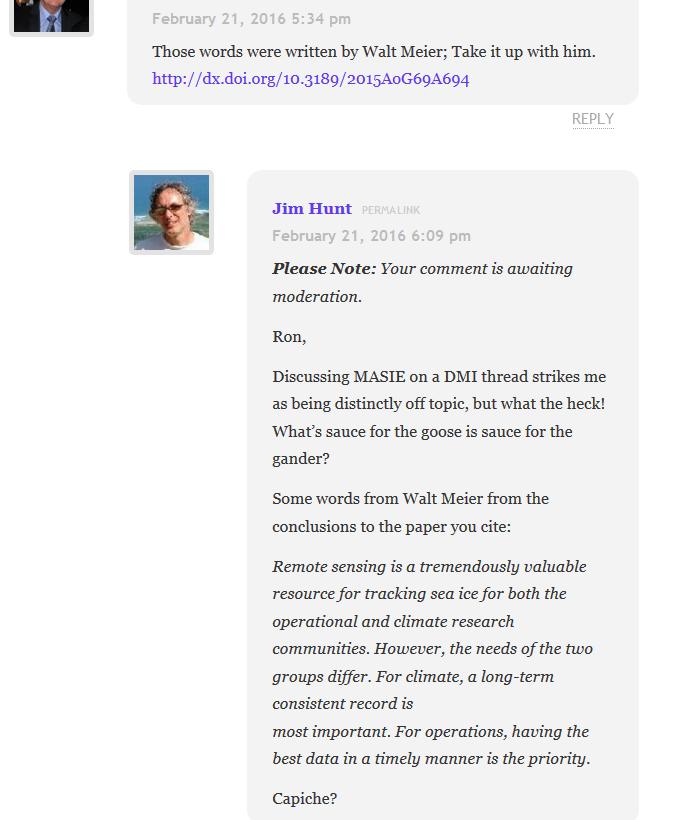
You will note that I was suggesting that Ron Clutz’s extremely selectively interpretation of some of Walt Meier’s academic papers left a lot to be desired. Particularly given the additional fuel added to the “skulduggery” fire by the Watts Up With That article it seemed sensible to phone up NASA and ask Walt for his views on the second hottest Arctic sea ice topic on the planet at the moment, according to Messrs. Clutz and Homewood at least. That is the relative merits of Multisensor Analyzed Sea Ice Extent (MASIE for short) versus the National Snow and Ice Data Center’s Sea Ice Index (SII for short) for determining Arctic sea ice trends.
MASIE sea ice products are developed from National Ice Center (NIC for short) data with support from the U.S. Navy and from NOAA. MASIE is hosted by NOAA@NSIDC.
whereas:
The Sea Ice Index provides a quick look at Arctic- and Antarctic-wide changes in sea ice. It is a source for consistent, up-to-date sea ice extent and concentration images and data values from November 1978 to the present.
As luck would have I managed to get through to Walt on my second attempt, and he graciously agreed to be interviewed at extremely short notice. He told me that whilst he now worked at NASA he used to be at the NSIDC, and still collaborated with them. Here are the edited highlights of his thoughts on “MASIE v SII”:
MASIE repackages data from the NIC, and incorporates an ice edge hand drawn by analysts working with whatever satellite data they have available at the time. It is an “operational” product designed to produce a “best effort” ice edge each day, based on whatever data may be available at the time.
Visual data is obviously not available in winter, and the ice edge is often obscured by clouds in summer. Synthetic Aperture Radar can “see in the dark” and through clouds, but suffers from different limitations. The whole of the Arctic isn’t covered every day for example. In addition, and unlike the SII, data from different satellite sensors is incorporated which means there are inevitably inconsistencies from day to day and from year to year. There is also an element of “human subjectivity” because different analysts are working with different sources of data from one day to the next. Since the quantity and quality of data varies the time series will not be consistent over time.
On the other hand the SII was designed to use a consistent methodology over a long period of time using a single type of sensor. 100% automatically processed passive microwave data is the “gold standard” when it comes to determining sea ice trends. It is subject to some biases and thus is not necessarily as accurate on a given day as MASIE. However, the biases are consistent over time, so the time series will be consistent over time. This means that year-to-year comparisons and trend estimates will be more accurate in the passive microwave data than in MASIE.
So there you have it. If you’re on the bridge of a vessel sailing in Arctic waters then MASIE is the right tool for the job. If on the other hand you’re sat in front of a computer trying to get the best estimate of trends in Arctic sea ice extent then the Sea Ice Index is what you’ll grab from your toolkit.
Having had a chance to examine the “evidence” of DMI “skulduggery” presented by Messrs. Watts and Homewood, Walt sent me a follow up email. Here is what it says:
Regarding DMI, the issue seems quite simple. The 30% plot is an older version that they stopped supporting as they transitioned to the 15% plot. I don’t know specifically why the 30% plot went awry, but there is generally automatic quality control done to make sure the final results are accurate and consistent. If such QC is not done, a lot of incorrect values can occur. I suspect that since the older version was no longer supported, the QC wasn’t being watched and something went wrong that they didn’t bother to fix (or maybe didn’t even notice) because the new 15% version is the official DMI output.
Not a lot of people know that, because Watts, Homewood et al. have developed the nasty habit of “snipping” comments to that effect as and when the mood takes them, which based on my own experience seems to be remarkably often in this day and age.
Great stuff, Jim. Thanks for this.
And thanks to Walt Meier as well! Wonderful chap, as they say in the UK.
I am shocked, shocked I say, to hear that the fine outstanding science blogger Willard Watts would stoop that low.
/snark:off
One thing is certain, the intellectual lightweight who flushed our comments down the memory hole yesterday will not see the error of his ways and post a correction at the echo chamber he calls a blog.
Watts’ posting of Nevin’s comments came as a surprise in light of his past behaviour towards Peter Hadfield. Of course today Watts didn’t have to protect the discount viscount, the potty mouthed peer Chris Monckton.
Watts’ merry minions have finally seen through your cunning disguise Lawrence 🙁
Meanwhile Watts still hasn’t seen fit the release my comments from purgatory, and neither has Homewood:
I go to all the trouble of following Ron Clutz’s suggestion and asking Walt Meier for his opinion which he graciously offers at extremely short notice and then [SNIP] [SNIP] [SNIP]
angech
February 22, 2016 at 3:53 pm
Mr Martinez is a warmist friend of Jim Hunt and conspiracy theorist Neven.
Handle with care!
I resent the slanderous remark made by blogger angech, I have no friends.
Surely you must know that Snow White has a soft spot for you Lawrence?
Nevin:
I’ve been a regular reader at your blog for almost 5 years and have only attempted to comment twice… both times my attempts were futile. You don’t realize how fortunate you are not having “Reggie” as a regular poster at ASIB.
The above doesn’t make sense. MASIE is extremely accurate and measures in 16km2 divisions where SII measures in 625Km2 divisions.
The 2006 to 2022 MASIE data shows that ice extent has remained about the same.p and SII data from 2006 to 2922 shows a very small drop in ice extent.
It all makes perfect sense to me Peter, and to Walt Meier!
One point being that satellites around in 1979 weren’t capable of “measur[ing] in 16km2 divisions”.
Here’s the latest NSIDC min/max trends:
What else (if anything) doesn’t make sense to you?