Tag Archives: AGU

The “Last Ice Area” in the Arctic.

A recent paper by Kent Moore et al. has caused something of a stir in the mainstream media recently, as well as in cryospheric circles and amongst the cryodenialista:

First Observations of a Transient Polynya in the Last Ice Area North of Ellesmere Island

The area to the north of Ellesmere Island and Greenland contains the Arctic’s thickest ice and it is predicted to be the last to lose its perennial ice, thus providing an important refuge for ice-dependent species. There is however evidence that this Last Ice Area is, like the entire Arctic, undergoing rapid changes that may reduce its suitability as a refuge. During May 2020, a polynya developed to the north of Ellesmere Island in a region where there are no reports of a previous development. We use a variety of remotely sensed data as well as an atmospheric reanalysis to document the evolution and the dynamics responsible for the polynya. In particular, we argue that anomalously strong divergent winds associated with an intense and long-lived Arctic anti-cyclone contributed to the development of the polynya as well as similar previously unreported events in May 1988 and 2004.

Curiously the paper neglects to mention a polynya in the same region that we reported on, albeit in passing, in August 2018. Here’s an updated video of that event, with the addition at the start of a yellow arrow to highlight the part of the Arctic’s “Last Ice Area” investigated by Moore et al. and a pale blue arrow to highlight Kap Morris Jesup, the most northerly point in Greenland:

Next here’s another animation, covering the time period discussed in the paper and continuing throughout the summer of 2020:

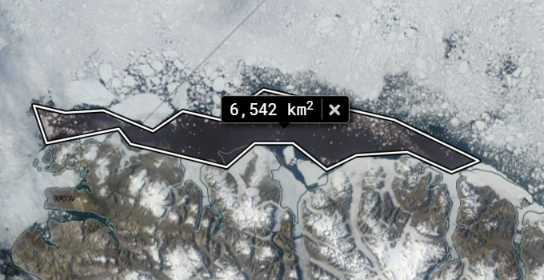
Comparing the two animations it is obvious that the August 2018 polynya is much larger than the one in May 2020, confirmed by a quick area computation using NASA WorldView:

The introduction to the paper states that:

Flaw leads, elongated regions of open water that develop along the interface between land fast and pack ice (Barber & Massom, 2007) are common in the region. Indeed Peary’s 1909 sledding expedition to the North Pole was delayed as a result of a large flaw lead that developed north of Ellesmere Island (Peary, 1910). However, the development of a polynya in this region has not been reported previously.

To my eye the image above reveals something far too wide to be described as a “flaw lead”, but let’s delve deeper into the paper:

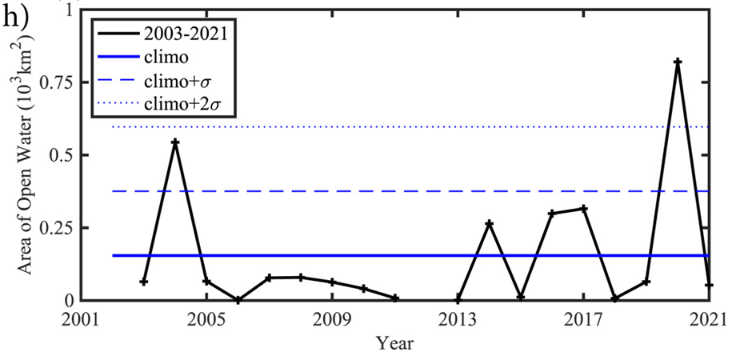
A perspective on the unique nature of the May 2020 event is provided by the monthly mean area of open water in the area of interest during May for the entire period of the ASI data set, 2003–2021 (Figure 2h). Typically the area of open water during May in the region is less than 160 km2. May 2020 is the only year in which the area of open water exceeds 2 standard deviations above the mean.

Perhaps the polynya in question is indeed “unique in the month of May”, in which case it would no doubt have been helpful if the abstract and/or the introduction to the paper had mentioned this subtlety. Then the plethora of erroneous statements in the media like the one recently referenced by Mark Lynas on Twitter might have been avoided?

The polynya is the first one that has been identified in this part of the Last Ice Area, according to a new study detailing the findings in the AGU journal Geophysical Research Letters.

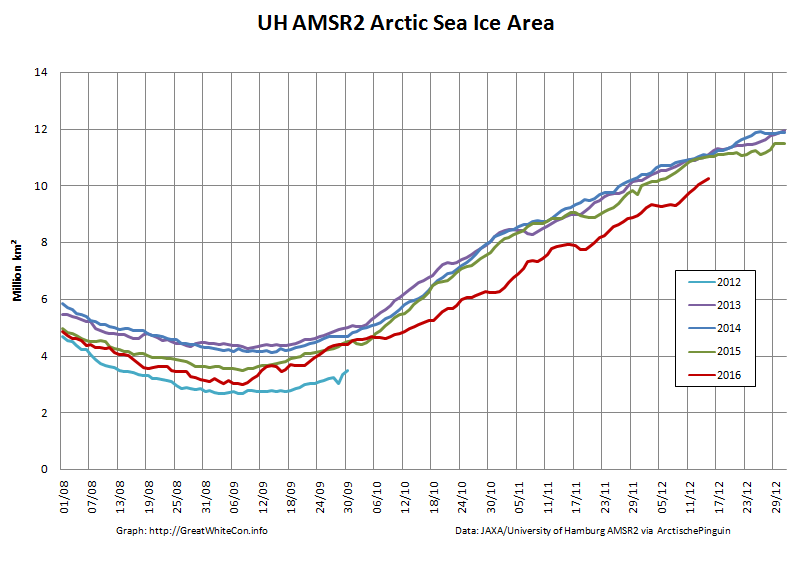
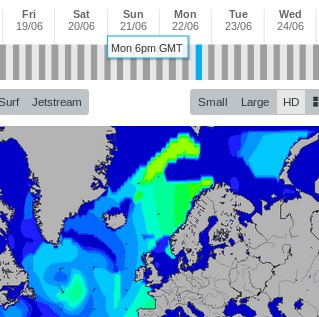
Since Mark, amongst others, seem to be suffering from the misapprehension that “The Arctic’s ‘Last Ice Area’ is cracking, just in time for COP26” here is what’s been happening in the “Last Ice Area” this year, in the run up to next month’s conference in Glasgow:

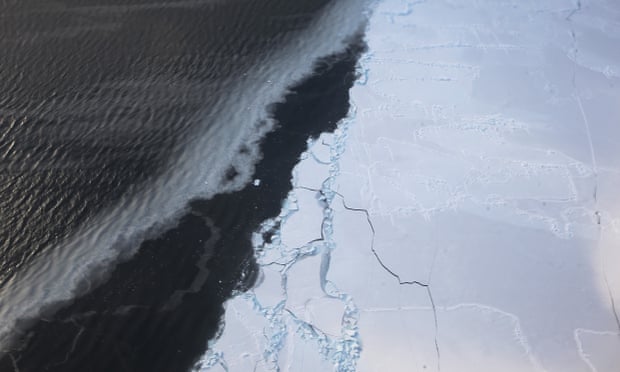
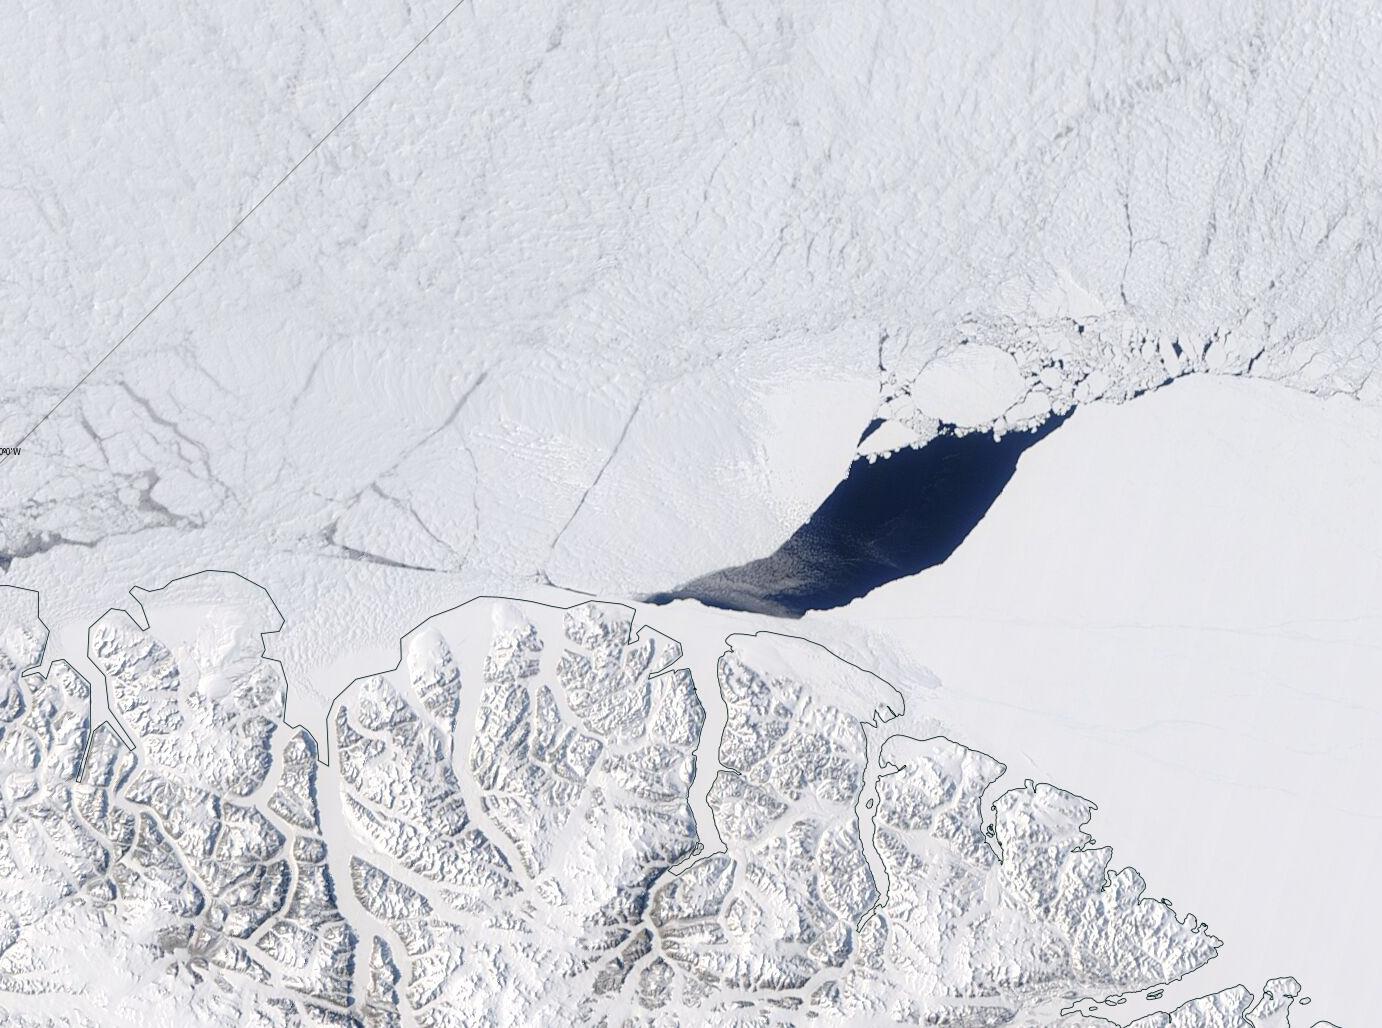
Finally, for the moment at least, are MODIS images of the May 20th 2020 polynya:

and the one on May 12th 2004:

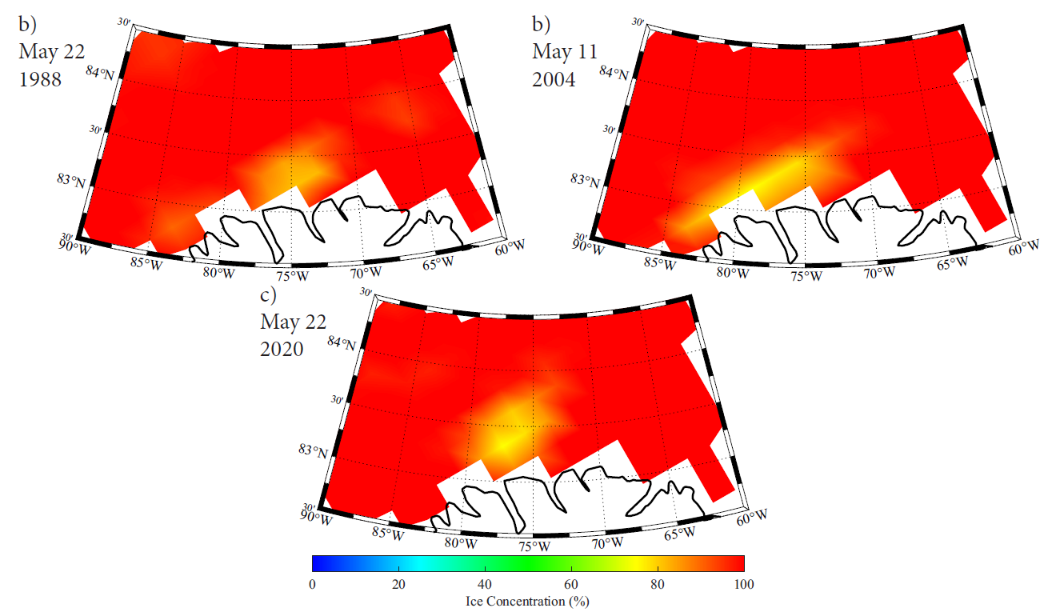
Neither Aqua or Terra had been launched in 1988 of course, and Landsat 5 didn’t cover the north of Ellesmere Island. This is the SSM/I & SSMIS visualisation of all three May polynyas from the supplement to Moore’s paper:

The 11th Key Science Moment of 2016

A brief history of scientific “churnalism” in the age of social media. The “post-truth” of The Guardian’s 11th Key Science Moment of 2016.

On November 7th 2016 we broke this astonishing news on Twitter:

Nobody noticed! Then on November 16th 2016 Zack Labe did likewise:

The story got some legs. Zack got pushback from some “skeptics” and then the AGU blogged about the story.:

My attention was called to this issue last week thanks to the Twitter feed of Zack Labe, a PhD student in Earth Systems Science at the University of California – Irvine. He makes great graphics showing the latest data on polar climate.

Then he got interviewed by the AGU. The AGU linked back to the graphic graphic in question in the clouds at Google, but there was no mention of our November 6th article or the real source of the story. The Arctic Sea Ice Forum (ASIF for short).

It’s now December 18th, and as far as I’m aware that remains the case in the mainstream media (MSM for short). The Arctic Sea Ice Forum grew out the earlier Arctic Sea Ice Blog (ASIB for short). The proprietor of both the ASIB and ASIF has been revealed by CBC to be one Neven Curlin. They recently interviewed Neven, and even gave him top billing above Sir David Attenborough in the resulting podcast:

‘Like watching a train wreck’: Blogger quits writing about climate change

However the title of the CBC article is inaccurate, as CBC would surely have noticed if they’d read Neven’s article on the ASIB on the topic of his “sabbatical”.

Sabbatical (I hope)

Now comes news that the “astonishingly low level” of global sea ice area that we brought to the waiting world’s attention on November 7th has today been chosen by The Guardian as one of their:

12 key science moments of 2016

The story outlined above and the associated graphic graphic are conspicuous only by their absence, but the Grauniad have thoughtfully provided this pretty stock photo of some sea ice:

Scroll down the Guardian’s article to number 11, pausing to read Tamsin Edwards’ section on atmospheric carbon dioxide levels at number 9 on the way down (unlike CO₂ concentrations). There you will discover Professor Andrea Sella’s opinion that:

In October, unprecedented weather patterns drove icy winds across Siberia, pushing Arctic temperatures up to 20C above normal and parts of the Arctic Ocean failed to refreeze; in the Antarctic, sea ice thawed faster than usual. For me the bombshell came from a Dutch blogger in late November: a plot of the Arctic plus Antarctic showed sea ice this autumn to be tracking 4m km2 (the size of western Europe) below the normal average. This is a 7-sigma event – with a chance of about one in a hundred billion of being random. The ice doesn’t lie. If we don’t take this seriously now, our children will ask us why.

The “plot of the Arctic plus Antarctic” Andrea refers to was created by “Wipneus”, who I suppose could reasonably be described as a “Dutch programmer”. Neven could reasonably be described as a blogger, although he is much more than that. Although he was born in The Netherlands he no longer lives there.

Here’s the current state of play:

nsidc_global_area_20161215-400

Are your children asking “Why?” yet?

Should anybody wish to pose that question on Twitter please see:

December 2016 Arctic Report Card

This is the Great White Con version as opposed to the NOAA version published during the Fall AGU conference earlier this week, although there is some overlap.

Hot off the presses, here’s how Arctic sea ice age has progressed over the last year and a bit:

The 4 and 5 year old ice looks to be edging away from the area north of the Canadian Arctic Archipelago towards the Fram Strait. Here’s the current CryoSat-2 Arctic sea ice thickness map:

cryosat_thk_20161212

Almost no ice over 2 meters thick to be found in the Beaufort sector or anywhere on the Siberian side of the Arctic. Here’s the current AMSR2 Arctic sea ice area graph:

uh-arctic-area-2016-12-15

Lowest for the date in the satellite record. Here’s the NSIDC’s long term trend in November sea ice extent:

monthly_ice_11_nh

Act 1 of a 3 act play according to Don Perovich at AGU. Here’s the current PIOMAS Arctic sea ice volume anomaly graph:

piomas-anomaly-201611

Lowest for the date in the satellite record. Here’s NOAA’s Arctic and global surface temperature graph:

arctictemp_map_graph_2015-16_620

Warmest in a record going back to 1900. Here’s the current DMI >80N surface temperature graph:

dmi_meant_20161216

and here’s the current Arctic surface temperature anomaly map:

cci-t2-anomaly-20161217

Finally, for the moment at least, here’s global sea ice area just for good measure:

nsidc_global_area_20161216


Need I say more? How about this:


Ice has no agenda. It just melts.
Out of the labs and into the streets?

Arctic Sea Ice News from AGU

I just watched the live stream of the fall 2016 AGU press conference about the findings of the “First results from the Norwegian Young Sea ICE Expedition”.

Here’s the associated video of the expedition:

Here are the bullet points:

Initial results suggest that the thinner and younger ice is altogether different from older multiyear ice. It moves faster, breaks up easier, melts faster, and is more vulnerable to storms. This has important consequences for the Arctic as a whole, as our current knowledge is largely based on information from the “old Arctic.”

The Atmosphere

• For the first time, N-ICE2015 researchers directly observed large winter storms over sea ice and saw that they have significant effects on the young, thinner ice. The high winds create a lot of stress on the sea ice by pushing it around and breaking it up.
• One winter storm raised the air temperature from -40 F to +32 F in less than 48 hours, while the moisture in the air increased 10 times. All of these factors significantly warm the surface of the snow, even in mid-winter, and slow the growth of ice.

The Sea Ice and Snow Cover

• Researchers on the drifting ice camps found more snow on top of the ice than expected. This insulated the ice from the atmosphere, slowing its growth in winter and surface melt in summer.
• The sea ice was sometimes flooded by seawater as the large snow load pushed the thinner ice below sea level.
• The thinner sea ice was more dynamic than researchers have seen before. This could mean more ridging but also more cracks and leads between ice floes.

The Ocean

• Winter storms caused the sea ice to drift so fast that it increased mixing of the water beneath the ice. Deeper, warmer water was mixed up closer to the sea ice, causing it to melt from below despite winter air temperatures that were below freezing.
• Researchers saw summer storms stir up deep warm waters and melt as much as 25 cm of ice in a single day.

The Ecosystem

• For the first time, N-ICE2015 researchers observed an algae bloom under snow-covered pack ice. Thinner and more dynamic Arctic sea ice allows more light transmission to the ocean, especially through cracks and leads. This triggers earlier phytoplankton blooms under the snow-covered ice.
• The phytoplankton species that dominated the under-ice bloom does not sink to the deep ocean. Such shifts in phytoplankton species composition, associated with early under-ice phytoplankton blooms, could thus have important implications for the strength of the biological carbon pump in the Arctic.

There was also mention of the “waves in ice” event that the R/V Lance experienced back in June 2015:

lance-waves-2015-1

P.S. A recording of the N-ICE2015 press conference is now available:

Next up on the live stream is was the 2016 “Arctic Report Card“. Here’s the associated video:

No doubt because of the recent controversy concerning the effects of the 2015/16 El Niño the first graphic that caught my eye was this one:

arctictemp_map_graph_2015-16_620

In the question and answer session the obvious question was asked. The answer was that while attribution is difficult the 2015/16 El Niño did have some effect on Arctic sea ice. However currently we’ve only seen “the first act of a 3 act play”. Act 2 will be the maximum extent in March.

In answer to another question, a focus of research over the next 10 years should be the interactions between mid latitudes and the Arctic.

P.S. A recording of the Arctic Report Card press conference is now available:

A variety of cryospheric posters are available via:

https://agu.confex.com/agu/fm16/meetingapp.cgi/Index/EPoster~1/Program/1175

R/V Lance Encounters Another Energetic Wave Event in the Arctic

Today’s title is inspired by a recent paper in the AGU’s Geophysical Research Letters, entitled “In situ measurements of an energetic wave event in the Arctic marginal ice zone“, by Collins, Rogers, Marchenko and Babanin. According to Collins et al. in the abstract:

R/V Lance serendipitously encountered an energetic wave event around 77°N, 26°E on 2 May 2010. Onboard GPS records, interpreted as the surface wave signal, show the largest waves recorded in the Arctic region with ice cover. Comparing the measurements with a spectral wave model indicated three phases of interaction:

  1. wave blocking by ice
  2. strong attenuation of wave energy and fracturing of ice by wave forcing, and
  3. uninhibited propagation of the peak waves and an extension of allowed waves to higher frequencies (above the peak)

Wave properties during fracturing of ice cover indicated increased groupiness. Wave-ice interaction presented binary behavior: there was zero transmission in unbroken ice and total transmission in fractured ice. The fractured ice front traveled at some fraction of the wave group speed. Findings do not motivate new dissipation schemes for wave models, though they do indicate the need for two-way, wave-ice coupling.

There’s a lot of equations and similarly technical stuff in the body of the paper which is nevertheless well worth a read even if you’re not a techie, as are the articles in the long list of references at the end. However, there aren’t any “swell forecasts” of the sort we like to put in our discussions of “waves-in-ice“, so firstly let’s fix that. Here’s some visualisations from NOAA’s WaveWatch III reanalysis for 18:00 on May 2nd 2010:

Significant_height_of_combined_w in multi_1.ao_30m.hs.201005

Primary_wave_mean_period_surface in multi_1.ao_30m.tp.201005

which reveal a swell with a significant height of 6 meters and a period of 11 seconds in the open ocean south of Hopen Island and Svalbard. Collins et al. concluded that:

Our results suggest that accurate wave prediction would have required coupling with an ice model which resolved scales of hours and kilometers. Implementation at such scales will no doubt be a future challenge. These are the largest known waves recorded in the Arctic with substantial ice cover present, and we expect the measurement of large-wave events to occur more frequently in the future due to the fetch wave-ice fetch feedback loop.

Now comes news that the R/V Lance has been subject to another “waves-in-ice” event, although this time it was north of Svalbard. First of all here’s a video showing an earlier stage of the Lance’s 2015 Arctic program:

Next the latest serendipitous encounter for the Lance. According to the Twitter feed of the Oceanography & Sea Ice department of the Norwegian Polar Institute on June 22nd 2015:

The sea ice floe with the N-ICE2015 research camp broke

at which time the Lance was located in the marginal ice zone northwest of Svalbard:

RVLance-20150622

Now some further information (and more pictures!) has emerged via the Twitter feed of Harvey Goodwin, who says that:

When a light swell comes in the 5km sea ice floe we’d been working on broke into pieces not more than 30m [across] in an hour:

Equipment rescue[d] after sea ice breakup. Some cables cut but no equipment lost!

The WaveWatch III reanalysis for June 2015 isn’t available yet. We’ll bring you that information once it is, but for now here’s a couple of quick snapshots from the Magic Seaweed surf forecasting site:

NAtlanticWaves-20150622-1800

NAtlanticPeriod-20150622-1800

They suggest that a smaller but longer period swell was responsible for the ice break up this time around, compared to 2010. I wonder if it will take another 5 years for this latest event to be more fully documented in the scientific literature?