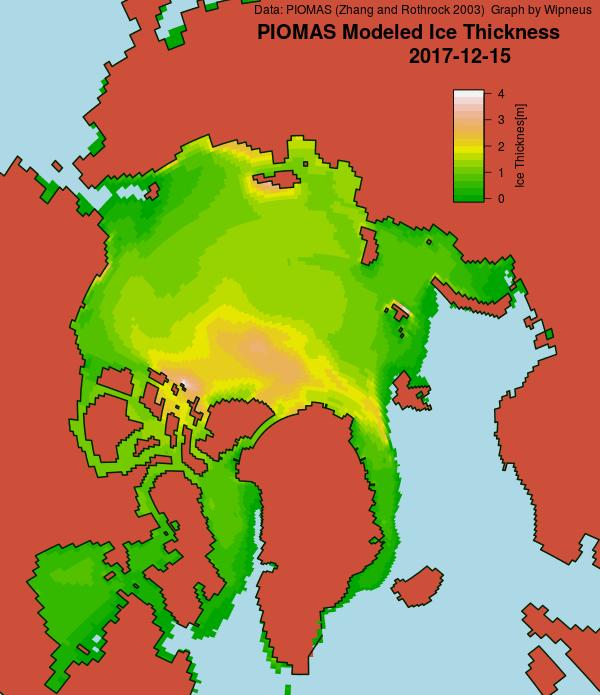
Christmas is coming, and Santa’s secret summer swimming pool has frozen over once again. However the same can’t be said for the Chukchi Sea! More on that in due course, but first let’s take a look at the PIOMAS volume graph at the end of November, courtesy of the wondrous Wipneus on the Arctic Sea Ice Forum:
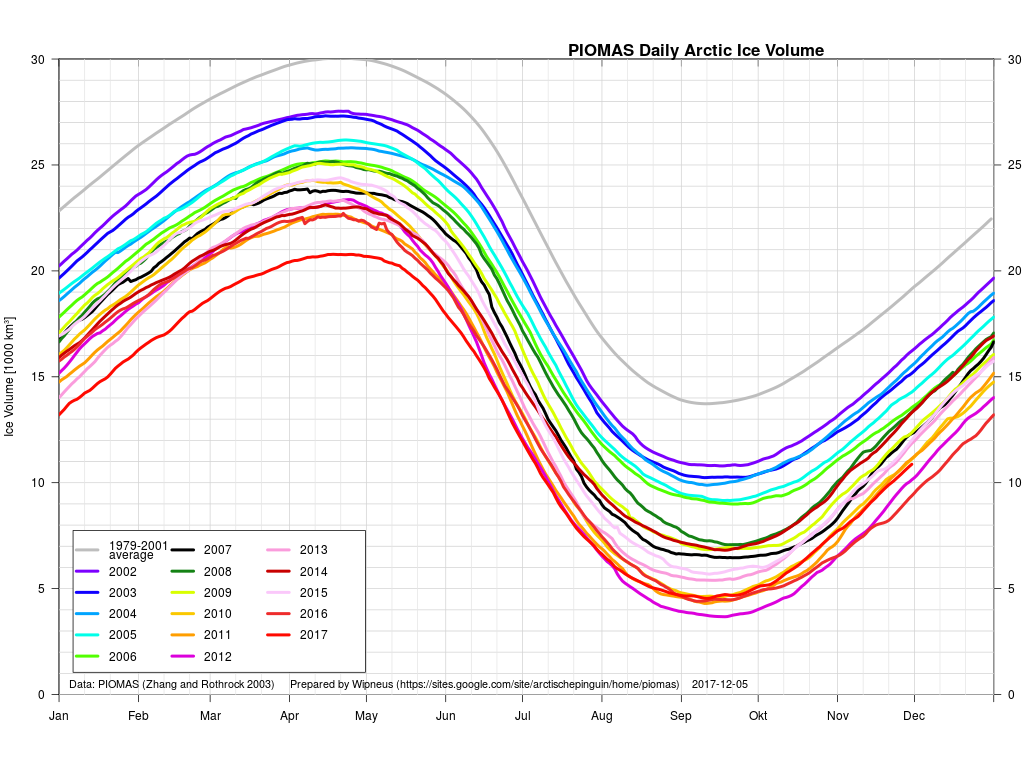
2017 is currently third lowest, behind 2012 and 2016. Next let’s take a look at Wipneus’ PIOMAS Arctic sea ice thickness map:
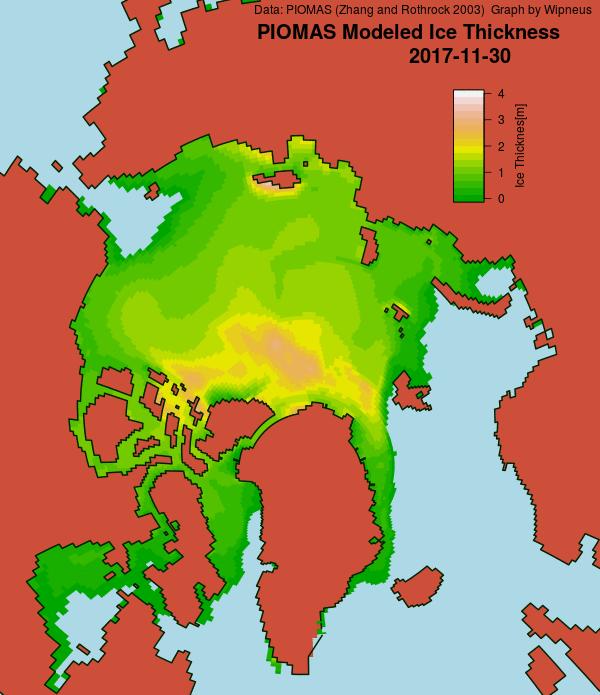
followed by the University of Bremen’s SMOS Arctic sea ice thickness map:
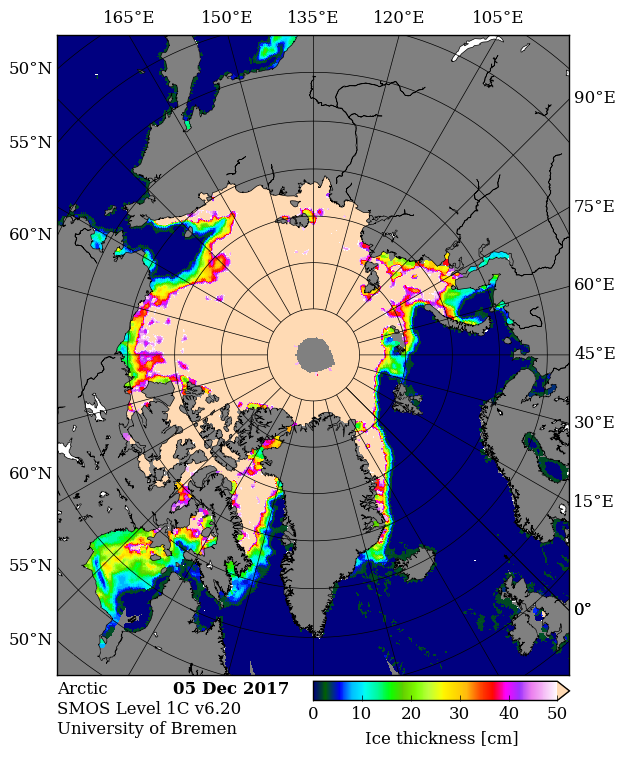
Note the large area of pale blue open ocean still visible in the Chukchi Sea towards the top left of both maps.
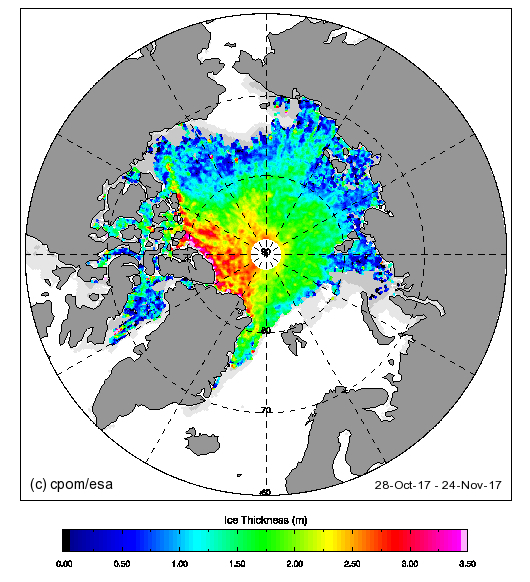
For another perspective on Arctic sea ice thickness here’s the latest Cryosat-2 map, which currently is based on the month up to November 24th:
Finally, for the moment at least, here’s our very own Arctic Freezing Degree Days graph based on the DMI’s >80N data:
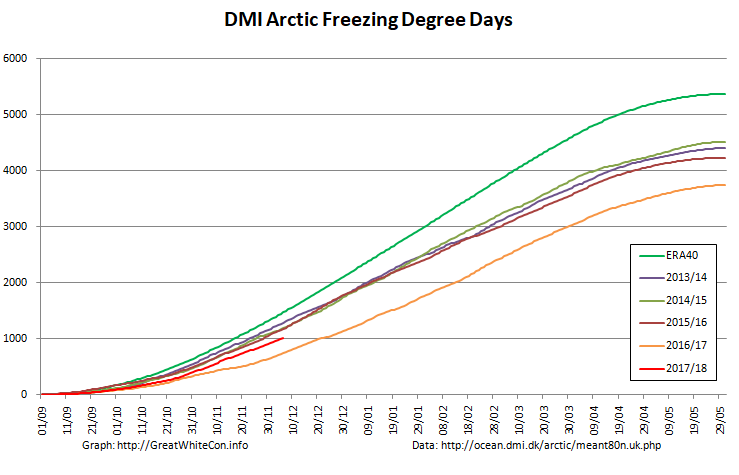
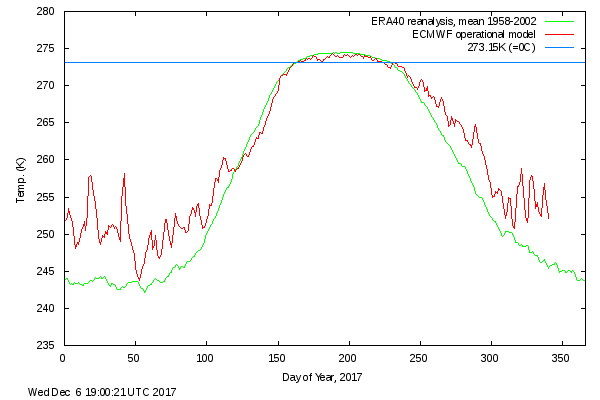
2017 is currently occupying the wide open space between the astonishingly low numbers last year and all previous years in DMI’s record. Here’s their graph for 2017 so far:
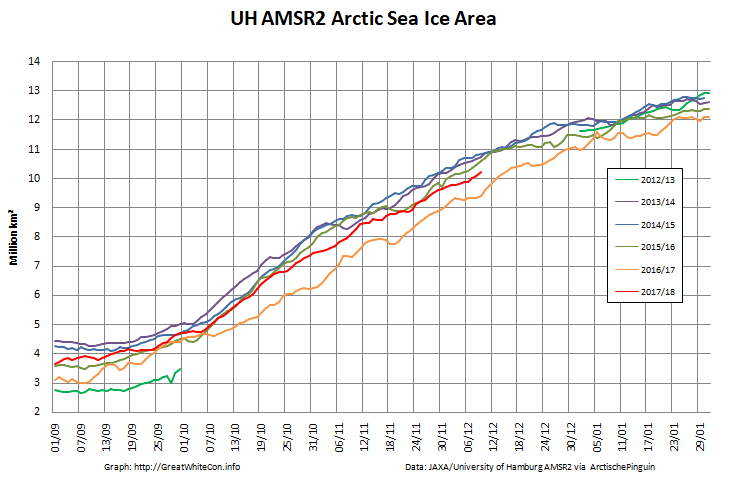
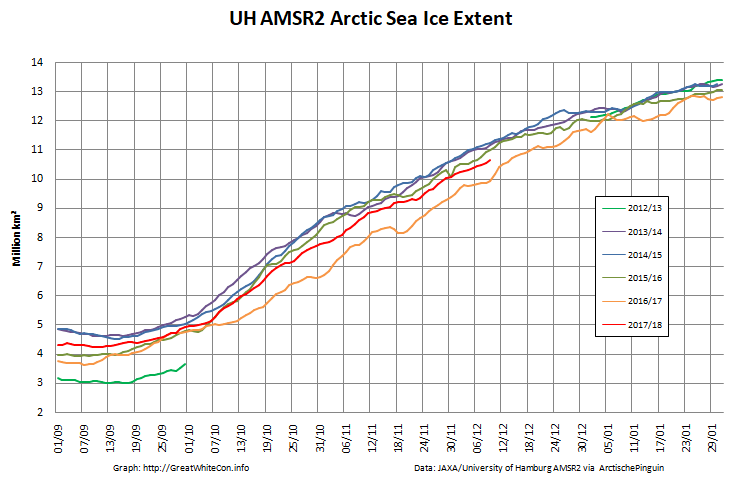
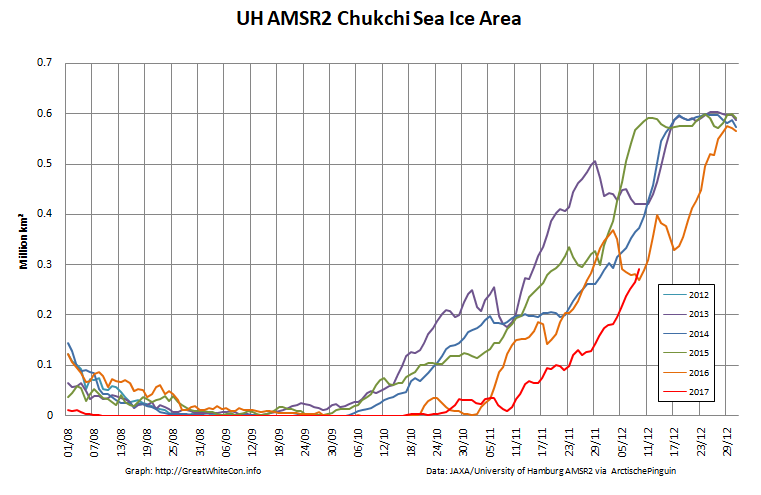
Current Arctic sea ice area and extent derived from the University of Hamburg’s high resolution AMSR2 data:
Plus the latest update on the Chukchi Sea situation:
Wipneus has released his mid month PIOMAS update for December:

The Chukchi Sea is now mostly covered in sea ice, as is the Kara Sea. Volume is still 3rd lowest behind 2016 and 2012.
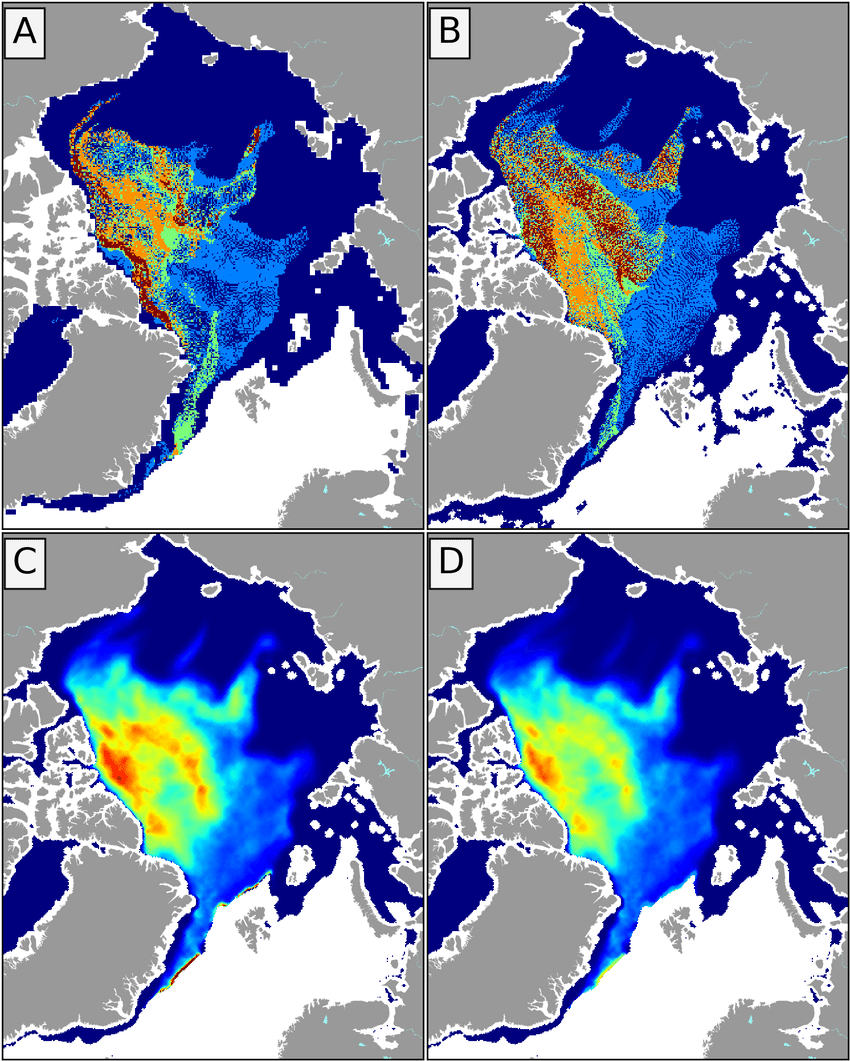
Whilst on the subject of sea ice thickness a related subject is sea ice age. Here’s a new paper on that topic:
“A new tracking algorithm for sea ice age distribution estimation”
Note that these assorted sea ice age maps are all for January 1st 2016!
Watch this space!
The latest edition of the NSIDC’s Arctic Sea Ice News also leads on the record low extent in the Chukchi Sea:
You mean the Bering Strait?
I will, Jim, I will be watching this space!
Same bat channel, Same bat time,… *** ka-pow!
North of the Bering Strait in fact.
PS, do you know what a “Rosby wave train” is?
https://www.sciencedaily.com/releases/2017/12/171205092142.htm
I think the link came from nevens blog…
Possibly you found it via the ASIF?
Does this help at all?
https://en.wikipedia.org/wiki/Rossby_wave#Atmospheric_waves
Here’s the original paper by Ivana Cvijanovic et al. in Nature:
https://www.nature.com/articles/s41467-017-01907-4.pdf
The good thing about the Chukchi Sea is that every year it fills up completely by January. This means that an early melt or late refreeze is in one sense, unimportant, at this stage.
If it was to stay unfrozen in part all year round that might be a cause for concern.
Consequently what one has to watch is the amount of ice forming in the unbounded peripheries.
Things like the Sea of Okhotsk and Bering sea and the edges of that long island. Novaya Zemlya.
At the moment ice on the eastern side of the latter has been as rare as hens teeth in recent years. Perhaps this year it might be better.
Chukchi is now belatedly freezing up rapidly.
I note that the rapid regrowth in Okhotsk was not deemed worthy of a mention, perhaps a little each way commentary would be good at times, positives as well as negatives?
Anyway merry Christmas and keep on blogging.
Appreciated.
Enjoy the fact that people are prepared to work hard to get these views across.
There’s nothing unusual about extent on the Pacific periphery, unless you include the recent “plateau”:
I concur: there appears to be nothing unusual here!
[“…NEXT!”]
In case you blinked and missed it, Wipneus’s mid month PIOMAS updates can now be seen above:
https://greatWhiteCon.info/2017/12/the-festive-season-in-the-arctic/#Dec-20
Wow, look at how far below 2016 is…. there must be a hangover effect!
I suppose this is like so called ‘semi-periodic’ patterns,…. there is still something actually going on here!
Go Wipneus!
…or am I falling for Ye olde human frailty of reading too much into graphical information?
PS
Oren said this(over at nevens forum) :
Interestingly, the main volume in the CAB is drifting “westwards”, which gives hope that the thick ice could be more protected from export this year.
<<
Could this likewise mean the thick ice is being drawn into the Beaufort Gyre, I.e. that The Gyre is active and,… well I don’t know what’s next,… um, then FRAM STRAIT EXPORT?
Basically I was thinking that Oren’s comment might also mean activation of the gyre which means mechanical input of energy thus adding to the ultimate melting of the sea ice!
Here’s the latest Cryosat-2 thickness map for comparison purposes:
There does seem to be a thin sliver of thicker ice rotating around the Beaufort Sea. There also seems to be a much larger lump of thicker ice heading for the Fram Strait exit!
Rounding out well and filling up all the basins. Looks like the outer seas might add to volume this year which is a surprise given how quickly the Pacific melted them last year.
And extent, forgot extent.
Arctic wide area and extent have stalled over the last few days.
The Chukchi Sea in particular is back in “record low” territory, since AMSR2 records began at least:
Looks like a two year trend… does that even make sense?
** Merry Christmas to all and I hope we (me included) have a well feasted upon new year!
(In the Chukchi atleast!)
You can hardly see it, so I marked it myself but 2018 is off to a really bad start.
Lowest extent for date on record (significantly lower)
https://www.facebook.com/tommy.barlow.52/posts/10211338892443203
You can roll over the point here to see it yourself:
http://nsidc.org/arcticseaicenews/charctic-interactive-sea-ice-graph/
Still struggling, a week later.
https://postimg.org/image/6h3wm6mu3
(Sorry, not sure where to post this so i searched for volume and found a recent date…)
Regarding this graph of GIOMAS from wipneus….
…can’t charges be seemingly levelled at this for what looks like a cherry picked high beginning?
Just saying…. maybe it would look markedly different if we were to forget the first year or two for instance?!!?
{Embedded image – Mod]
The graph starts when the satellites first flew and finishes in December 2016. Obviously not updated for a while!
Don’t start repeating the denialista’s “cherry picking” nonsense please! Why arbitrarily ignore the first few data points?
Fair enough!