September 2016 is here at last! I posed this question at the start of the recent “Great Arctic Cyclone“:
I wonder what the minimum for 2016 will be, and on what date?
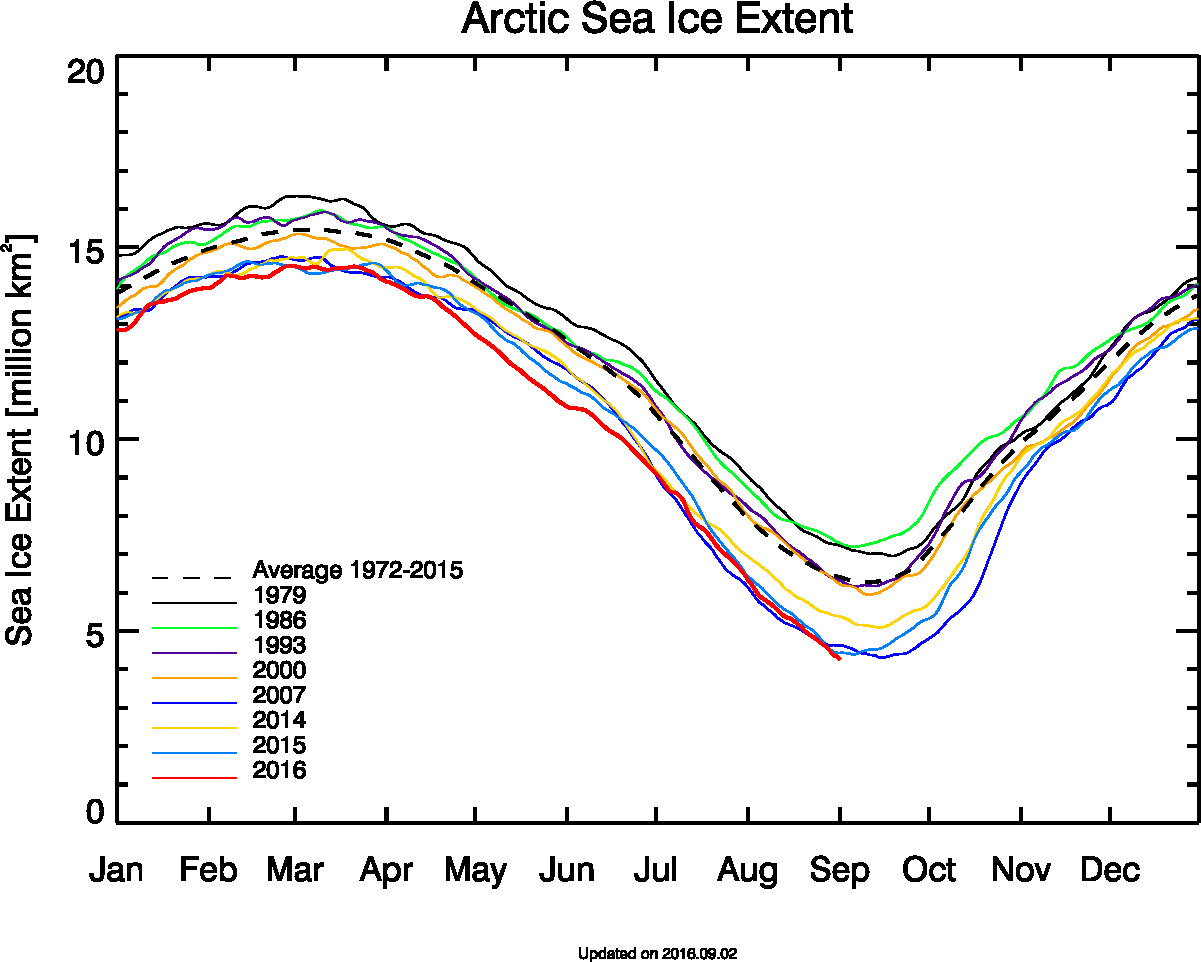
I’m still wondering, and the answer does of course depend on which Arctic sea ice metric you happen to be looking at. Here’s a few examples to be going on with. Firstly there’s Tony Heller’s extent metric du jour, from the University of Bremen:
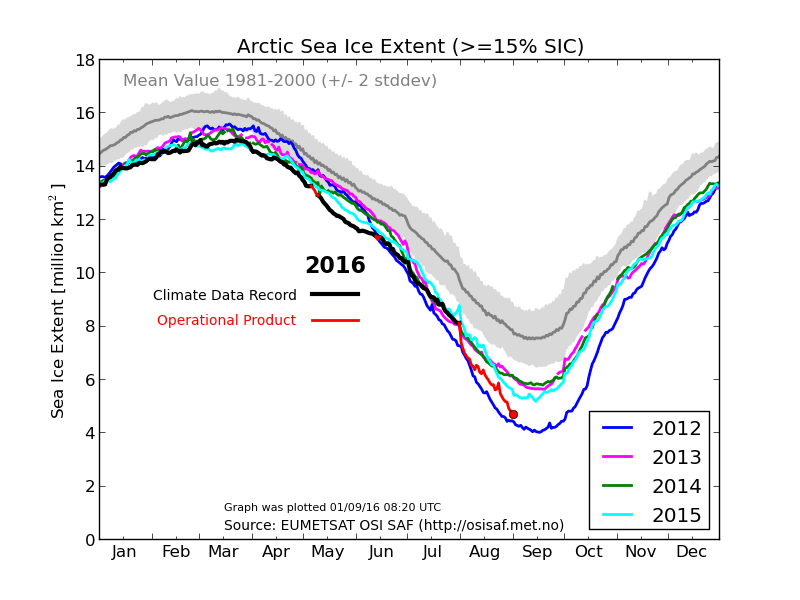
and then there’s (one of) his previous one(s), from the Danish Meteorological Institute:
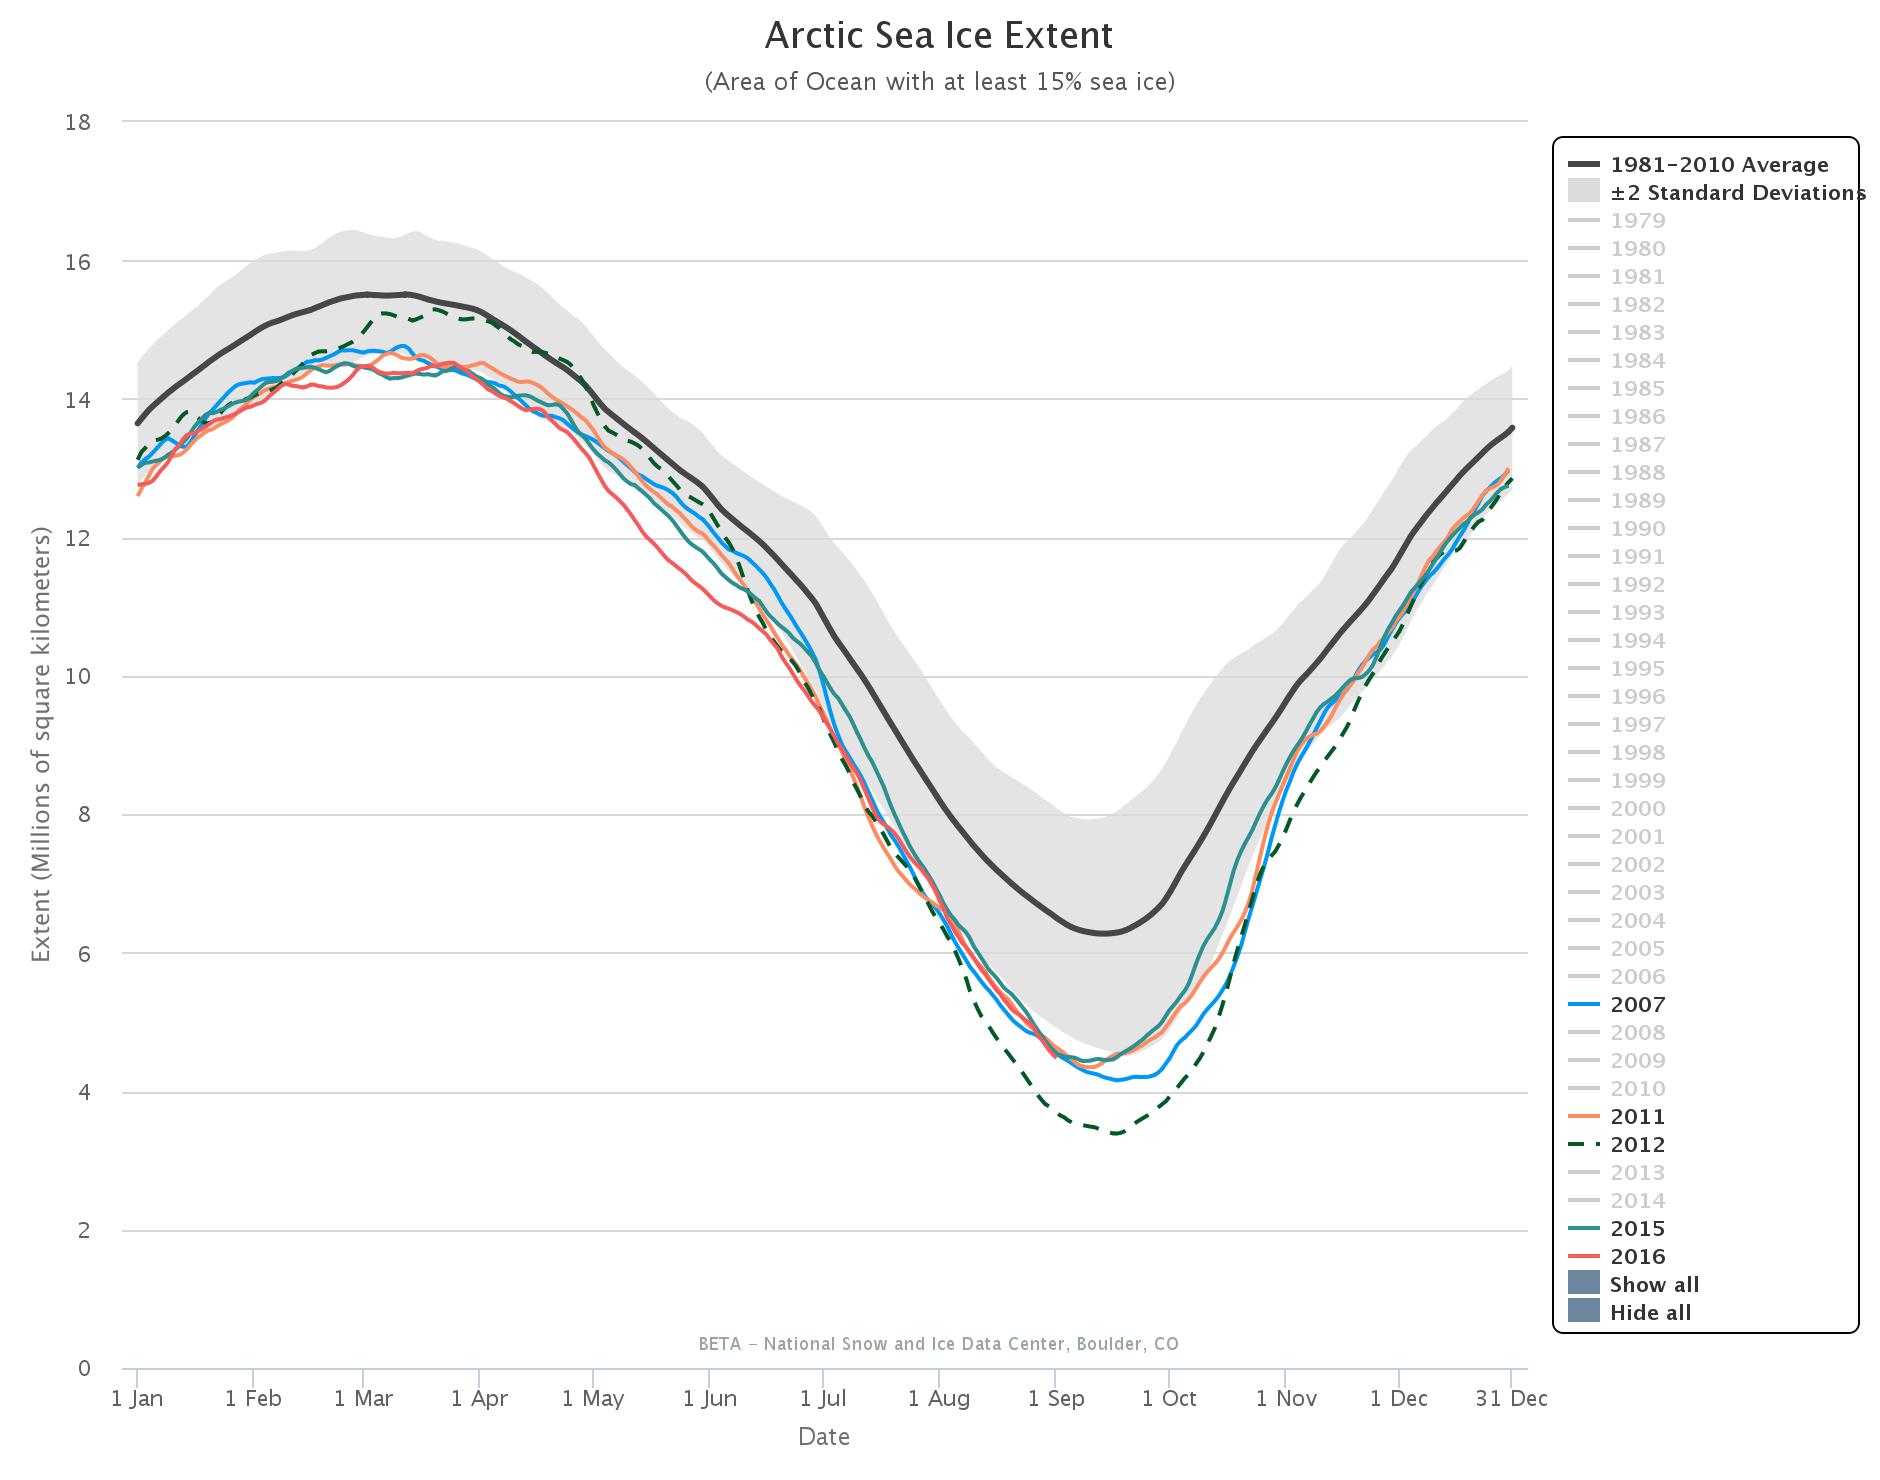
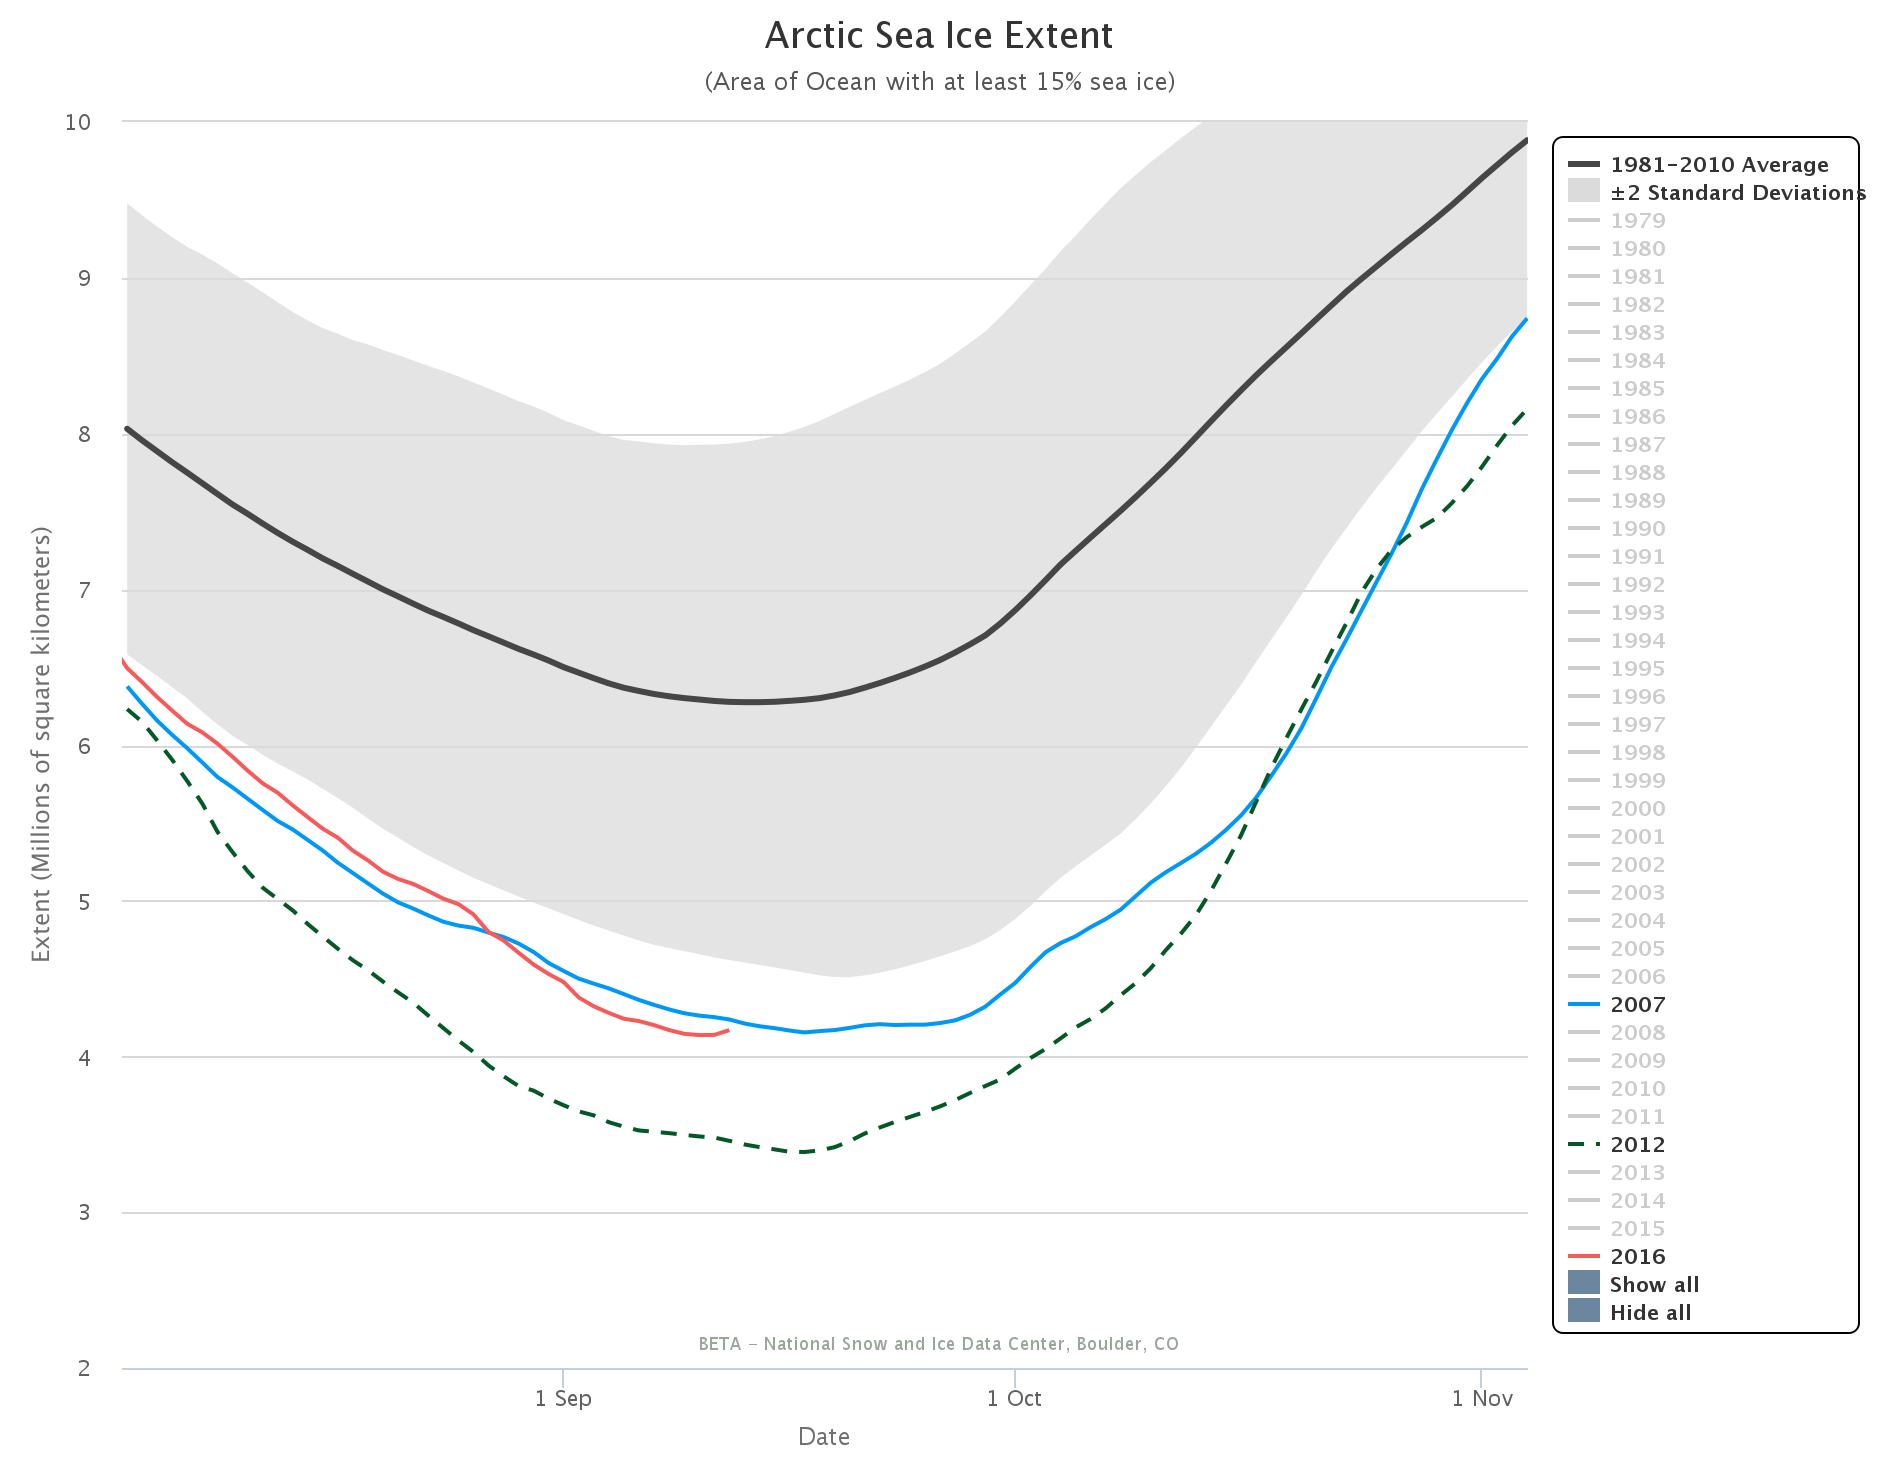
Amongst the “industry standards” Cryosphere Today area is missing in action so here’s the National Snow & Ice Data Center’s 5 day average extent:
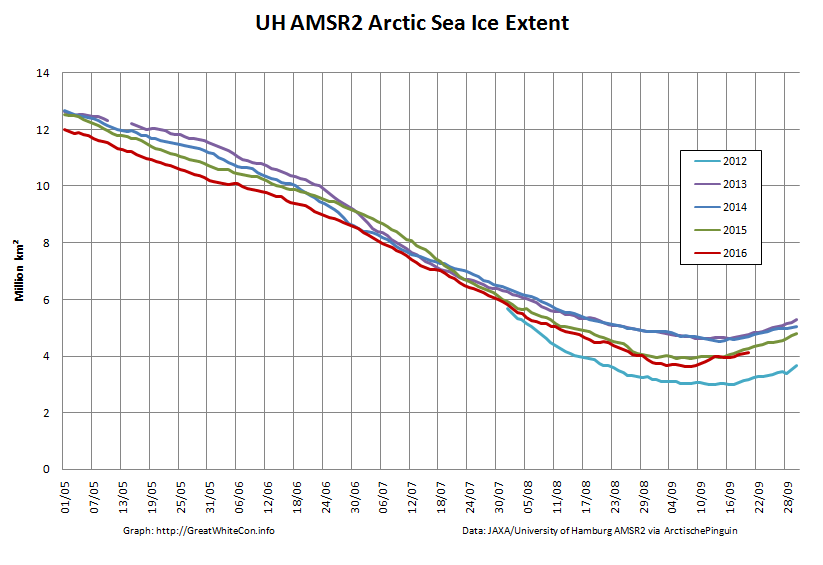
and JAXA extent:
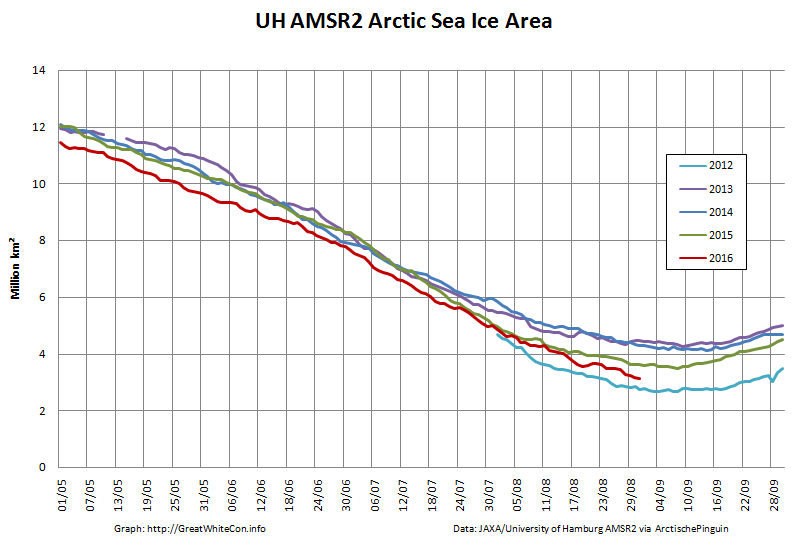
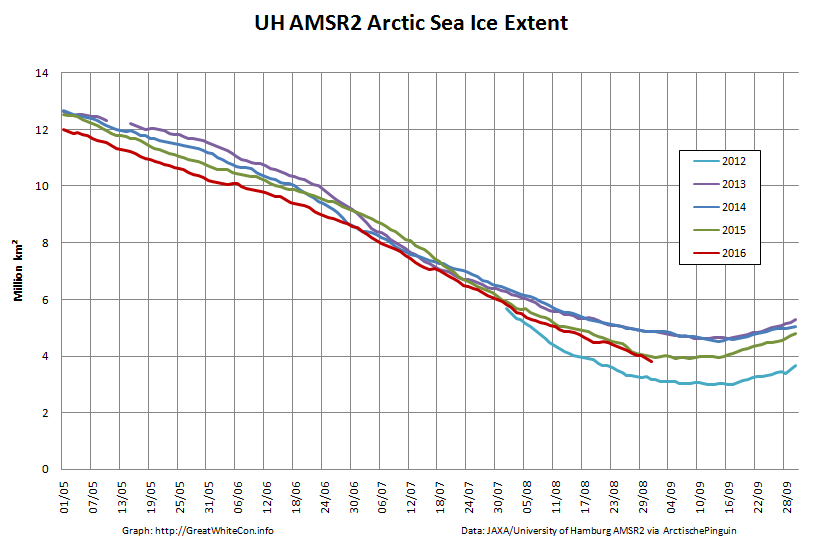
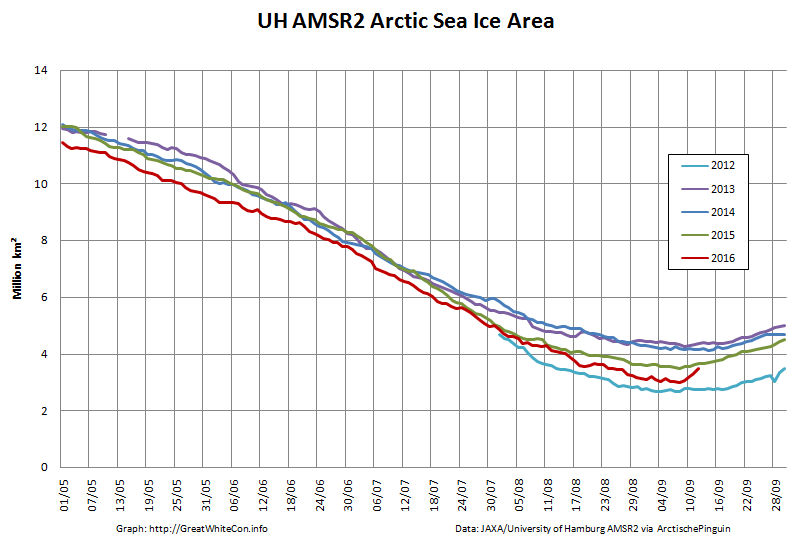
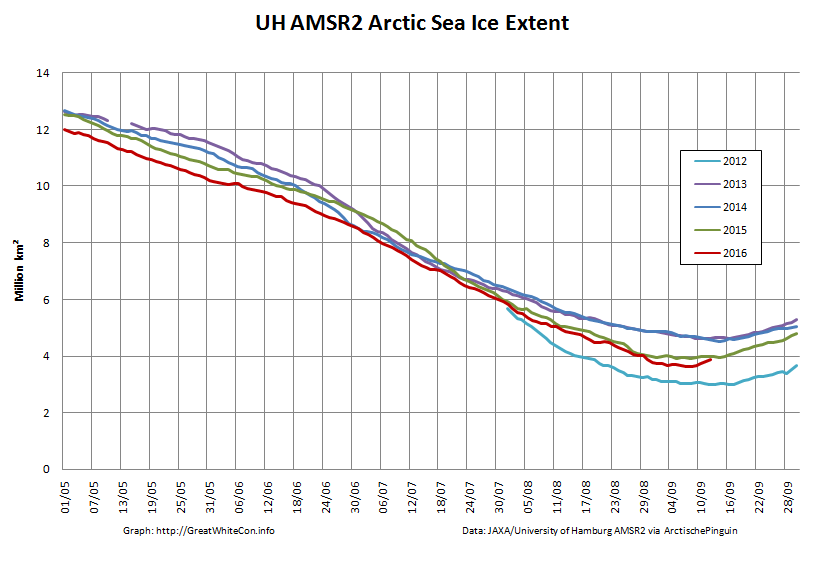
Finally here are “Snow White’s” favourite high resolution AMSR2 metrics derived by “Wipneus” from University of Hamburg AMSR2 concentration data:
Are there any other suggestions for numbers to keep a close eye on over the next few weeks?
Arctic sea ice volume, as modelled by PIOMAS, has been updated to August 2016:
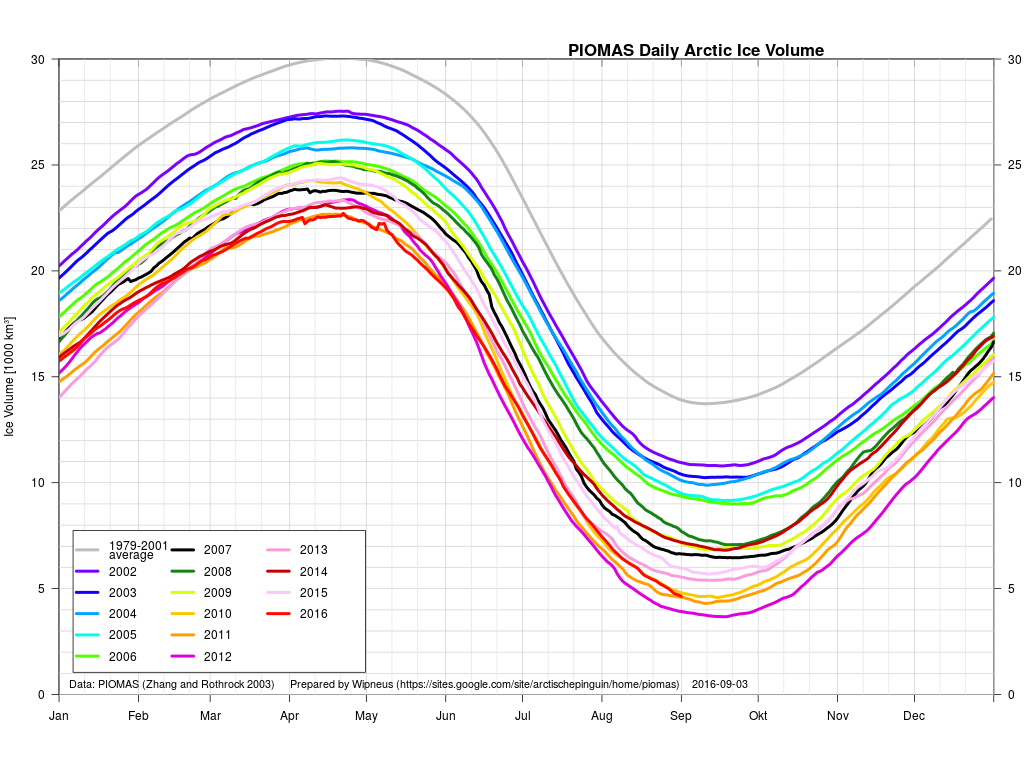
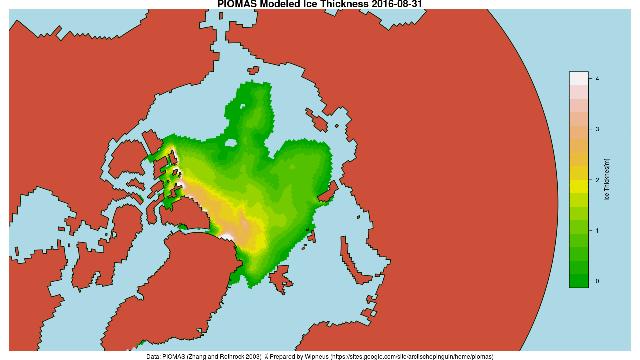
It’s currently 3rd lowest for the month, just a whisker behind 2011. Here’s the PIOMAS gridded data for August 31st 2016:
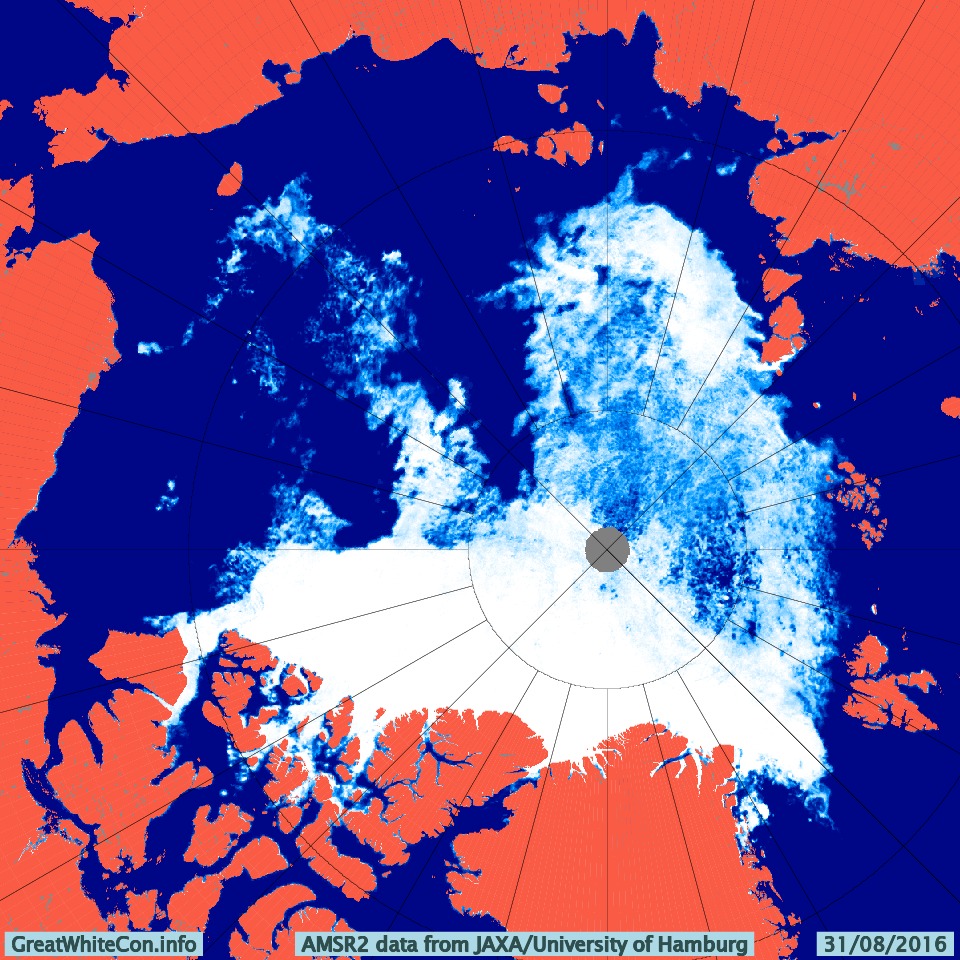
and for comparison purposes here’s the high res AMSR2 concentration map for the same date:
As suggested by Bill, here too are the Arctic Regional Ocean Observing System numbers. Much like the high res AMSR2 data they allow comparison between area and extent from the same sensor/algo combination, in this case SSMIS/NORSEX on a 25 km grid:
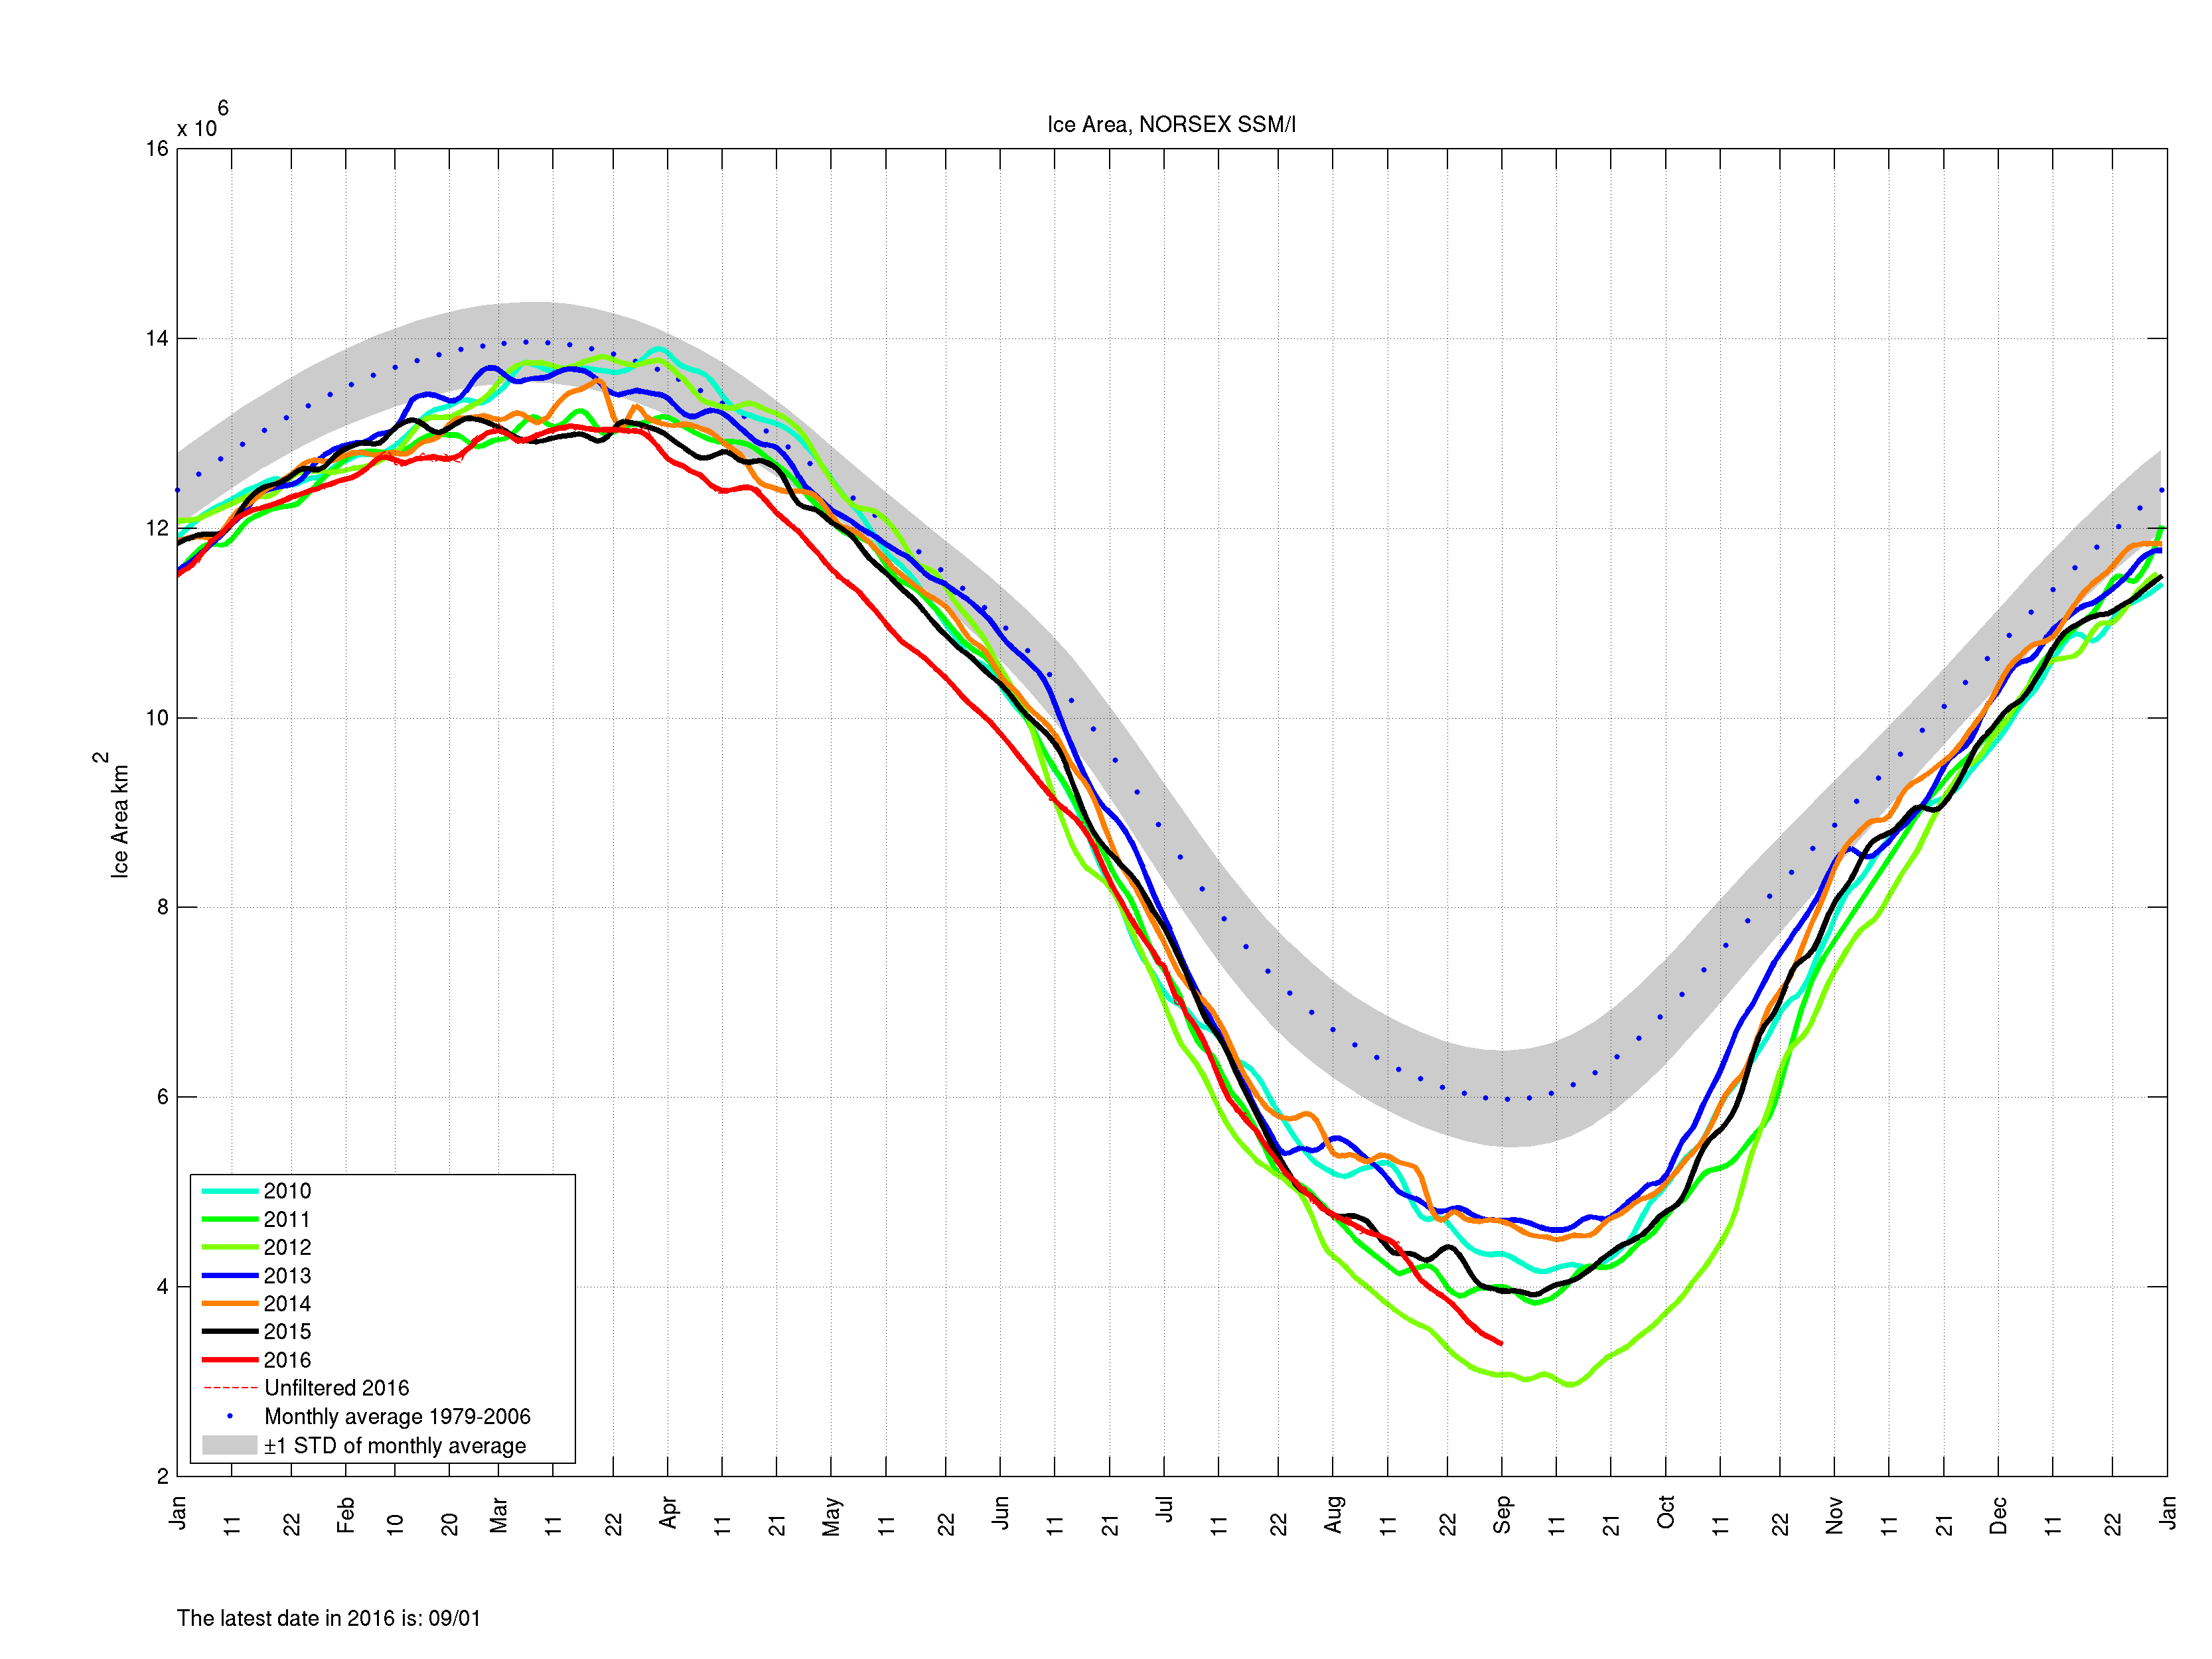
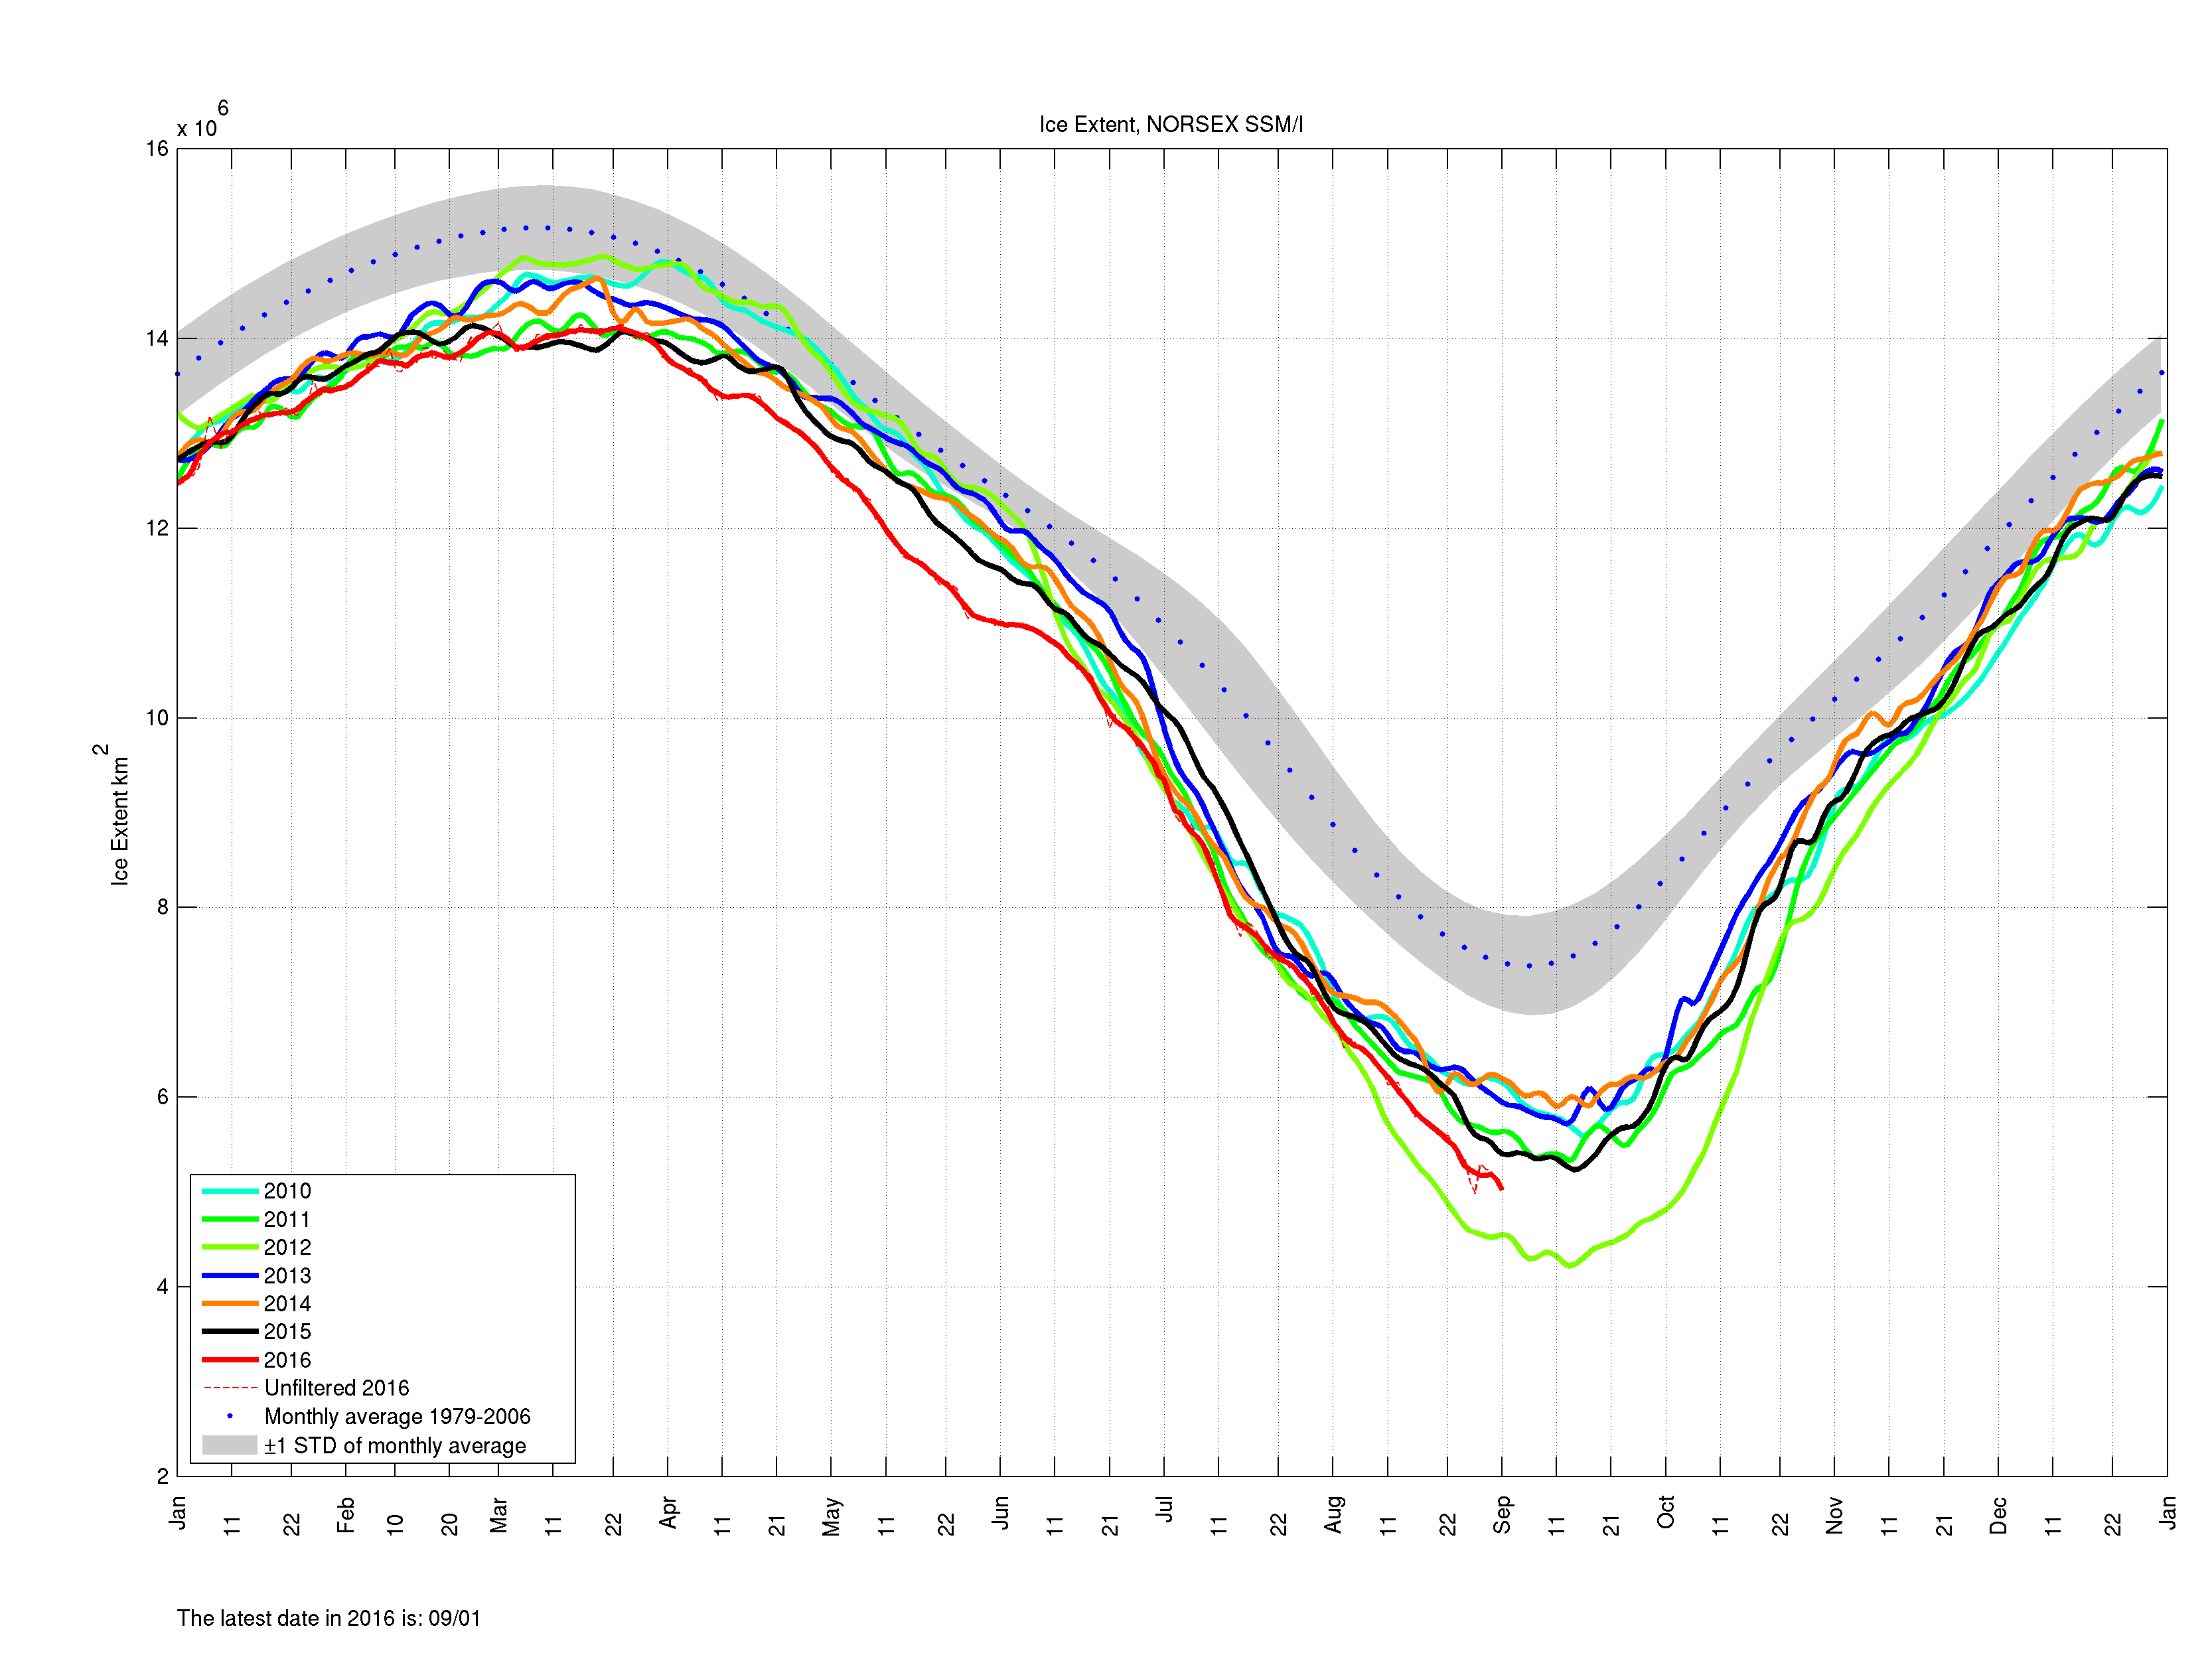
Both sources agree that currently the remaining ice is less compact in 2016 than it was in 2012.
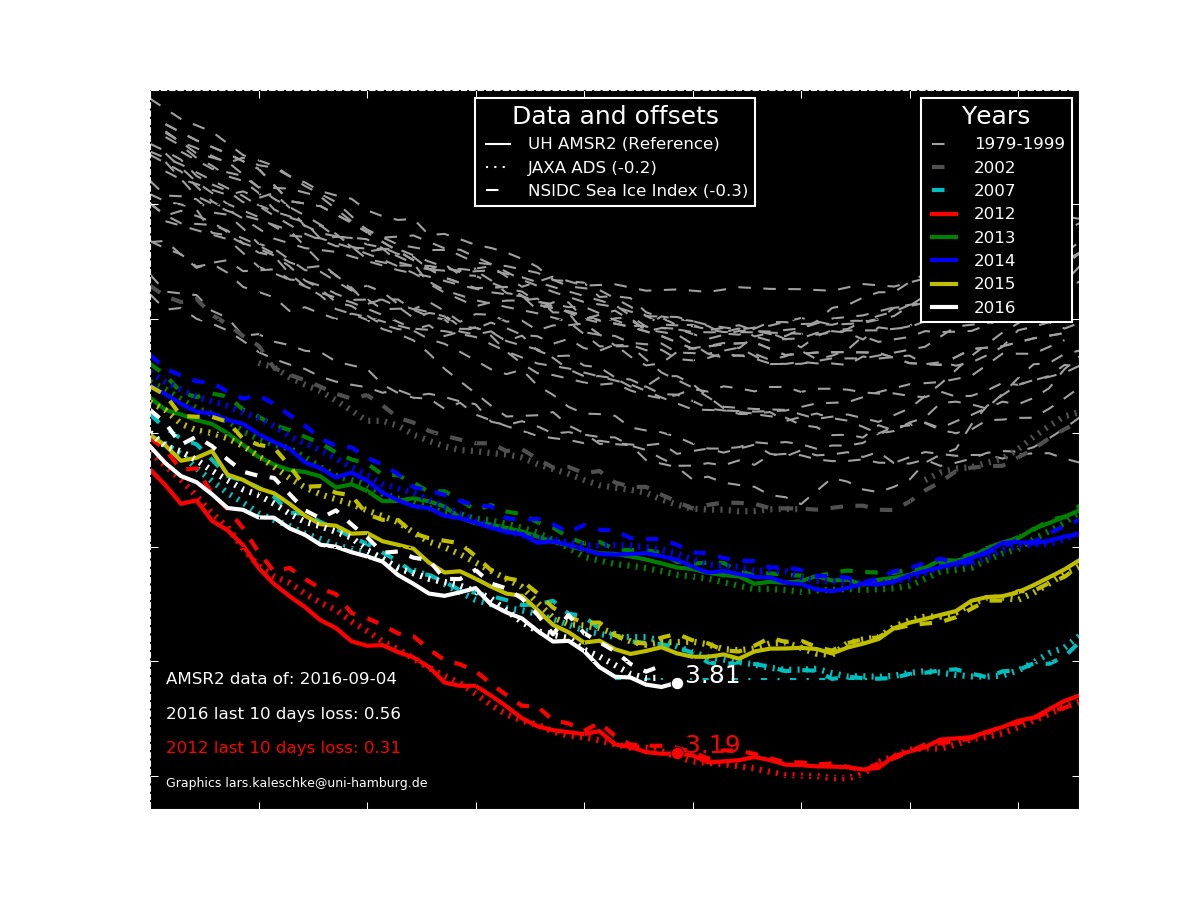
An interesting inter-metric comparison from Lars Kaleschke of the University of Hamburg:
#Arctic sea ice #SeptemberMinimum approaching. Different independent satellite data sources agree on trends. pic.twitter.com/GDM812lZ9Y
— Lars Kaleschke (@seaice_de) September 4, 2016
Here’s another twist on the University of Hamburg’s AMSR2 extent, courtesy of Lars Kaleschke:
Several of the metrics displayed above have increased over the last day or two. The 2016 minimum may be upon us, but another few days will have to go by before that’s finally confirmed. Whilst we wait here’s another metric to consider, as described on “Tamino’s” Open Mind blog:
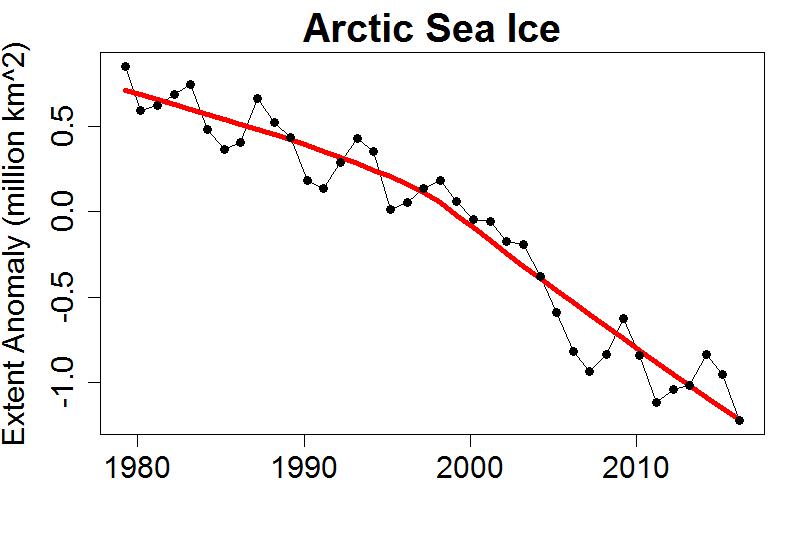
A plot of annual average extent also clearly shows the decline, and includes data from throughout the year rather than just the annual minimum. The figure for 2016 is the lowest on record, but the year isn’t done yet. If instead of averaging January-through-December we do September-through-August (to make the final year complete), we find that the most recent year is still the lowest on record:
Any way you look at it, Arctic sea ice is in decline. If you look at the entire year rather than just the annual minimum, the record year is this one.
The refreeze has certainly started now. A quick look through the metrics. First of all the Hamburg University high resolution AMSR2 matched set:
Area just squeezed under 3 million km². Next up is JAXA extent:
which just failed to fall below 4 million km². Last but not least, just for the moment, is the NSIDC 5 day trailing averaged extent:
The most striking this year is the unusually large gap between area and extent for this time of year, illustrated by this “compactness” graph from Arctische Pinguin:
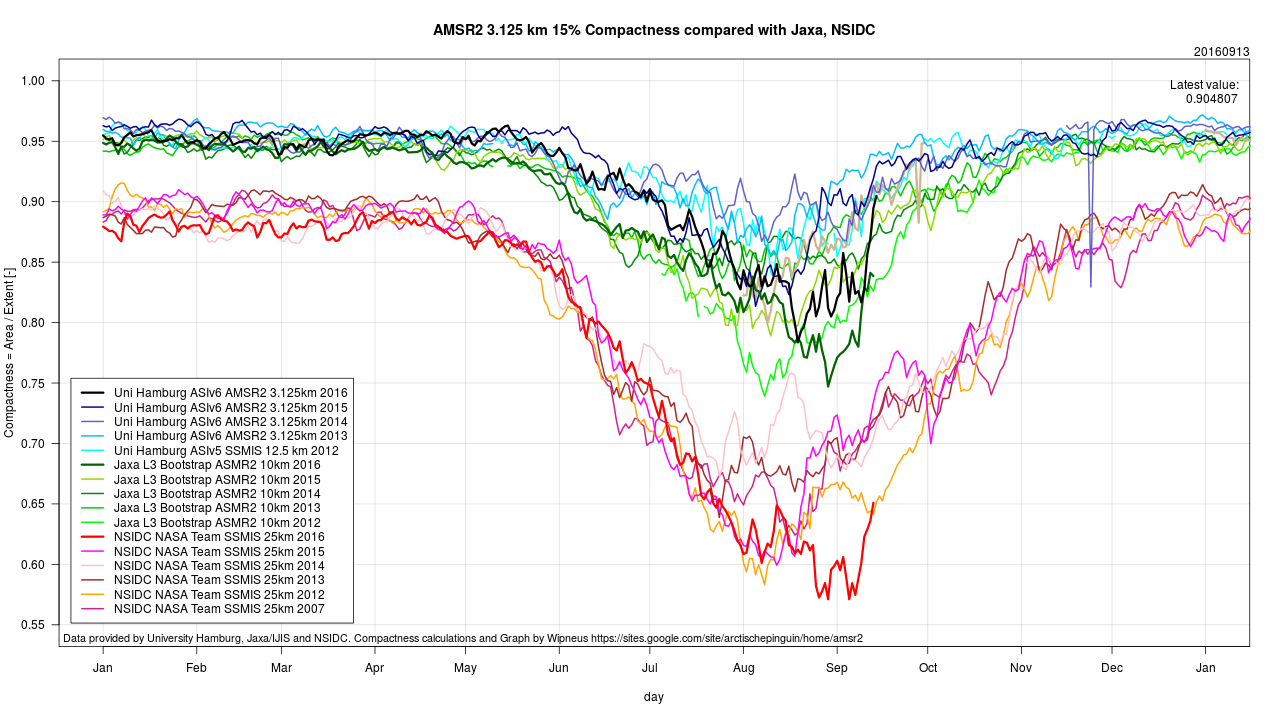
Note too the striking difference between different sensor/algo combinations for this metric!
With the minimum now beyond doubt, here’s a new graphic from Lars Kaleschke of the University of Hamburg:
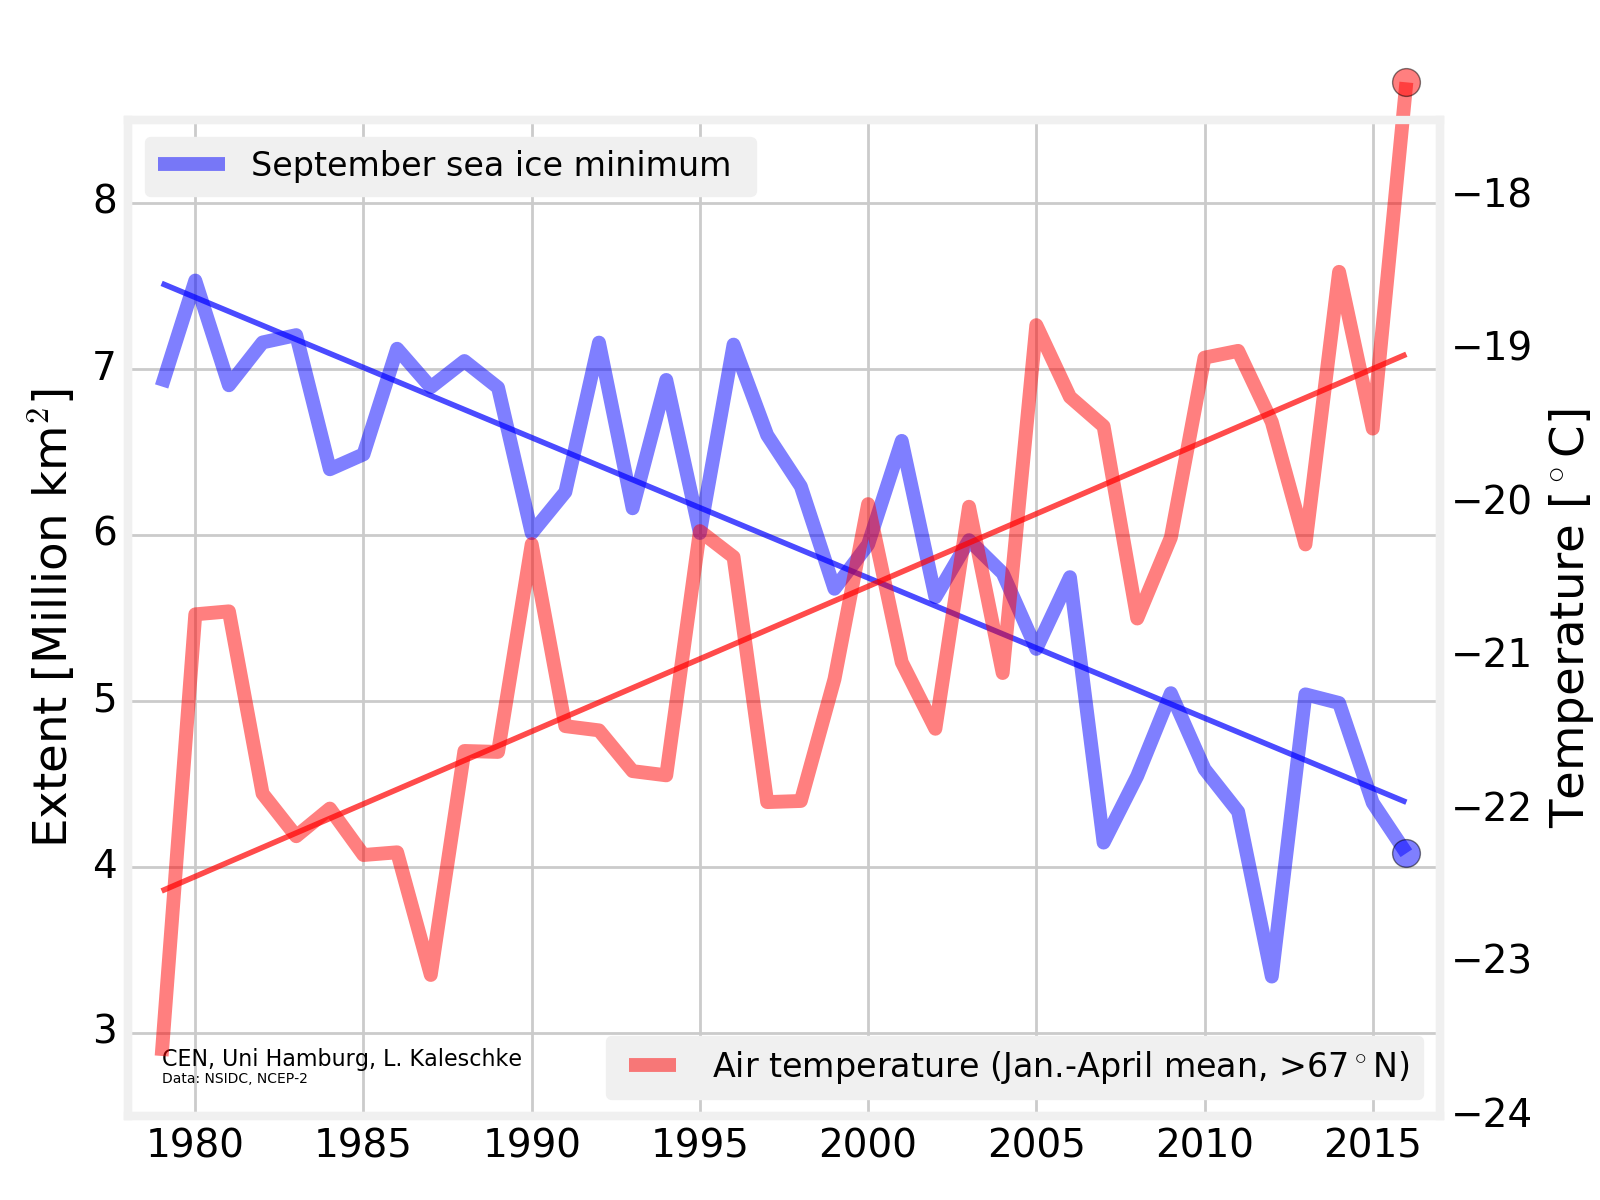
Need I say more?
The September cyclone has now done its worst:
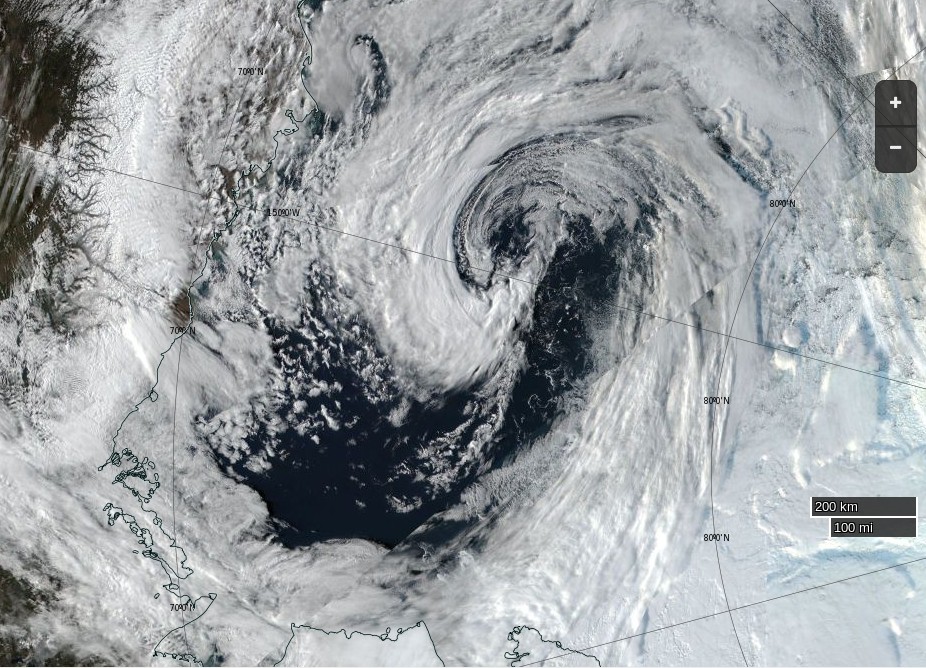
Leaving the area and extent metrics with an intriguing “double dip”:

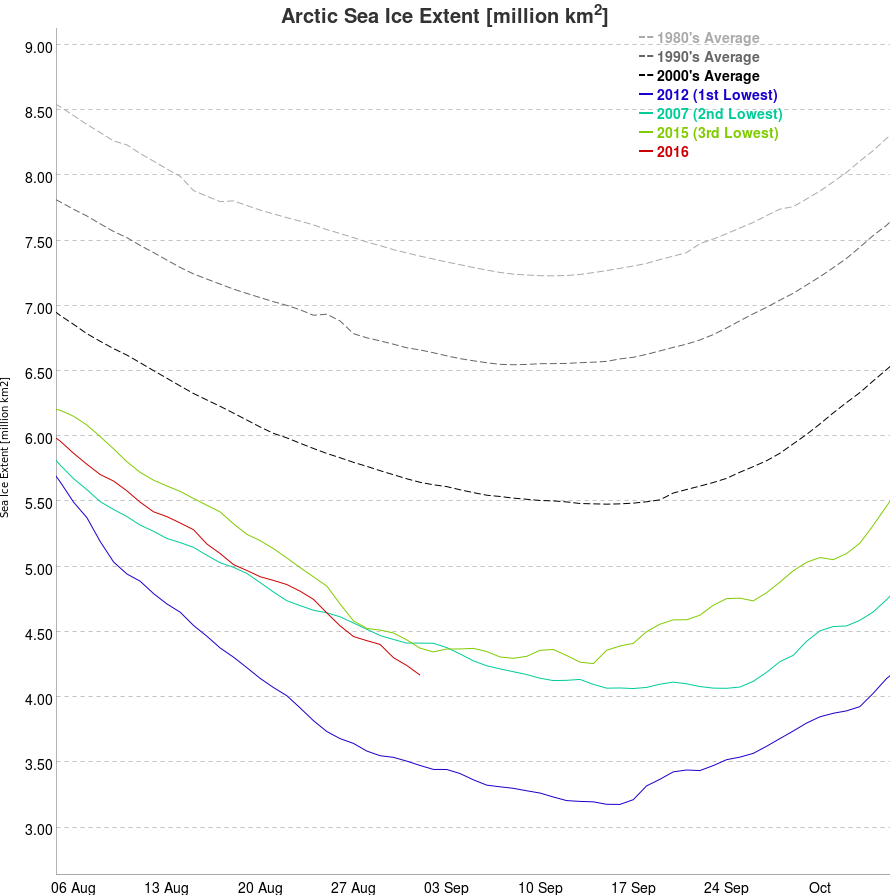
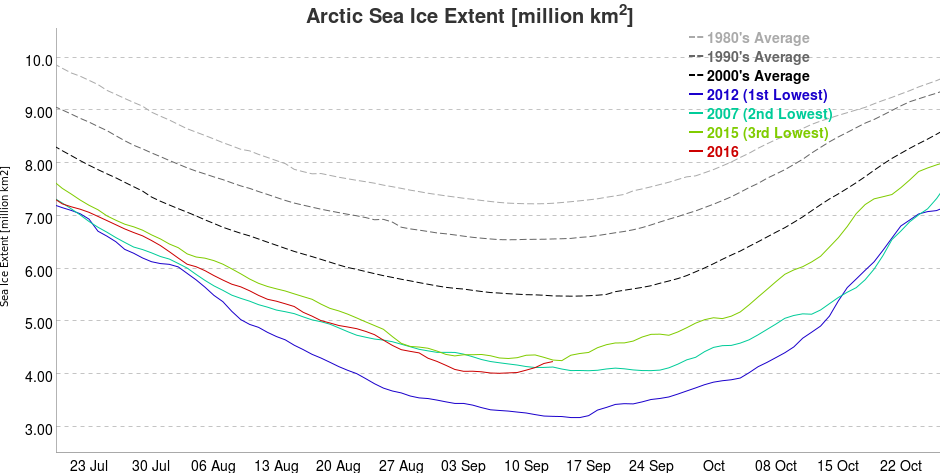
September 3rd – JAXA extent dropped to 2nd place below the 2007 minimum at 4.05 million km²
September 7th – JAXA extent minimum of 4.02 million km²
September 8th – NSIDC single day extent dropped to 2nd place below the 2007 minimum at 4.083 million km². This proved to the minimum value for the year as a whole.
September 9th – NSIDC 5 day trailing averaged extent dropped to 2nd place below the 2007 minimum at 4.146 million km²
September 10th – NSIDC 5 day trailing averaged extent minimum of 4.137 million km²
Arctic ROOS often gets cited by the residents of la-la land, but that’s a bit worrying for them as well.
http://arctic-roos.org/observations/ice-area-and-extent-in-arctic
Thanks for the suggestion Bill.
Arctic ROOS duly added above
Was just looking for a compilation that was simple enough I could take a look, and hey presto there you are. Thanks. I’m assuming you’ll keep this updated. Next question, will we have a longer season this year? That would be interesting.
Our pleasure Susan. We will of course keep things up to date, and at some length!
“Will we have a longer season this year?”
A very good question. I wish I knew the answer! Personally I reckon there’s a fair bit more melting potential around the periphery, so area should continue to decrease for a while yet, even as the centre starts to refreeze. What extent does depends on the vagaries of the winds though. Does your crystal ball predict compaction or dispersion?
This related article may also be of interest to you?
“Could Northabout Sail to the North Pole?“
JAXA extent fell to 4.05 million square kilometres yesterday:
That now puts 2016 just below the 2007 minimum and second lowest, with a big gap to the 2012 minimum of 3.18 million km²
However…….
As of this morning, the DMI plot has been redrawn from about mid-July onward, and has lurched upwards by several 100k sq kms across this entire period.
I’ve asked on the Forum if anyone knows the background.
At about the same time, the Bremen Uni AMSR2 plot has taken a sudden downward lurch.
My brain hurts.
Whilst it was amusing for the purposes of yanking Malice’s chain the revised DMI graph does look much more plausible:
A prompt explanation for the sudden change would be nice though. Meanwhile the Bremen AMSR2 concentration map seems to be missing some data:
Hamburg AMSR2 still looks sensible today though:
However Wipneus and his Raspberry Pi are moving so the associated metrics are absent for the moment. Back in the early days I managed to replicate his results. However the format of the data file seems to have changed since then, so new numbers may have to wait until he’s back online.
Following yesterday’s “brief hiatus” the University of Bremen extent graph looks sensible again today. It has been pointed out that 2012 is missing from the graph at the top. Here’s an alternative (and up to date) version, which is missing 2007 instead:
NSIDC single day extent has dropped to 2nd place below 2007 at 4.083 million km². Whilst the minumum could of reduce still further over the next few days, here’s how the NSIDC annual minimum extent graph looks at the moment:
The NSIDC have also published the latest edition of their Arctic Sea Ice News. The effects of waves on sea ice get a mention:
The NSIDC 5 day trailing averaged extent has now joined the daily value in 2nd place below the 2007 minimum, but still well above 2012, at 4.146 million km².