One eminent sea ice researcher certainly seems to think that time is indeed running out for the sea ice in the Arctic. First let’s take a look at the results of the first call for contributions of the 2015 melting season from the Sea Ice Prediction Network:
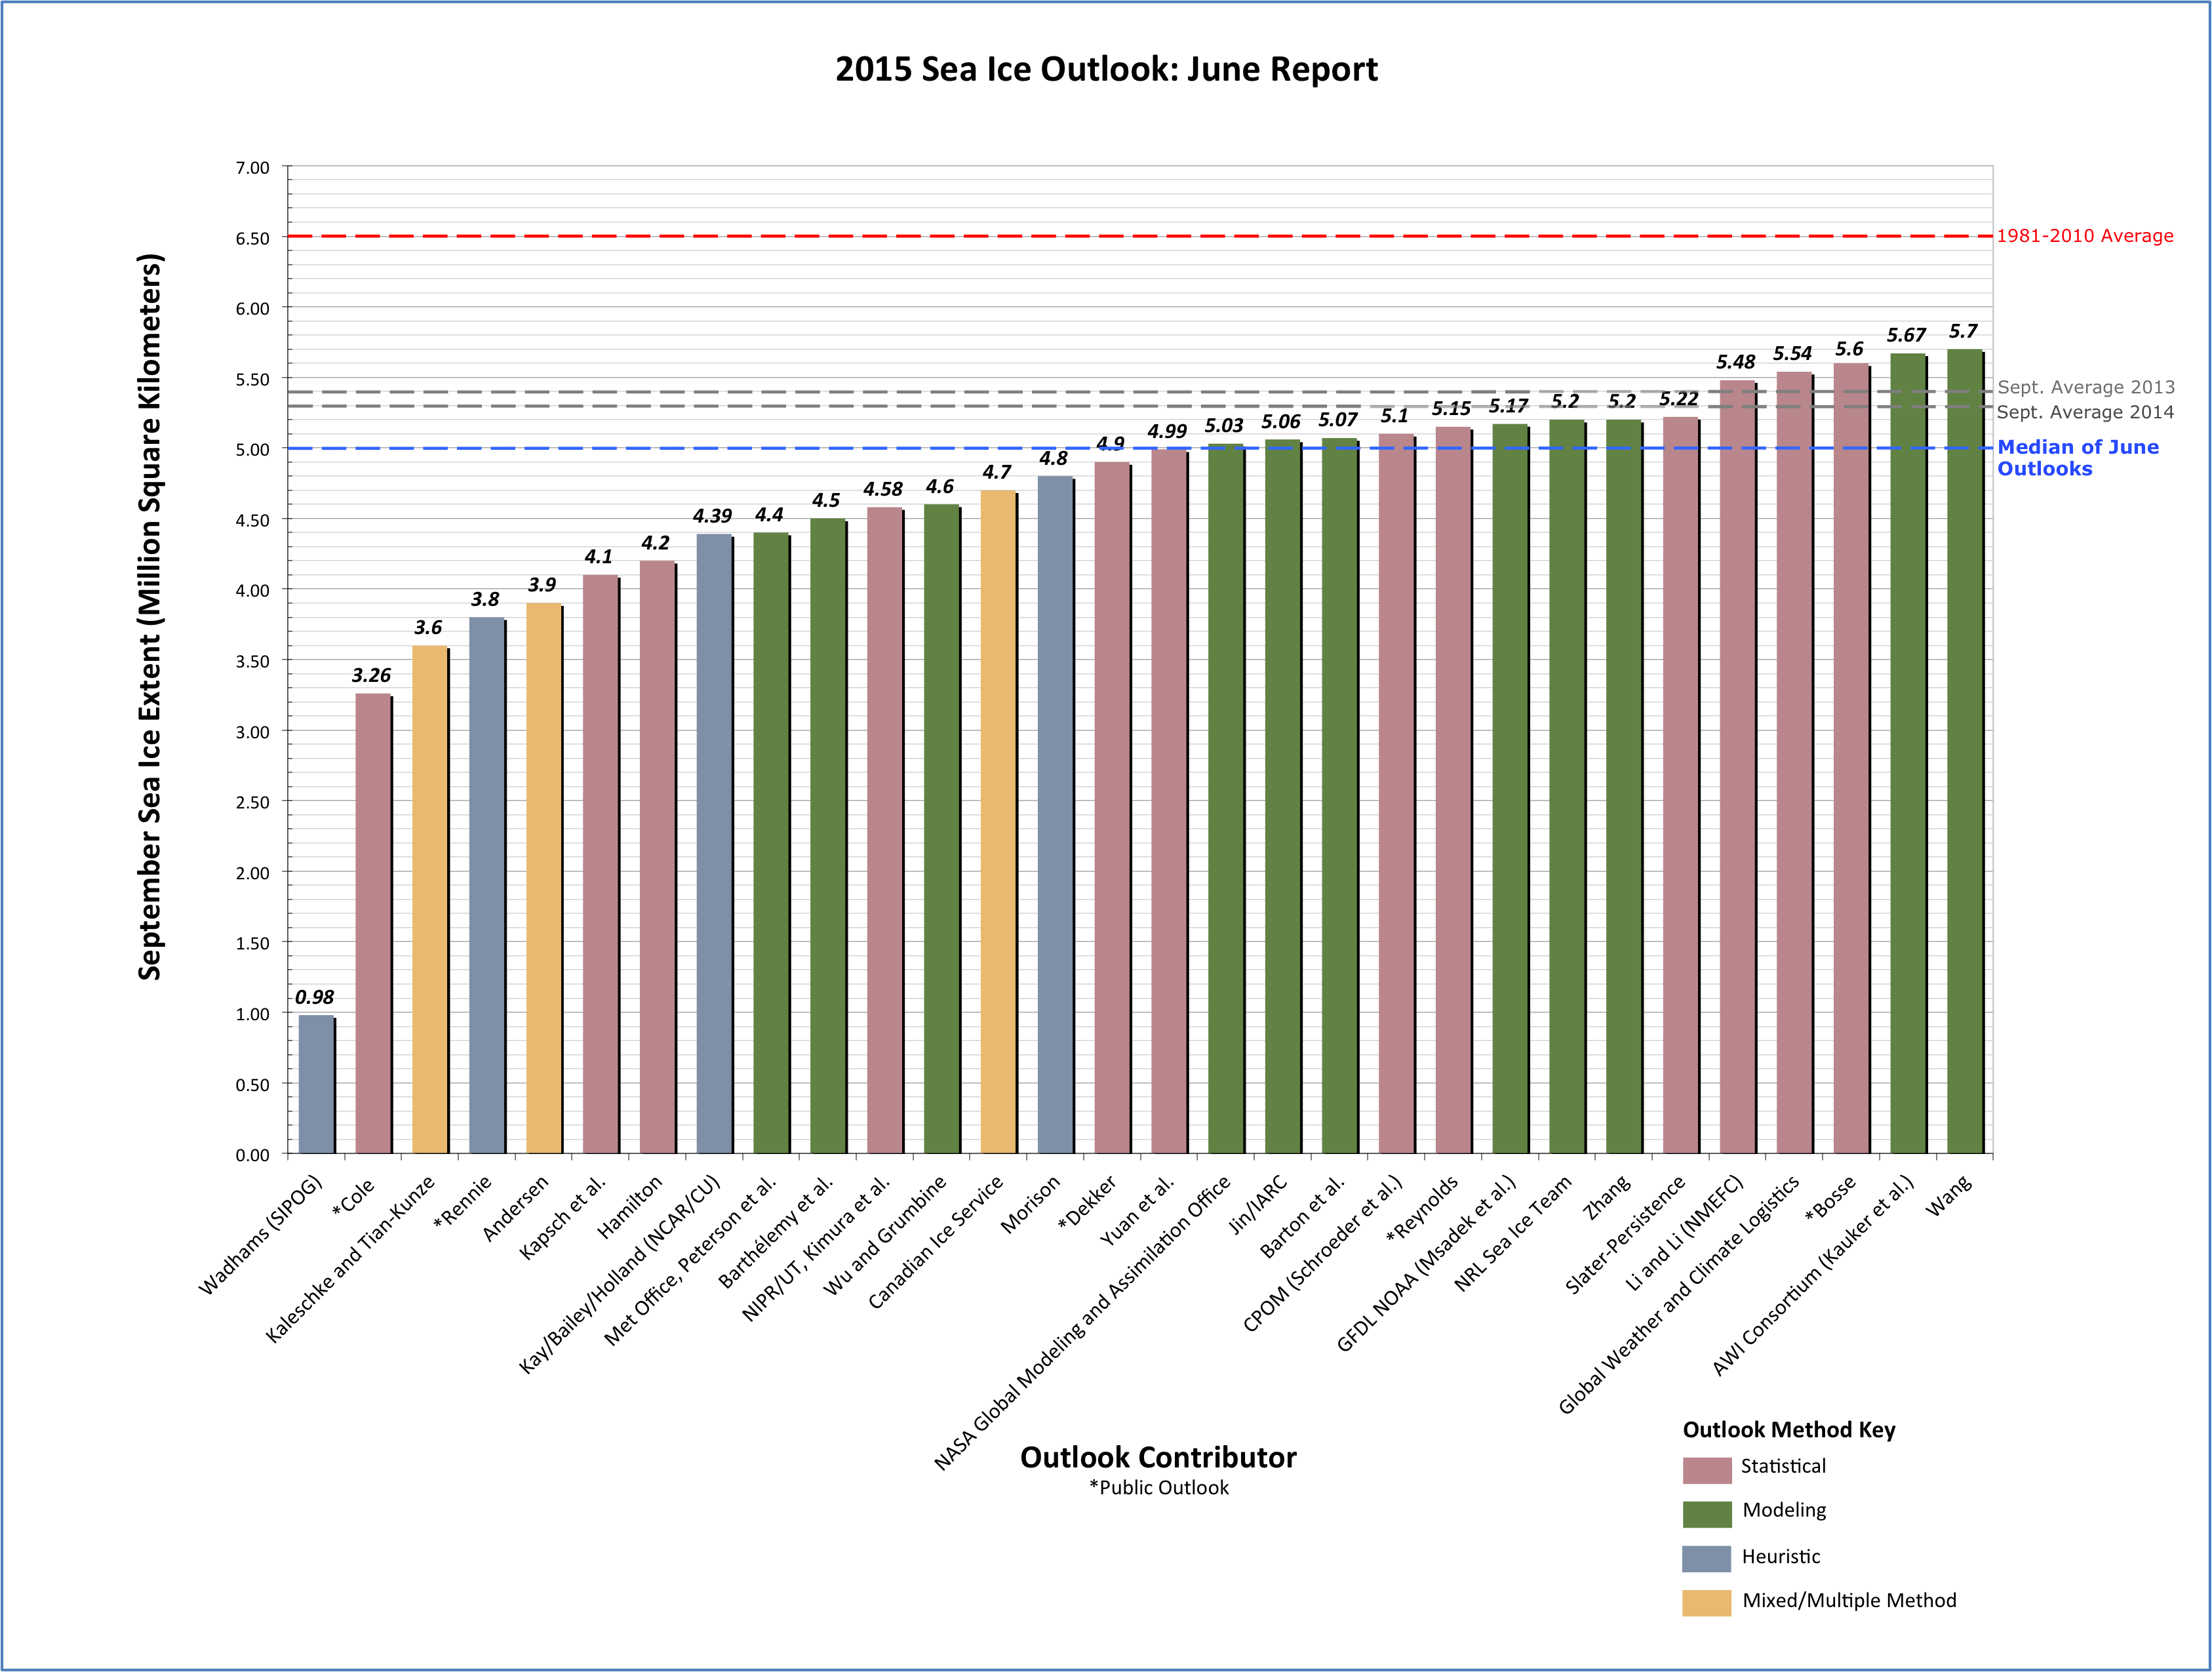
Note that in the bottom left hand corner of that graph there is a prediction of 0.98 million square kilometers labelled “Wadhams (SIPOG)”. The acronym refers to the Sea Ice and Polar Oceanography Group in the Department of Applied Mathematics and Theoretical Physics at the University of Cambridge, of which Prof. Peter Wadhams is the head. Before we get on to his explanation for what the SIPN refers to as “an extreme outlier” amongst all the other predictions, here’s a TEDx presentation given by Dr. David Barber, who is currently Associate Dean (Research) in the CHR Faculty of Environment, Earth and Resources at the University of Manitoba in Canada:
Here are what Dr. Barber refers to as the “seven surprising impacts” of declining Arctic sea ice:
-
Increasing coverage of young ice significantly changes atmospheric chemistry
-
More snow both preserves and destroys ice
-
Polar bear habitat can actually improve in some areas while deteriorating in others
-
Match-mismatch timing in the marine ecosystem increases vulnerability
-
Uncertainty as to whether the Arctic ocean will increase or decrease in overall productivity is a key unknown
-
Evidence that ice hazards are actually increasing while the world marshals to increase development of Arctic resources
-
Evidence that our recent cold winters are actually linked to our warming Arctic.
However those bullet points from David’s closing summary don’t actually mention the part of his presentation that most interested me. Listen carefully at 7:40 when he says that:
In 2009 we had our icebreaker down here and we went up this line that you see right here in this figure.
Here’s a version of the map Dr. Barber is referring that comes from a 2009 paper of his entitled “Perennial pack ice in the southern Beaufort Sea was not as it appeared in the summer of 2009“:
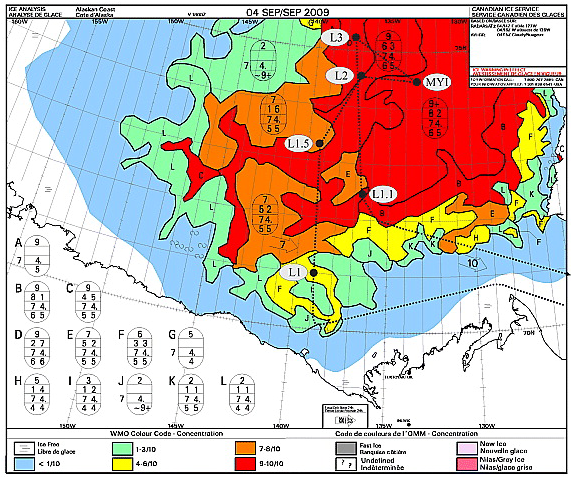
Here’s the relevant passage from the paper rather than the TEDx video:
We departed from station L1 heading north towards station L1.5, expecting to enter MY sea ice cover at about 71°20′N, 139°00′W based on remotely sensed information (Orange polygon in the figure). The Canadian Ice Service (CIS) ice chart (which relies extensively on Radarsat-1 data) for 4 September 2009 indicated the ship track would range from 7 to 9 tenths coverage and this ice would consist of partial concentrations of 5 tenths to 7 tenths old ice and from 2 to 3 tenths thick first year ice.
In situ observations of the sea ice conditions however showed that the ice we were traversing was not MY or thick FY, nor was it 7 to 9 tenths concentration, but rather it was a mixture of a few small MY ice floes (1 tenth coverage) interspersed in a cover dominated by small (10–100 m) rounded floes of heavily decayed first year sea ice (4 tenths). These floes were overlain by a thin layer of new ice (7 tenth) where freeboard was negative and thin ice growing between remnant pieces when the ice had a positive freeboard. Likewise, some new ice covered open water areas between floes.
This is the “rotten sea ice” David refers to in the video, about which he says:
It was so rotten in fact that the ship that we had does 13.5 knots in open water, and we were able to traverse that ice at 13 knots, yet the satellites all thought that this was very thick multi-year sea ice, because that’s what it had always traditionally been.
This information is obviously very interesting of course, but even more interesting (to me at least) is a subsequent paper by Dr. Barber about the same voyage of the Canadian Research Icebreaker Amundsen, published in 2012 and entitled “Fracture of summer perennial sea ice by ocean swell as a result of Arctic storms“. Here’s a pertinent extract:
We progressed through the heavily decayed ice region into a transitional region containing a mix of decayed old and FY sea ice floes, and finally into thick late summer MY pack ice. Using the onboard helicopter to survey the area, we identified a vast MY floe (10 km diameter), to which we intended to moor the ship, and conduct our typical science operations. The ice in this area was much thicker than the heavily decayed FY ice we that we had encountered the previous day to the west. Our helicopter EMI system recorded overall thicknesses of sea ice around station MYI (e.g., mean = 2.0 m, max = 10 m).
As ice teams initially prepared to deploy to the ice, we noticed the appearance of a swell from the ships helicopter deck. Laser data collected during the helicopter EMI survey at station MYI indicated a swell period of 13.5 s, and a wavelength ranging from 200–300 m. Laser data were collected while the helicopter hovered over a large MY ice floe. These data were augmented with three-dimensional dynamic ship positioning data, which revealed approximate ship heave amplitude of 0.4 m, also with a period of 13.5 s. The swell caused the vast MY ice floe nearest the Amundsen to ride up one side of the swell and fracture as it crested the wave peak, creating smaller ice floes of width approximately one half of the wavelength of the swell. In a matter of minutes from the initial onset of swell propagation, all large MY ice floes in the region were fractured in this manner, yielding a new distribution of smaller MY ice floes ranging from 100–150 m in diameter. A helicopter-borne video system recorded this event in still photographs along its flight track which were later combined to create a series of photo mosaics.
On 09 September 2009, we conducted a longitudinal helicopter EMI survey at 72.5 N, and determined the limit of the swell penetration into the pack ice at 72.526 N 134.51 W, a penetration of 350 km. Furthermore, the rotted FY ice margin was heavily fractured, with small floe sizes ranging from 20–50 m in diameter.
Moving on from Manitoba to Cambridge, Peter Wadhams has recently recorded an interview for The University of Earth, which describes itself as “an entertaining educational reality television series”. Here it is:
So what is “the reality” of the situation in the Arctic? Prof. Wadhams doesn’t explain his “extreme outlier” 2015 prediction in detail in the interview, but he does identify three potentially significant problems:
- The “minor thing, in a way” of several feet of global sea level rise this century due to melting of the Greenland ice sheet
- A sudden increase in the rate of “global warming” due to Arctic albedo feedback, which leads to
- The exposure of the methane hydrate bearing continental shelves off Siberia to increasing water temperatures as the sea ice above them melts. “It’s a massive risk, if you do a risk analysis”
Peter also highlights the same concerns as Barber et al. 2012, often referred to in the literature as “waves-in-ice“. I highly recommend watching both videos from cover to cover. However if you’re in a rush then at least skip to 28:30 minutes where he points out that on his cruise around the Arctic this coming September:
We’re looking at one particular thing, which may not be the most important thing, but the retreat of the sea ice in summer is going much faster than computer models predict, and we think that one factor there is the fact that as the sea ice retreats it opens up this huge area of open water in the Arctic Ocean which then becomes like an ocean, with lots of waves and storms and swell, and the waves themselves break the remaining ice up and cause it to retreat faster so that there’s a kind of collaborative effect there that the remaining ice is vanishing faster because of so much open water producing wave action.
Getting back to the current situation in the 2015 melting season, here’s what the University of Hamburg’s AMSR2 sea ice concentration map currently reveals:

and here’s what the Slater Probabilistic Ice Extent methodology is predicting will happen over the next 50 days:
Both suggest to me that although the rate of decline in the area of Arctic sea ice is not currently abnormal for post 2007 years, it may well become so in another month or so, when the extent curve “normally” starts to flatten out. Possibly even sooner than that, because here is the current GFS 2 metre temperature map for the Arctic:
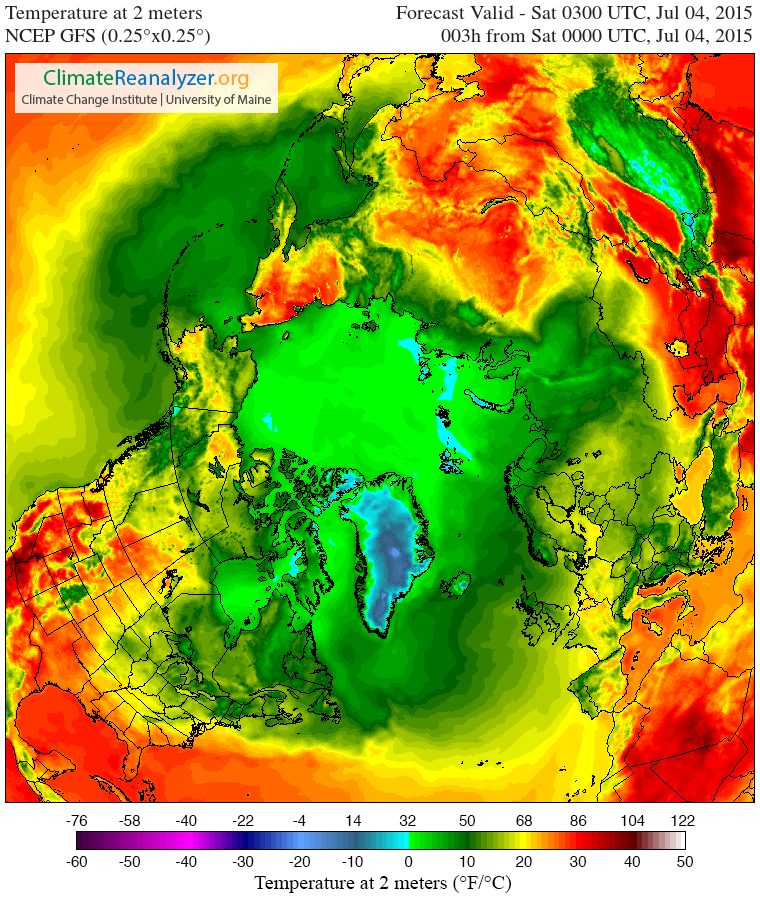
and temperatures, particularly on the Pacific side of the Arctic, are forecast to get warmer still over the next few days.
Watch this space and we’ll keep you posted, but in the meantime here’s a final thought from Peter Wadhams:
Our children have a future only if we take action now.
In a personal communication Prof. Wadhams informs me that:
This year I’m going out in September in the “Sikuliaq” (University of Alaska) to do some more specific wave-ice interaction experiments [in the Beaufort Sea Marginal Ice Zone], assuming there is any ice to experiment on.
[/Edit]
What is really sad is how many of the best and brightest scientists are now repeating the IPCC story because of pressure from big money and their political machines be they right or left wing.
The lat 2 years of ‘recovery’ has seen a large increase of MYI. 20 years ago that meant 5+ year old ice that melt very little. Now it seems to mean 3+ year old ice even if most of it melted. By my way of thinking that should mean even if it grows to 3m+ in thickness it would still have a lot of salt in it which means rotten ice that is very little different then FYI. If that is the case all it would take is air and/or water heat and that would vanish very fast. Is Wadham’s team extreme? certainly. Is it probable? Very unlikely. Is it possible? Within mathematical possibilities especially if our current images and presumptions are fooling us. That is what is very scarey.
Remember how far behind the curve the IPCC always is.
sad to see this on here jim.i had you down more as a realist than alarmist . wadhams is actually an outlier among all the people involved with monitoring the arctic ,eminent ? well that would be a matter of opinion.
I am a realist Chilly. I’ve recently added a section discussing a couple of David Barber’s papers. Have you read it (and those papers) yet?
I’m also reporting what Peter Wadhams said recently, together with the caveat that he’s “an extreme outlier”.
re wadhams 3 main pointers. global sea level rise is not accelerating . albedo feedback has actually increased due to the increase in antarctic sea ice ,which reflects far more sunlight than the arctic sea ice due to its position.
what happened in the past with methane when these areas of the shallow seas were warmed up in times of less sea ice ? whatever happened it certainly was not a problem.
Surely the extent of sea ice in the Antarctic has no obvious bearing on the period and height of swells in the open water of the Arctic Ocean in late summer?
of course not jim, i mentioned it in relation to wadhams global albedo comment.
in other news “And finally, ice in the northern half of Davis Strait (Fig. 10) is well above average this week and the highest it’s been since 1994 (and higher than 1971)! ” http://polarbearscience.com/2015/07/01/hudson-bay-breakup-later-than-average-longer-hunting-season-for-polar-bears/
this is another resource you should pay attention to jim. several times it has made a mockery of official assessments of ice coverage by showing polar bears on ice that supposedly did not exist according to official channels.
Chilly,
1) “Arctic albedo feedback” + “global warming” != “global albedo”
2) “Comments are closed” over there, so one cannot quibble
3) There’s currently greater extent in Hudson/Baffin than in recent years, but that’ll all be gone by September
4) Please provide a link to an example of the “mockery”
Up to 20% of collared polar bears located on ice that officially does not exist, says the PBSG http://polarbearscience.com/2014/07/31/up-to-20-of-collared-polar-bears-located-on-ice-that-officially-does-not-exist-says-the-pbsg/
as i said, if we are going to comment on global albedo in the terms of global warming,we have to take into account global albedo jim, which is a lot higher due to the increase in antarctic sea ice.
quibble away jim.
could you pass on this hint to chris reynolds jim. the password for hycom cice is as obvious as it gets 🙂 (a good example of people that are very clever with numbers being unable to apply common sense)
I think he’s worked it out now!
Chilly,
1. Round here we generally use a 15% extent threshold. For some reason best known to himself Steve/Tony prefers the deprecated DMI 30% threshold. If Susan insists that “less is best” who am I to argue?
2. At the risk of repeating myself “Arctic albedo feedback” is not the same thing as “global albedo”.
Regarding your (different!) point, for your starter for 10 please read this:
http://forum.arctic-sea-ice.net/index.php/topic,1128.0.html
as i said, i am well aware of the albedo implications jim. the discussion you link to has far too much assumption based on models and supposition for my liking. we can only deal with what we know.
mr abrupt sea leel rise should go and check out the increase in albedo not just for antarctic sea ice minimum ,but also for the maximum .when the arctic is at maximum it reflects near enough zero sunlight. not the case for the antarctic.
Chilly – At the risk of repeating myself repeating myself, do you understand what the phrase “Arctic albedo feedback” means?
go on then jim, explain it to me. i know you want to 🙂
Does this image help at all? From a camera in the CAB at approx. 76.45 N, 161.90 W:
i see open water reflecting sunlight ,ice with a frozen covering of snow that would appear to be a good example of high albedo,and an ablation stake that appears to be the only thing in the image that is heating up in the sunshine as the snow around the base has melted a small amount.
Would it help if I pointed out that the webcam was originally trained on IMB buoy 2015B? The buoy’s now bobbing about somewhere in the midst of all that open water, which it reports is now at a temperature of about -1 °C.
i think it would be a good idea if they maintained both data/model sets for continuity. the arctic might not have all melted,but by god the asif has gone into meltdown. regardless of this years outcome i cannot believe the rhetoric based on a short period of weather against the positions people took last year when things were just as slow but temps were down.
anyone that actually cares what happens to the arctic would not be wishing for all the ice to melt.i get the impression there are a lot of embarrassed people over there after two years of the ice failing to disappear,and they would like to see it all melt to save face and they could not care less about the implications for the arctic orthe people and wildlife it contains. shame on them.
off topic,but i think you might find this interesting jim.
Antarctic specific features of the greenhouse effect
Holger Schmithusen
Abstract. CO2 is the strongest anthropogenic forcing agent for climate change since pre-industrial times. Like other greenhouse gases, CO2 absorbs terrestrial surface radiation and causes emission from the atmosphere to space. As the surface is generally warmer than the atmosphere, the total long-wave emission to space is commonly less than the surface emission. However, this does not hold true for the high elevated areas of central Antarctica. For this region, it is shown that the greenhouse effect of CO2 is around zero or even negative. Moreover, for central Antarctica an increase in CO2 concentration leads to an increased long-wave energy loss to space, which cools the earth-atmosphere system. These unique findings for central Antarctica are in contrast to the well known general warming effect of increasing CO2. The work contributes to explain the non-warming of central Antarctica since 1957.
The term negative GHE might seem to sound odd, as we think of GHGs to act like a blanket for the planet, shielding terrestrial radiation from being emitted to space. “Anti-shielding” does not make sense. The following thought experiment demonstrates that GHGs can actually help the planet to lose energy, that would not be emitted without them:
http://elib.suub.uni-bremen.de/edocs/00104190-1.pdf
might be worth adding it to the antarctic section of the arctic sea ice forum.
Have you actually read the PhD thesis you cite? I shows that whereas the vast majority of the planet warms as CO2 is added to the atmosphere, that same increase has a cooling effect in central antarctica during part of the year (8months)
The effect of that on radiative balance is this: in the average US atmosphere increase of 100ppm CO2 increases GHE by 1.15 W/m2, in central antarctica yearly averaged decrease for 100ppm is 0.08 W/m2.
Why didn’t you tell us straight away?
why spoil the fun. i now know you read it. jim provides links to read sometimes, i do read them. jim obviously did not read this one or he would have highlighted that before you.
another piece of the puzzle that highlights science has barely scratched the surface of actual atmospheric physics ,imo of course.
My apologies Chilly, but I’ve been visiting Westminster sans PC. Normal service will be resumed as soon as possible. By way of some additional context, here’s another link for you to follow:
https://twitter.com/jim_hunt/status/621625318311378944
Re my post recently on Neven’s blog, spot the denial argument.
Keep repeating irrelevant and misleading data
When challenged successfully change the subject
Denigrate others for their view and attitude whilst ignoring self attitude
Use any article to prove a point even if it completely disagrees with your previous point. The only point being that it disagrees with the view of the concerned AGW reporter.
In destruction of some of the arguments above.
Had Chlily actually read any of the literature, S/He would have realised that the wind changes which are causing the Antarctic surface cooling and creating the extra ice, are locking in the extra heat under the ice; which is undermining the extremely thick landfast ice shelves (the sea ice is very thin in comparison, meters instead of tens of meters), which is, in turn, accelerating the ice discharge from the Antarctic Glaciers.
The net effect is that Antarctica is producing twice the discharge of Greenland and it is discharging from both East and West.
Chilly would also have realised, had S/He done some reading and research or even read the news, that sea level rise is currently running at approx. 3.5mm per year (averaged at 3mm per hear from 1993, but 2000’s and onwards is higher). That the 7mm sea level drop in 2010 created the catastrophic floods of 2010/11 and returned to the sea at the end of 2011, keeping the 3.5mm/pa average ongoing.
S/He would also, had S/He been watching, realised that The Wunderground tropical page recently had to increase the SST bar from a max of 32C to 35C because the max SST exceeded the bar.
But why bother with small technicalities like that.
Or the fact that even a 10cm rise in sea levels raises the probability that the Thames Barrier will be overwhelmed to such a point that risk mitigation may require that it is enlarged and that the defences are updated. At a cost of tens of billions.
Then Chilly upbraids us for wishing for the Arctic ice to disappear. Hell I don’t want it to disappear but it appears to be the only way some people will finally understand the size of the problem.
For 200 years the entire output of humanity’s mechanisation has been pumping greenhouse gasses into the atmosphere. So much so that we have created 15,000 years of natural warming in 200 years. Until _Someone_ wakes up and smells the coffee, then we’re going to keep on pouring fuel on the fire until not only is the Arctic ice gone but the methane clathrates have melted out and Greenland is locked into a one way cycle of terminal self reinforcing melt which will only end with 90% of the Greenland ice cap gone. It doesn’t matter if that cap finally disappears in 100 years or 1,000 years, only 10% of it will terminally destroy our current civilisation; war will finish it off.
Big albedo numbers may sound sexy, but, in fact, they are just another symptom of the problem. The main issue is that the cost of this won’t be money. It will be lives. up to 2 Billion of them.
My wife wants me to write a book when I get some spare time (if she’d stop taking all my spare time it would help).
I was thinking about “The Climate Trials”. No not the one where everyone gets on at the Scientists and convicts them for lying to us. The other one. Where the “Newly Outraged Ostriches” convict all the denialists for stopping action when it could have really made a difference.
The charge?
Genocide of 2bn people…
The penalty?
Death…..
That’s how I feel about it which is probably why I’m not the slightest bit interested in polar bears or Antarctic Albedo when talking about the destruction of one of the planets TWO climate regulation centres. For all I care all the polar bears can get on land and mate with Brown bears. It’s happened before as genetics show. What I care about is the 2bn unsuspecting poor people who’re going to be dead in 50-100 years for the price of a little action now….
so how does that view sit with recent papers citing antarctic land fast/ sea ice thicker than previously thought ? i only read the literature , and very often there are conflicting papers on the same topic. in that situation all i can do is form an opinion based on what i have read ,that opinion may well be wrong.
have any of you guys worked out who f.tnioli is yet. it took me a while, but now i think i know, he is playing a blinder. i suspect neven has an idea he is not what he seems.
80% of the worlds population lives on less than $10 a day,and you think they care about what happens in 100 or 1000 years. oh to be a privileged westerner eh.
we are chopping down rain forests in south america for fancy furniture (hope you do not have any in your house) and to make way for palm oil plantations , centuries old hardwoods in north america ,to make pellets that need to be transported by diesel burning ships over the atlantic to burn in uk power stations.
all while polluting huge swathes of land in china with waste from precious metal processing (poisoning thousands of those poor people we were talking about in the process) ,i feel there are far,far bigger immediate concerns than carbon dioxide levels well below the ideal threshold for plant life.
have a look at the greening of the planet as a result of the increase in carbon dioxide, it is a wonderful sight.
worried about sea levels rising , really ? no change in the rate of rise in the data ,and as there is little water leaving the planet, the distribution will vary over long periods of time, sea level is not a static entity , no matter what anyone says.
jeff masters can do what he likes with temp scales on his blog, i prefer this http://www.ospo.noaa.gov/data/sst/anomaly/2015/anomnight.7.13.2015.gif
and once the el tinio dissipates those global sea surface temp anomalies aint going to look so hot, if you will pardon the pun.
unless they build the thames and london onto stilts it will be underwater eventually anyway , due to estimated subsidence of 5 cm per century. fortunately i live in scotland which is set to rise by 10 cm over the same period. we will welcome those from the south with open arms.
i would save writing the book until climate science gets a bit further down the road and gets to grips with some of the early problems it is having now,you wouldnt want to be joining wadhams with the egg all over the face look ,would you ?
“We are chopping down rain forests in South America for fancy furniture”
“You wouldn’t want to be joining Wadhams with the egg all over the face look”
Speak for yourself Chilly!
jim, does the ice look in poor shape compared to last year ? yes . is there anything we can do about it right now ? very little. we could do something about people wrecking rain forests that would have an immediate impact. if that cannot be done, there is not a hope in hell of doing things on a grander scale.
May be of interest
Canadian Ice Service Historical Ice Coverage for the week of 0716, Seasons: 1971-2015
[I’ve tidied up the extremely long link! Jim]
thanks for sorting the link jim . while white middle class people moan about carbon dioxide ,this is a good example of what i mentioned above. things we could stop now http://northwestpassage2015.blogspot.co.uk/2015/07/arctic-sea-ice-begins-to-open-early-in.html
This animation may also be of interest?
Chilly – I first wrote about Shell’s “Scramble” scenario back in 2008:
http://econnexus.org/a-very-rough-guide-to-energy-efficiency/
Now our Inglorious Government is flushing energy efficiency and lots of associated investment unceremoniously down the pan:
http://www.V2G.co.uk/2015/07/an-open-letter-to-mel-stride-george-osborne-david-cameron-et-al/
Is that any way to run a pissoir in a brewery, let alone a once great nation?
i have no faith in our government to run anything either morally correct, or fiscally prudent jim. they are managing the race to the bottom at the moment,and it looks like they are winning.
nice animation , got to think the nsr will open up first looking at current conditions. short of some weather shifting lots of ice east ,i cannot see it remain closed for the rest of the melt season.
Very interesting video. Apropos of Wadham’s views, when I watch that vid I cannot believe that I am seeing solid say one metre thick ice coming and going in that manner. Once day a channel or polynya tens to hundreds of kilometres in extent is virtually fee of ice, the next it day is shown as solid as.
That cannot be real ‘ice’ as it cannot be transported fast enough in and out of the area to create change that fast. So it must just be redistribution and inter-freezing of bits of mush and slush – just enough to fool the sensors, but not us censors.
And for wave action, what is that wave that passes east to west north of Baffin Island around the 10th to 14th of June? Again everything that is left behind after that has passed is cracked and splintered – not the solid MYI that is said to be lurking there hanging on for grim life. Is it the result of an upwelling of warm deepwater?
Again what used to be walkable solid ice seems to be more like chips and mush which are stuck together with day old ice like an old house which is standing only because the borer beetles are holding hands. Once decent clap and it all falls down!
As a layman in the art, I can certainly understand and respect Wadham’s anxiety, in spite of his prediction being considered as an outlier by some with perhaps a narrower view of the issues.
Not as familiar with all the details as many here, but I find it hard, with what I do have access to, to see why everyone is so worried that the Arctic is melting. Here’s why.
1. As per the DMI (I trust the Danes, since knowing how much ice is in their backyard is critical to their interests), the last 3 years have seen arctic sea ice surge to the 1979-2000 lower std dev.
2. If this figure is accurate, it looks like the “average” was from data that excludes what appears to be inconveniently low amounts of sea ice prior to 1979, which would mean the levels we’re experiencing now aren’t at all abnormal.
If you have any objections to those points, I would like to know what they are (if you have already addressed them elsewhere, links to that material would be fine). Thanks.
Hi Just,
1. Why don’t you trust the Japanese or the Americans? Here are their latest overall Arctic sea ice extent graphs:
and here’s the latest (December 2015) regional PIOMAS numbers hot off the virtual presses:
As per the NSIDC, Arctic sea ice extent is currently the lowest for the time of year since their records began. As per the University of Washington, Arctic sea ice thickness is evidently declining, not “surging”.
2. See for example: Gross Deception Measuring Arctic Sea Ice Trends
P.S. For some more in depth thoughts see also the Great White Con “New Year 2016 Arctic Meltdown Update“
Why I don’t trust the Americans (or the Aussies or the Americans on S.America). to get the temperatures right.
If they can’t get the temperatures (or the sea levels) right, why should I trust their numbers on Arctic sea ice?
And, actually, I can’t help but suspect Denmark, as well, because of the lock-step mindset of most scientists these days. I don’t see any conspiracy, just mass enforced mediocrity.
NOTE – The Danes’ old method, with coastal areas masked, shows a very dramatic increase of about 0.5 mill SqKm in actual “sea” ice, which is ~5% over all of the measurements of the last decade for this time period. But that disappears when they don’t mask coastal areas, which they probably due to make their data conform to a universal standard. – Pay no attention to that anomaly behind the curtain.
Sorry, but I’m not buying the AGW con, and I have on what to rely.
Hello again Just,
I note that you have not answered my question about Japanese numbers. Here once again are JAXA’s extent:
and JMA’s surface temperature.
You also appear to be unaware that not so very long ago I also posted a picture of the (deprecated!) DMI extent you refer to on this very site.
Just in case you’re unaware of it I guess I should point out at this juncture that you do a very good impression of a drive by poster of links to “skeptical” authors who has never bothered to read any of the vast amounts of information available on this site.
Sorry, but I’m not buying your unsubstantiated BS!