In some recent shock news over at the “Real Science” blog “Steven Goddard” asked “Who is Steven Goddard” and then answered himself as follows:
My name is Tony Heller. I am a whistle blower. I am an independent thinker who is considered a heretic by the orthodoxy on both sides of the climate debate.
I’m highly unorthodox, so I’ll consider him as a schizoidal cherry picking pseudo-skeptic instead. Steve/Tony finishes his “coming out” article as follows:
I am more than happy to debate anyone who feels up to the challenge, including the President of The United States. Science works through research and debate – not censorship, propaganda, faith, or intimidation.
Steve/Tony has been blogging about Arctic sea ice again recently. His most recent post is entitled “Does The Arctic Need To Be Prosecuted?“, but it seems he’s unwilling to engage in debate about that topic with me.
Them:
Some climate experts want to make skepticism of junk science a felony, and every day it becomes more clear that the Arctic has no respect for climate models or eminent government scientists. This is shocking, and it is time for the Arctic to be prosecuted. The Arctic is aiding and abetting climate deniers, as well as making obscene gestures towards the world’s leading academics.
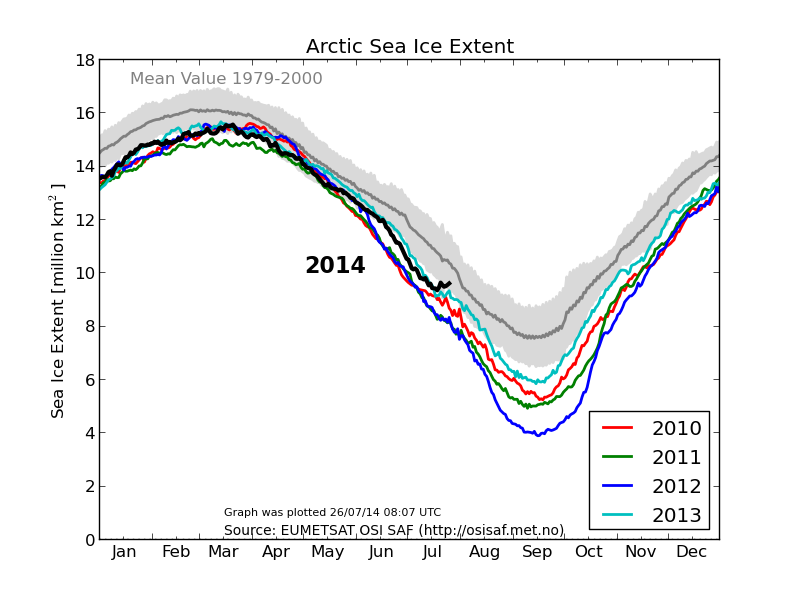
DMI “new” Arctic sea ice extent graph on July 26th 2014
Us:
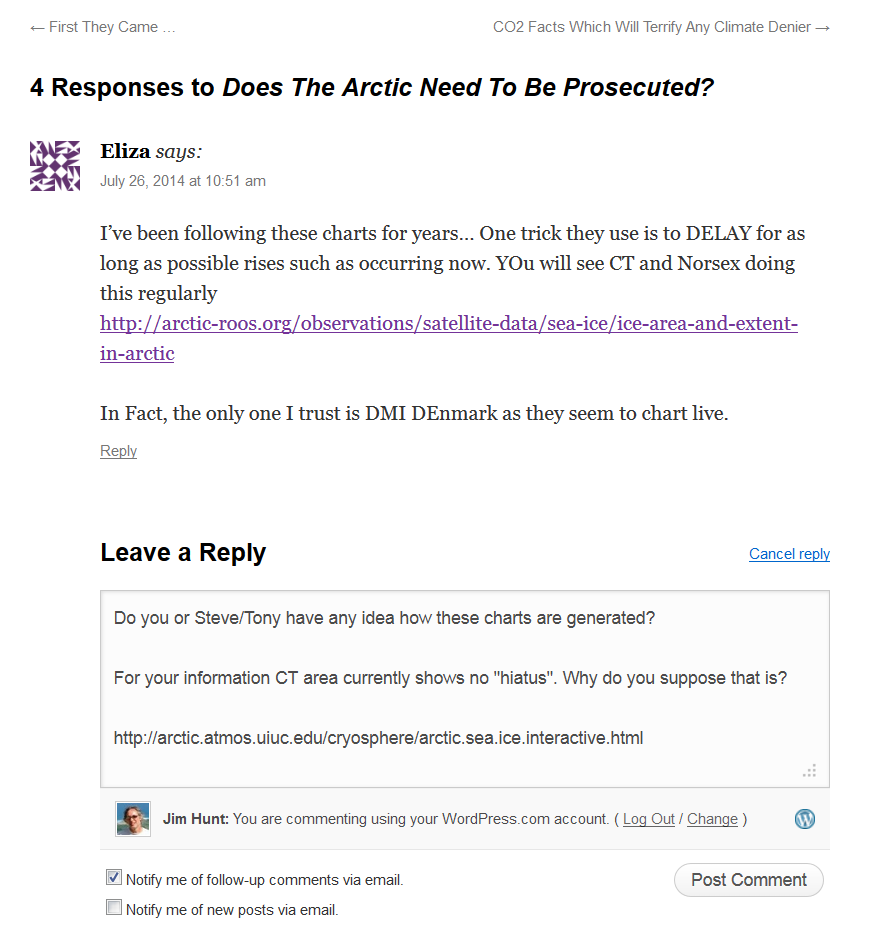
Needless to say Steve/Tony has yet to approve my comment on his ruminations, which reads as follows:
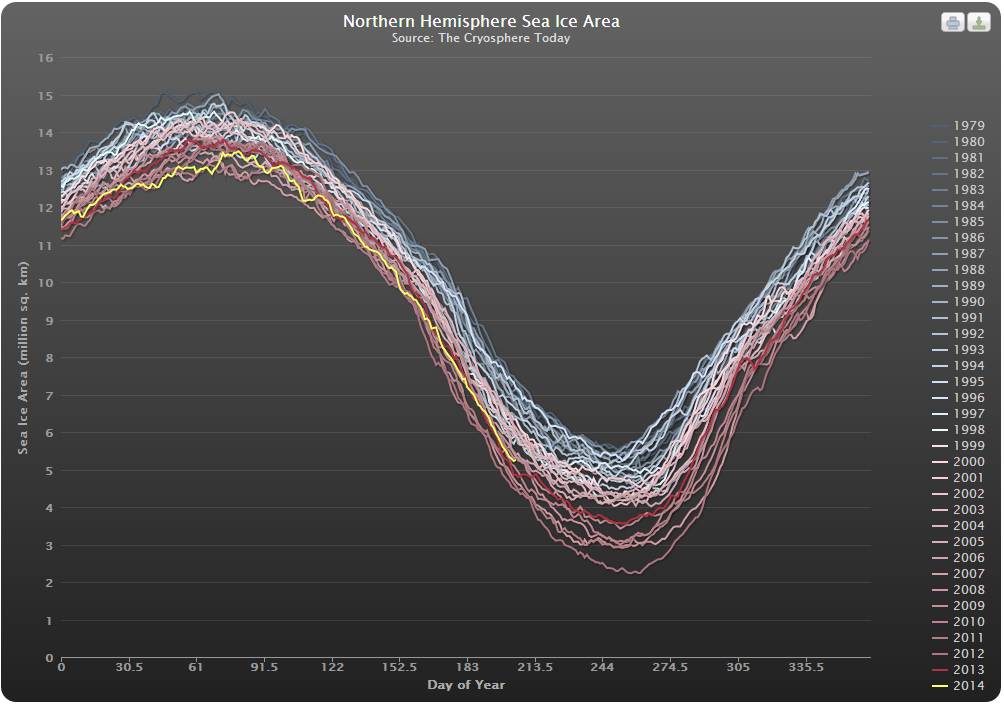
 This is what the Cryosphere Today graph of Arctic sea ice area I linked to looks like at the moment:
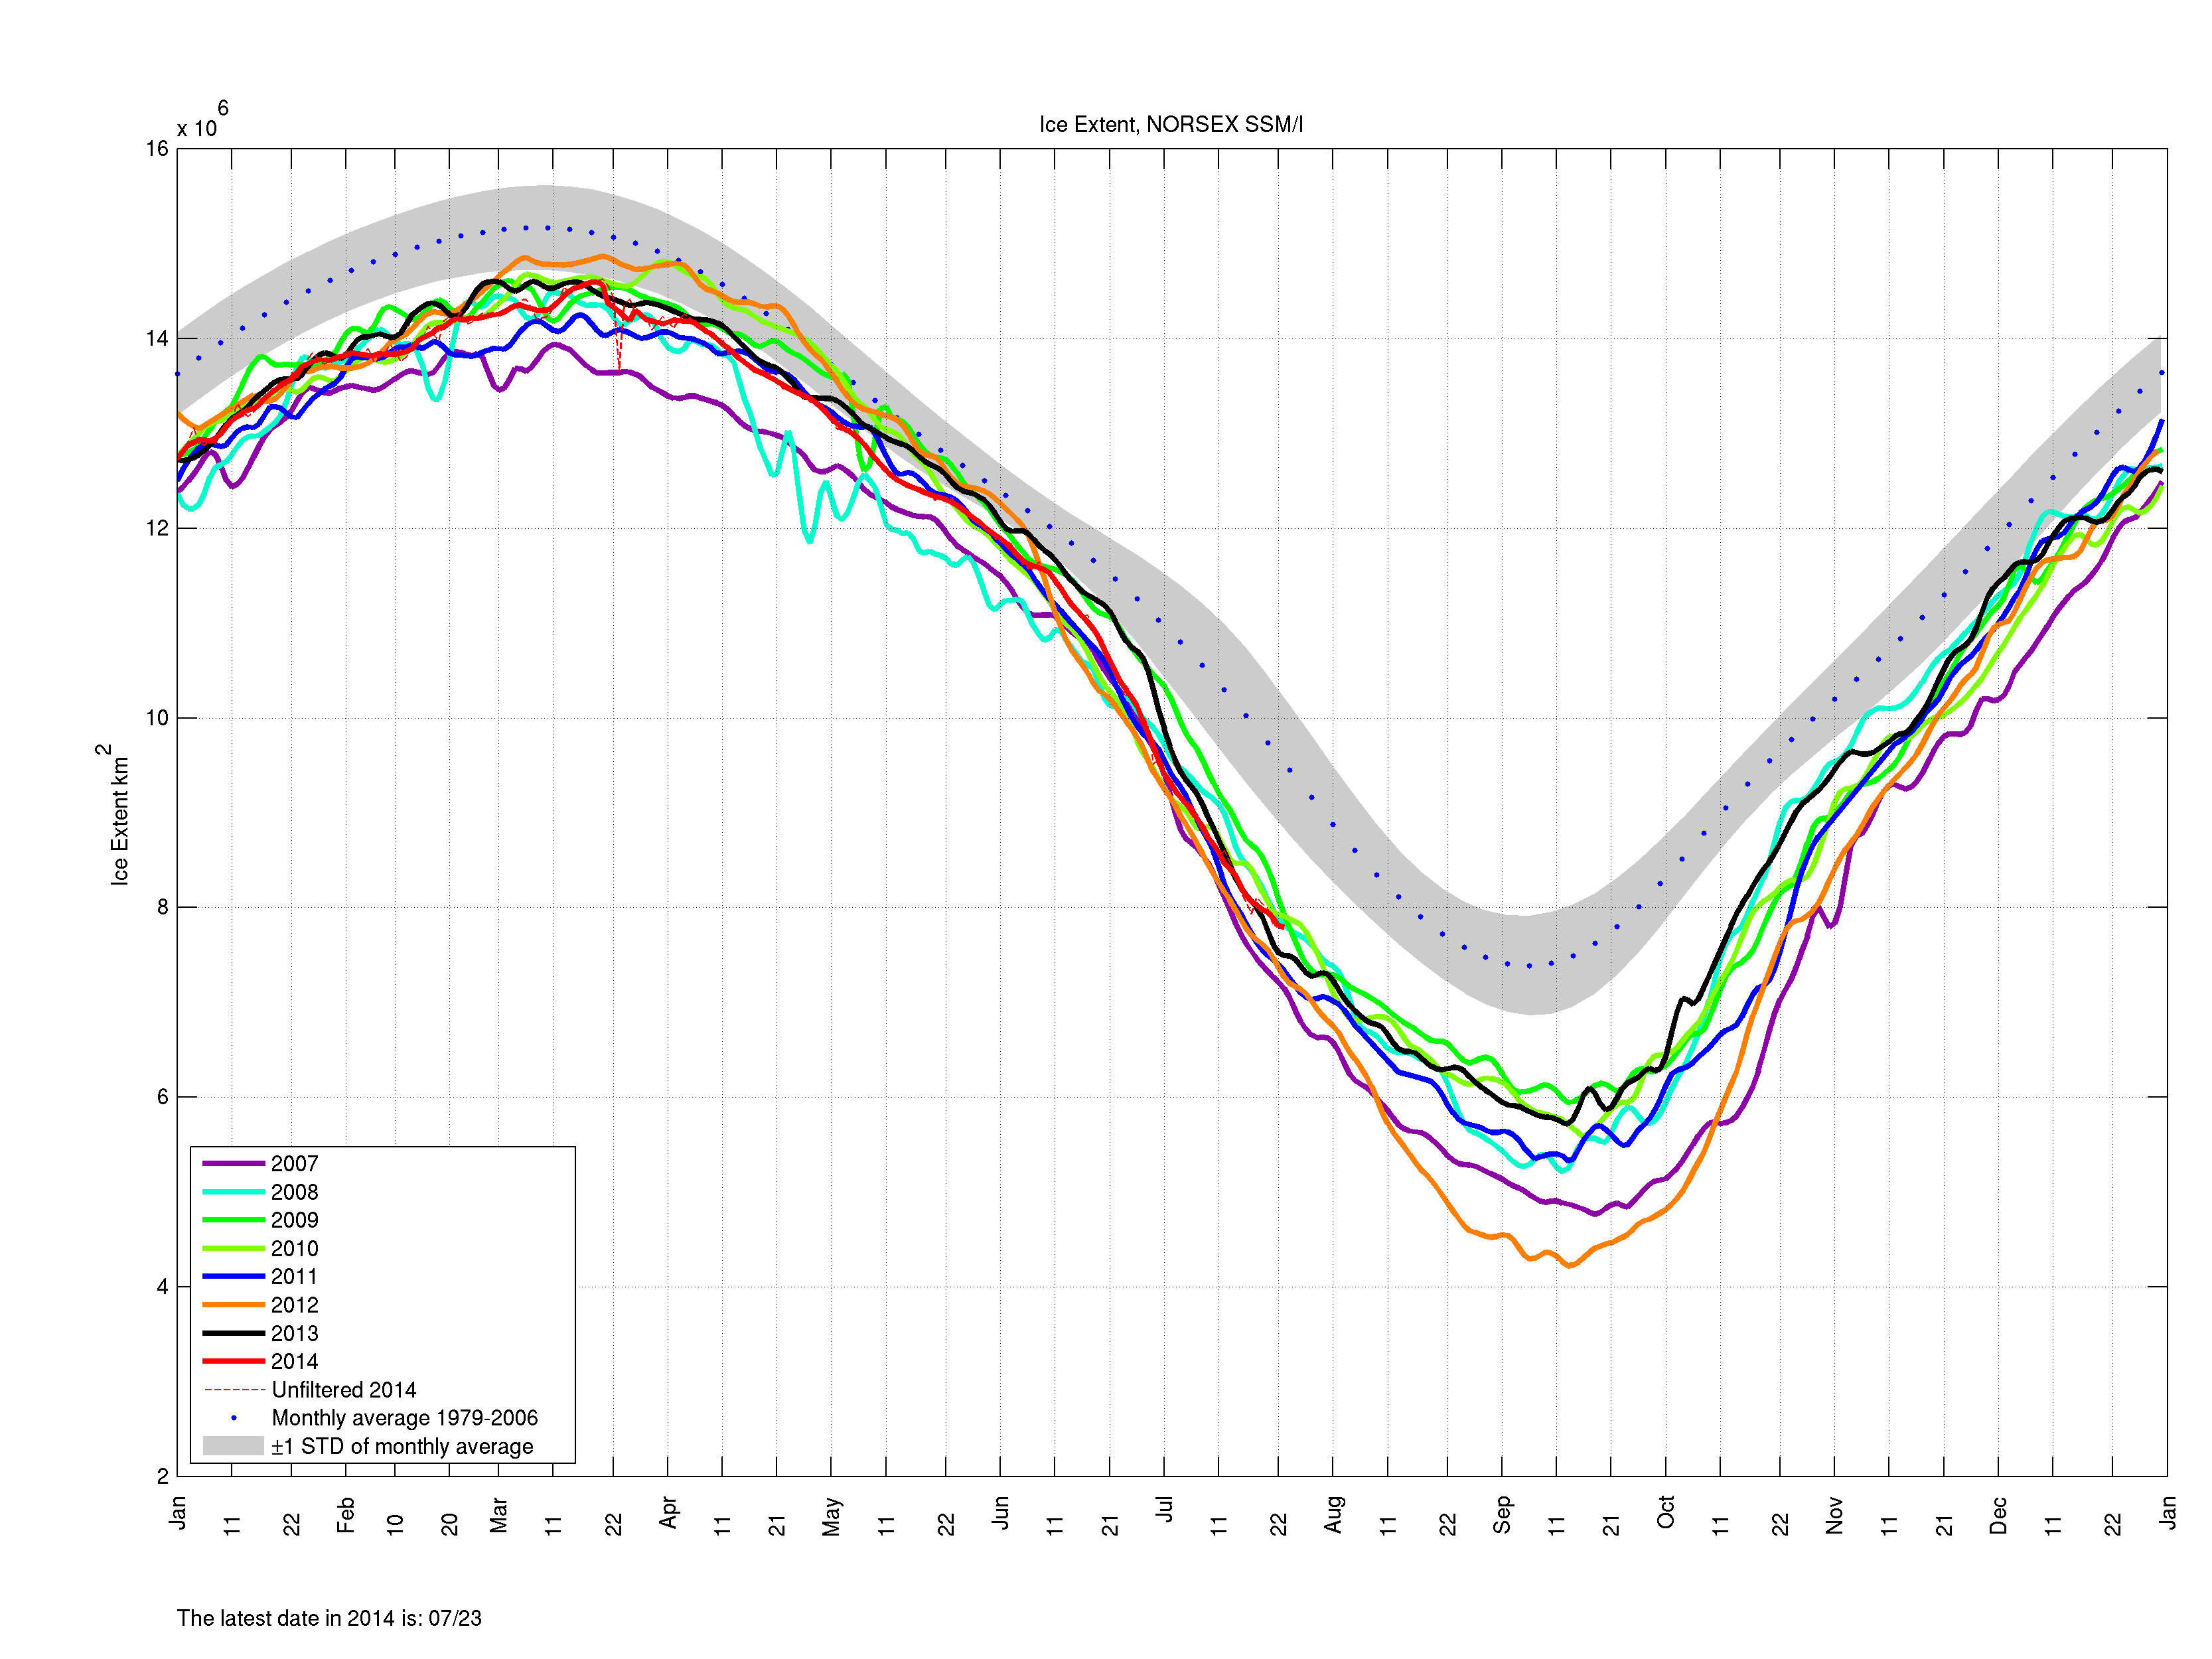
This is what the NORSEX extent chart that Eliza linked to looks like this morning:
Here’s another one for good measure, this time showing NSIDC Arctic sea ice extent:

As far as I am aware there is no law against being a schizoidal cherry picking pseudo-skeptic in the United States of America, or anywhere else for that matter. Please feel free to comment below if you know otherwise and/or think that there should be!
Them:
After a protracted exchange on Twitter a copy of my comment eventually saw the light of day:
@jim_hunt It was in the spam folder.
— Steve Goddard (@SteveSGoddard) July 26, 2014
Us:
We’ll keep you posted!
You’ll be happy to know I have begun blowing the whistle on myself: http://tonyhellerakastevengoddardisnotasociopath.wordpress.com/
Tales of rising sea levels from melting sea ice are bizarre. The sea freezes, expands about 10% ,which floats on top. Melts and returns to original level. You cannot increase volume by freezing and melting. Only melting LAND ice can raise sea levels but as only 3% of the world is land ice at between minus 26 to 80 degrees, the temperature rise to melt it would kill us all off anyway. Why does the C/AGW cut need so much lies. False CO 2 claims from water cooling towers. Threats to non believers. Why would you be surprised at a temperature rise after leaving a cold period. Climate Change /Global Warming Mark one followed leaving the Little Ice Age. Current one leaving the cold 1940/50’s. With 78 climate changes in the last 4,500 years, are the polticians going to tell it to STOP !! Not with solar & wind. Coal still King.
Hi Derek,
Who’s been telling you bizarre “tales of rising sea levels from melting sea ice”? You certainly won’t have found any such nonsense here on GWC!
As you rightly point out, LAND ice is a different matter. The current extremely fast rise in temperature (on geological timeframes), particularly in the Arctic, is not “a surprise”. It’s predicted by the laws of physics. See our Greenhouse Effect FAQ for further details:
https://greatWhiteCon.info/resources/greenhouse-effect-explanations/
“Only 3% of the world is land ice”. Not entirely sure where you got that figure, but for the sake of argument let’s roll with it. The earth’s surface area is approximately 200,000,000 km^2, including both land and ocean. If 3% of that existed as land ice, that means that land ice takes up approximately 6,000,000 km^2. Not exactly a meager amount.
Though, at this point, I feel it necessary to point out that your figure is off, as upwards of 15,000,000 km^2 of earth’s land is covered in glacial ice. These sheets reside primarily in Antarctica, Greenland, and portions of the northern ice cap, and can be upwards of a mile thick. I could calculate out what kind of water volume we’re dealing with, but needless to say it’s gigantic.
Secondly, your figure of -26 to -80 degrees for all land ice on earth is immensely misleading. Yes, inland Antarctica regularly experiences temperatures like this, but you’re forgetting that the temperatures on the coast are higher. Temperatures there generally reside around -10 degrees C, but have been known to shift upwards as high as 20 C, and it’s not all that unusual for temperatures to climb above freezing on the coastal regions. As for Greenland, temperatures regularly rise above freezing in the summer months, providing ample opportunity for melting to occur.
It doesn’t take some bombastic shift in temperature to melt glacial ice. Natural temperature shifts often bring the temperature in these zones to just under or just above freezing. An increase of only a few degrees would certainly be enough to increase melting drastically, and contribute to rising ocean levels. This isn’t some all or nothing sort of deal, where either all the ice stays locked up or all the ice melts. Glacial melting is natural, and has occurred throughout earth’s history. What we humans are doing is shifting the balance of this process, increasing melting rates and decreasing refreezing rates. This results in a net increase of fresh water influx to the ocean, contributing to – yes – rising sea levels.
Ethan,
You need to check your numbers – you’re getting sq kms mixed up with sq miles. The surface area (land + ocean) of the planet is ~ 510 million sq kms.
It takes quite a lot of energy to melt ice, as anyone with a cursory knowledge of high school physics will tell you. On a practical level major increases in temperature would be needed to melt the ice sheets, a 5 celcius increase will have no impact on Antarctica when the ice sheet doesn’t warm above -20.
A cursory glance at Wikipedia reveals “quite a lot of energy” to be 333.55 J/g (or kJ/kg if you prefer).
Meanwhile on Greenland the surface of the ice sheet is melting:
The Southern Hemisphere is aka as ‘the water hemisphere’. Mostly because of this reason the impact of a warming planet is seen in the Northern Hemisphere first but changes are still being observed over 30 year trends in the Southern Hemisphere…..!
Antarctica is known as the big ice-block for a reason. Because it is an island at the bottom of the Southern Hemisphere ocean currents and wind currents can completely encircle it forever…. this makes it an obviously completely different environment to the Arctic as heat cannot penetrate as easily as it can in the Arctic.
But we all know your global business interests know these facts intimately….
Unfortunately this is just another website perpetrated by Ignorant GITS suffering from the Arrogance of Ignorance, who look at incidents in Isolation, in a single plane, showing a Low Cognitive Ability and an inability to Reason Rationally or apply Critical Thinking. Rational argument has no meaning for people like this, and is futile. Heaven forbid that anyone should mention to them that the influences on Climate are 4 dimensional and highly complex when they are unable to see that, despite melting Ice at the Artic, there is a massive Ice Sheet build up in the Antarctic, which means that they have difficulty coping in two dimensions.
Hi KC,
There’s no need to repeat yourself. Console yourself with the thought that the moderation team here at Great White Con Ivory Towers respond much more swiftly than our counterparts over at WUWT!
Now, what evidence do you have for the alleged “massive Ice Sheet build up in the Antarctic”? The last time I checked both the ice sheet and the sea ice surrounding the continent were shrinking.
Why do the charts only go back to 1979? Surely there is more data recorded? If there was data sets reaching back Afew more decades we would have a better understanding of whether these are natural cyclical changes or not. My assumption is that they are purposely lacking probably for this reason.
The “charts only go back to 1979” because that’s when a “scanning multichannel microwave radiometer” (SMMR for short) first entered Earth orbit:
https://en.wikipedia.org/wiki/Scanning_multichannel_microwave_radiometer
For a “data set reaching back a few more decades” see for example:
https://nsidc.org/cryosphere/sotc/sea_ice.html