Particularly in view of all the balderdash concerning “climate science” being spouted in Washington DC on Wednesday lets first of all run through some Arctic sea ice facts from April 1st 2017 or thereabouts:
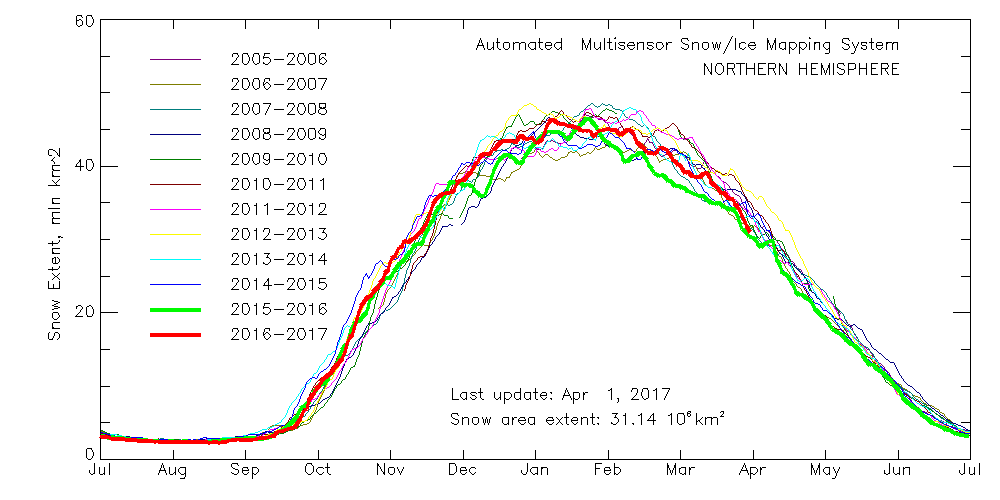
Northern Hemisphere Snow Extent:
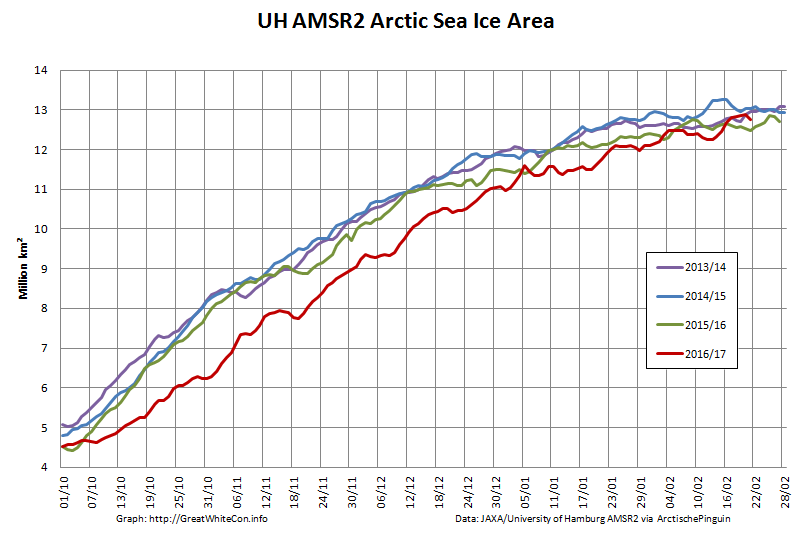
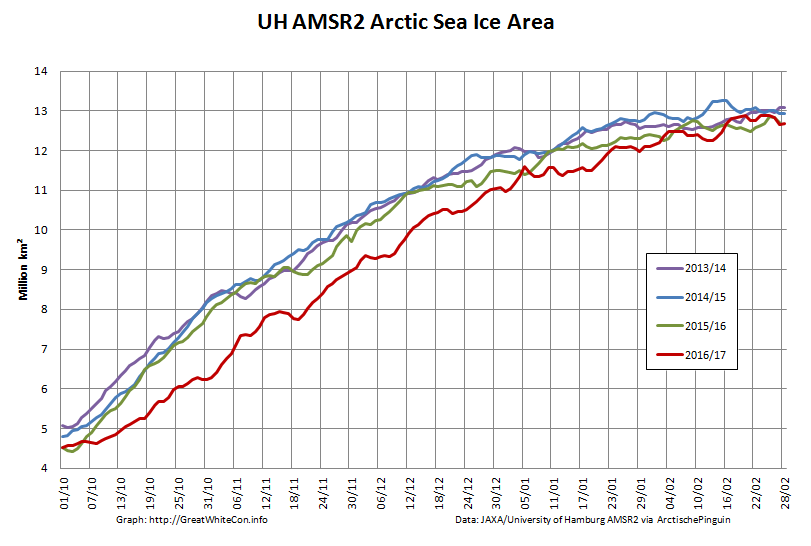
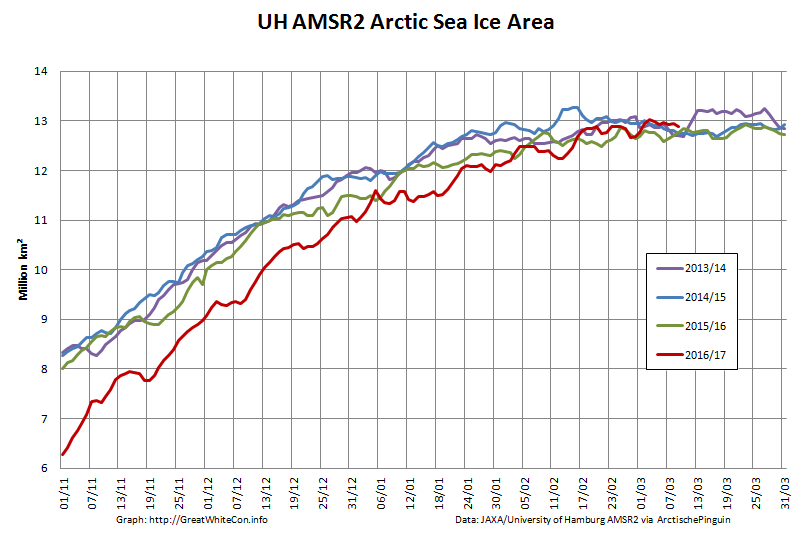
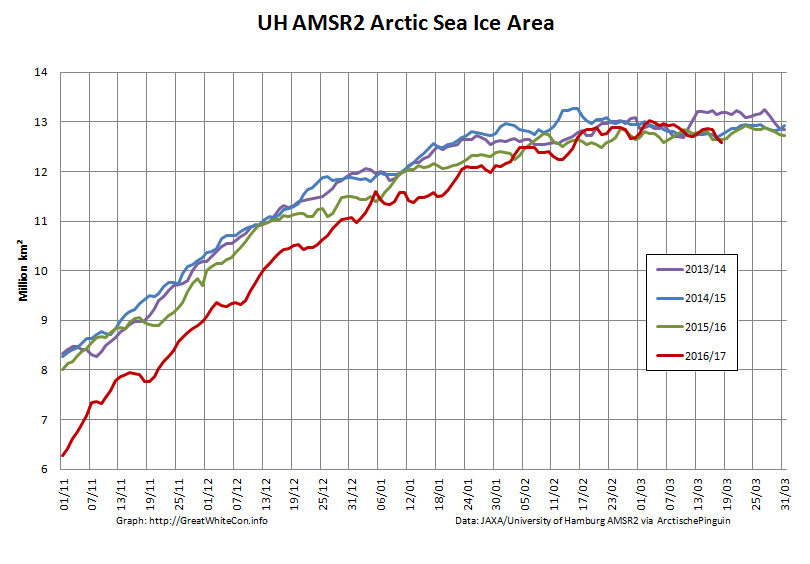
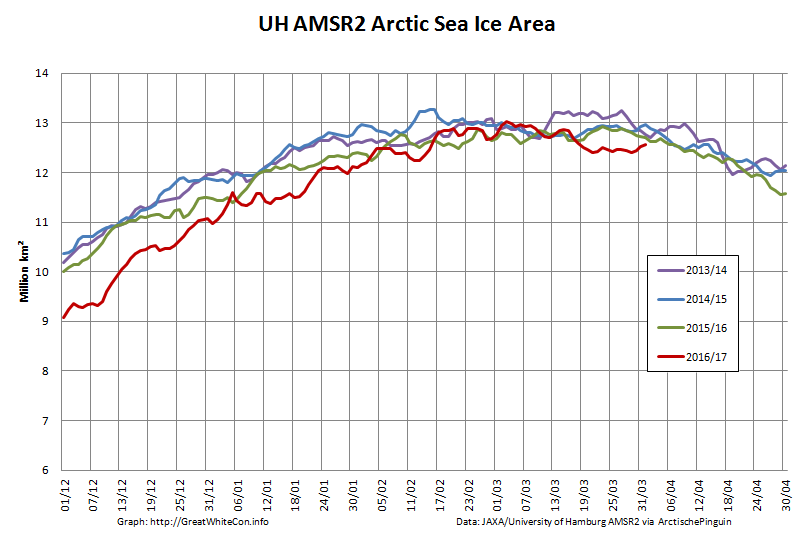
Arctic Sea Ice Area:
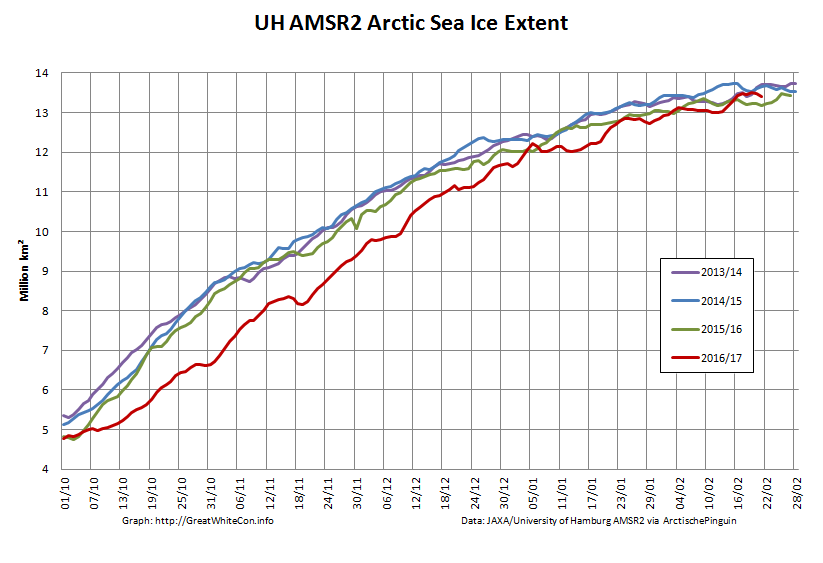
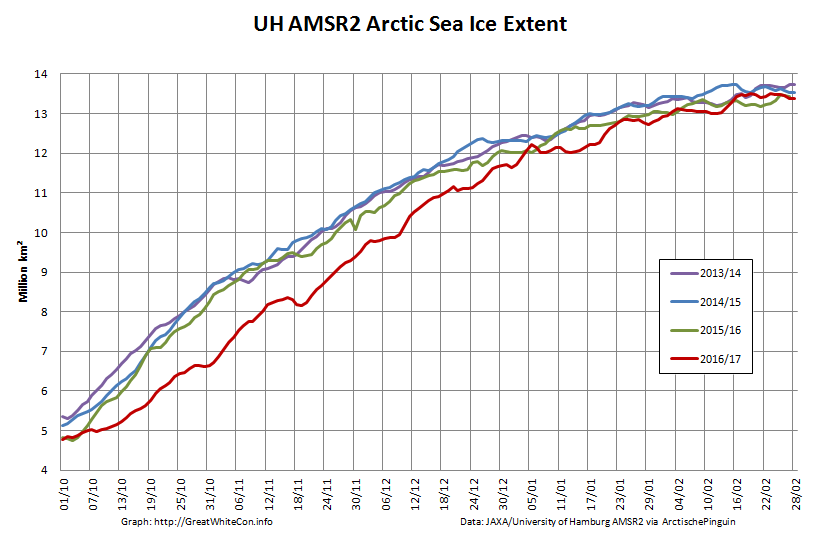
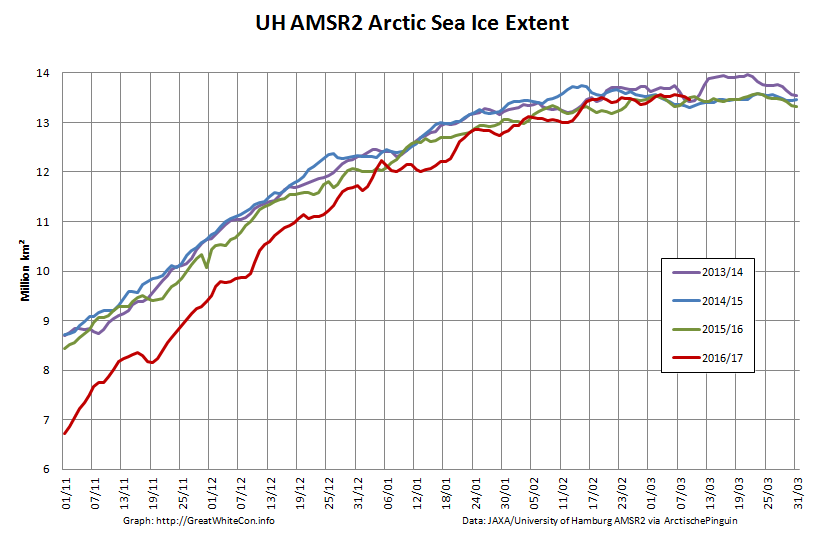
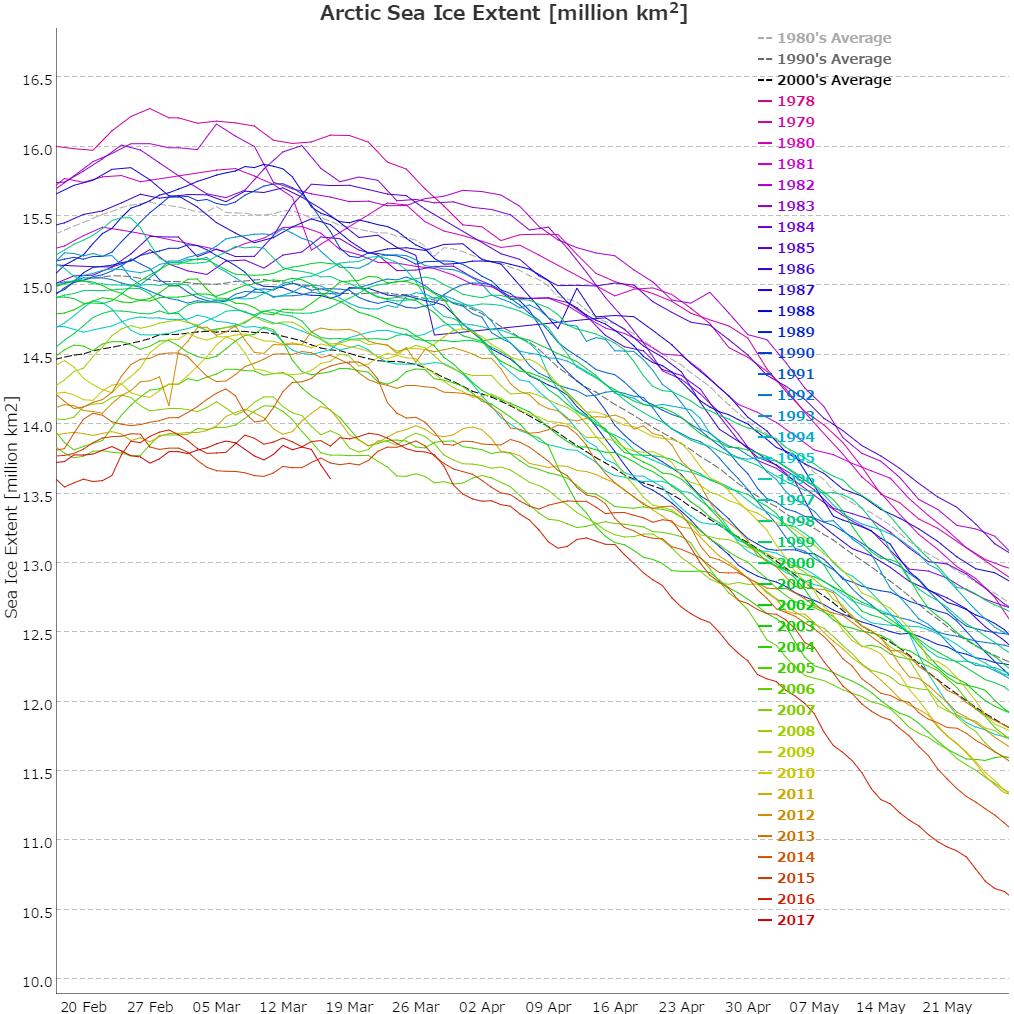
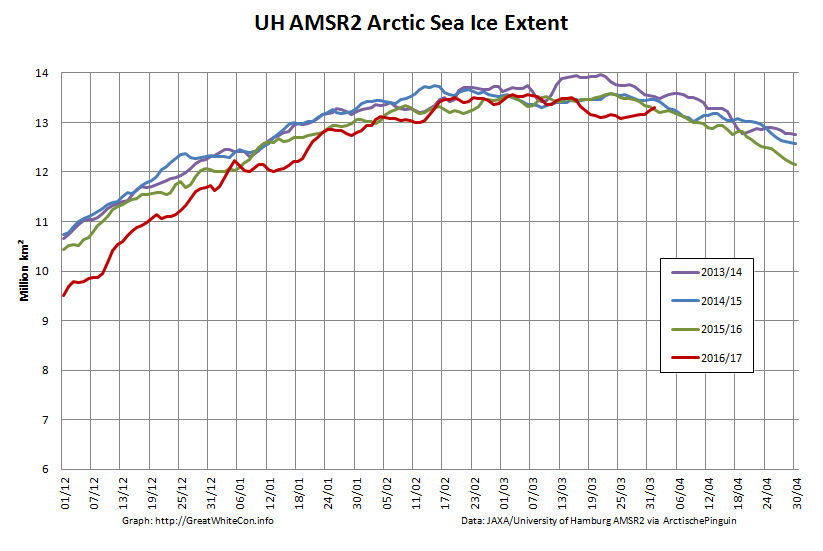
Arctic Sea Ice Extent:
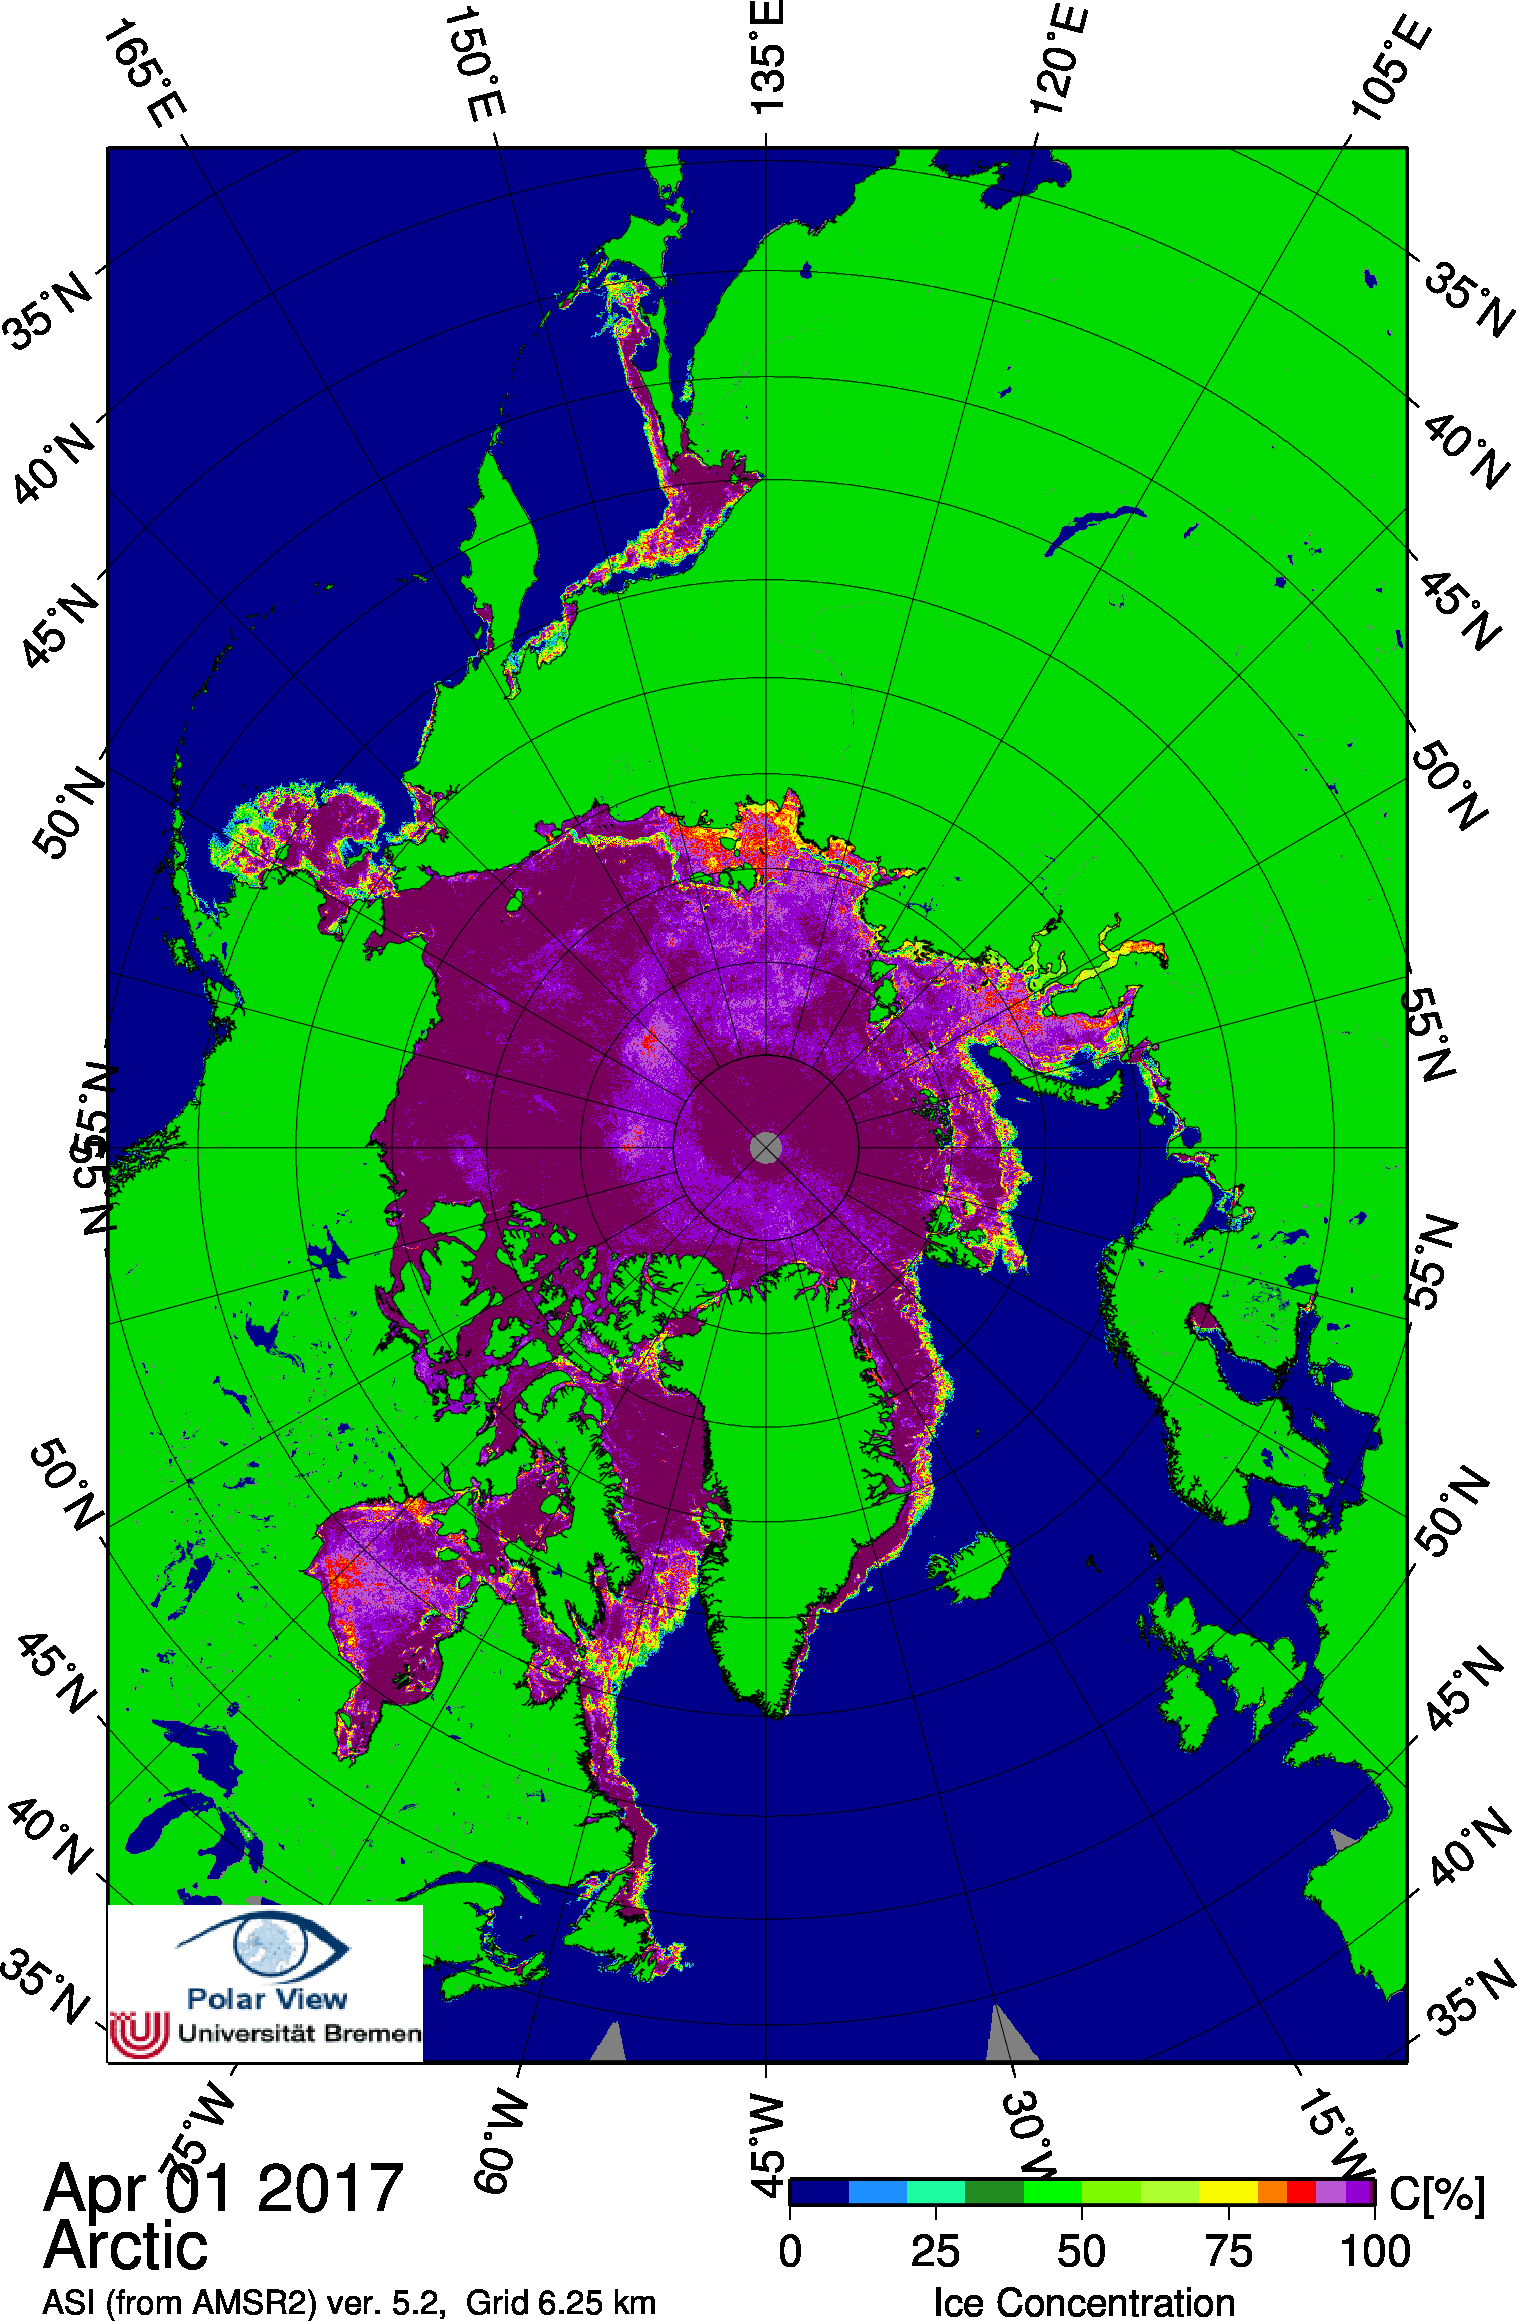
Arctic Sea Ice Concentration:
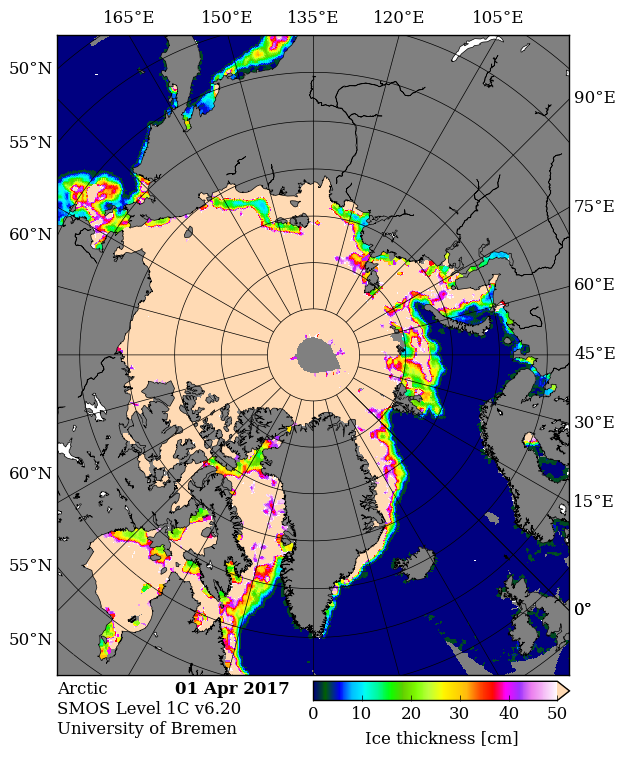
Thin ice map from the University of Bremen SMOS:
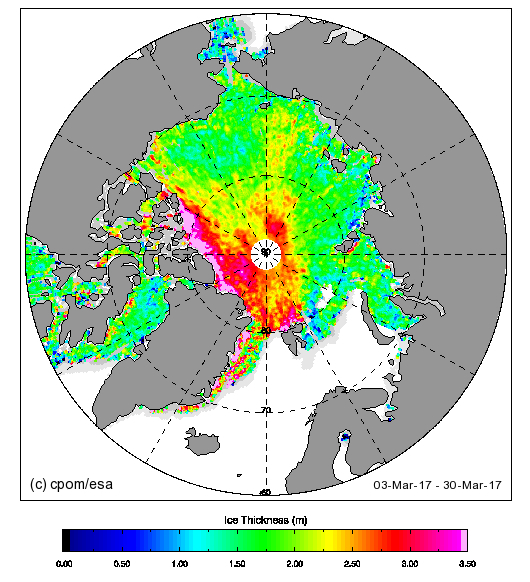
Thick ice map from CPOM CryoSat-2
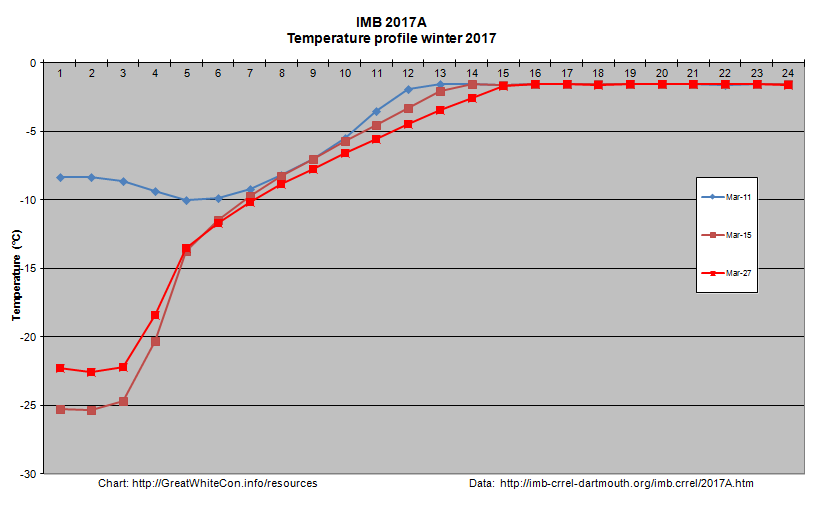
Beaufort Sea ice thickness growth graph:
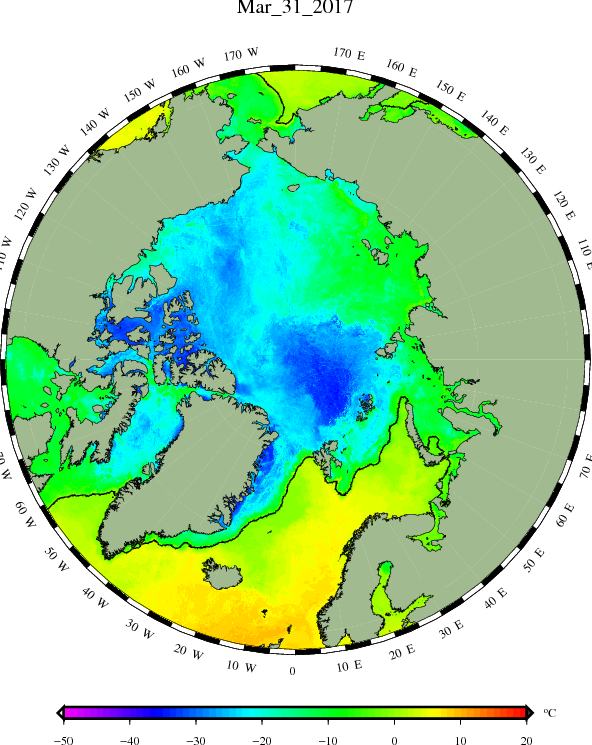
DMI sea ice temperature map:
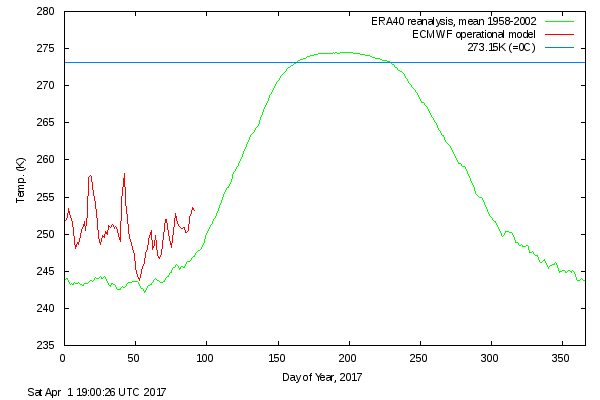
DMI atmospheric temperature graph:
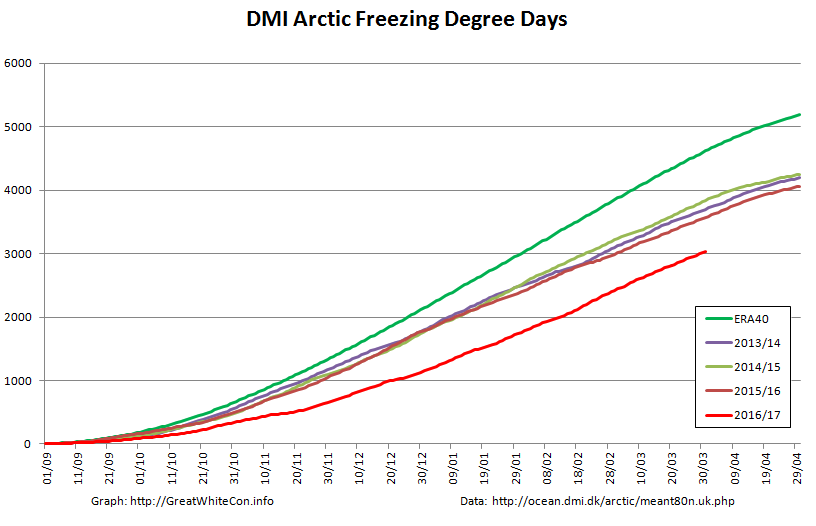
DMI Arctic Freezing Degree Days:
PIOMAS volume for March will follow in a few days, but it’s extremely unlikely to be anything other than “lowest for the date”.
What preliminary conclusions can we draw from this plethora of pretty pictures? First of all the Arctic hasn’t suddenly gone into “deep freeze” mode. Temperatures above 80 degrees north are rising again and are well above the climatology. Freezing degree days are still the lowest on record by a wide margin. Northern hemisphere snow cover is falling fast and is currently just above last year.
In contrast to last year, and thanks to lots of cyclones and very little in the way of anticyclones, there’s plenty of sub half meter sea ice in the Laptev and East Siberian Seas and hardly any in the Beaufort Sea. There’s also plenty of thin ice to be seen on both the Atlantic and Pacific peripheries.
The usual southerly arch hasn’t formed in the Nares Strait between Greenland and Ellesmere Island, and as SMOS shows the sea ice in the strait is consequently very thin. That leads one to wonder when the northern arch in the Lincoln Sea might give way.
It’s not immediately apparent from the still images above, but there’s been relatively large amounts of “old ice” exported from the Central Arctic on the Atlantic side, hence the recent increase in overall extent which is now second lowest for the date (since satellite records began). Area has been creeping up as well over recent days, but is still lowest for the date, as it has been for most of the last year. Sea ice “compactness” has decreased somewhat and given all the thin ice around the edges extent will soon start dropping once again.
All in all, the Arctic sea ice prognosis is not good. Are you watching Lamar Smith? (Pun intended!)
The March PIOMAS update is out! As suspected, Arctic sea ice volume is still by far the lowest on record:
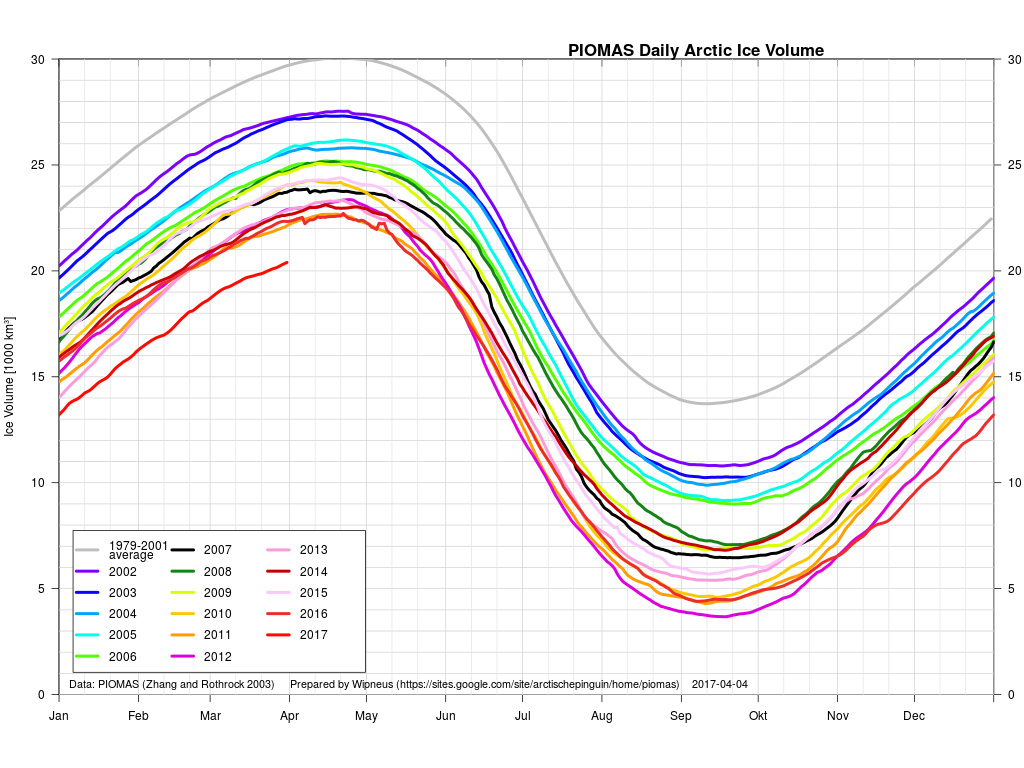
Volume on March 31st 2017 was 20.398 thousand cubic kilometers. The previous lowest volume for the date was 22.129 thousand km³ in 2011.
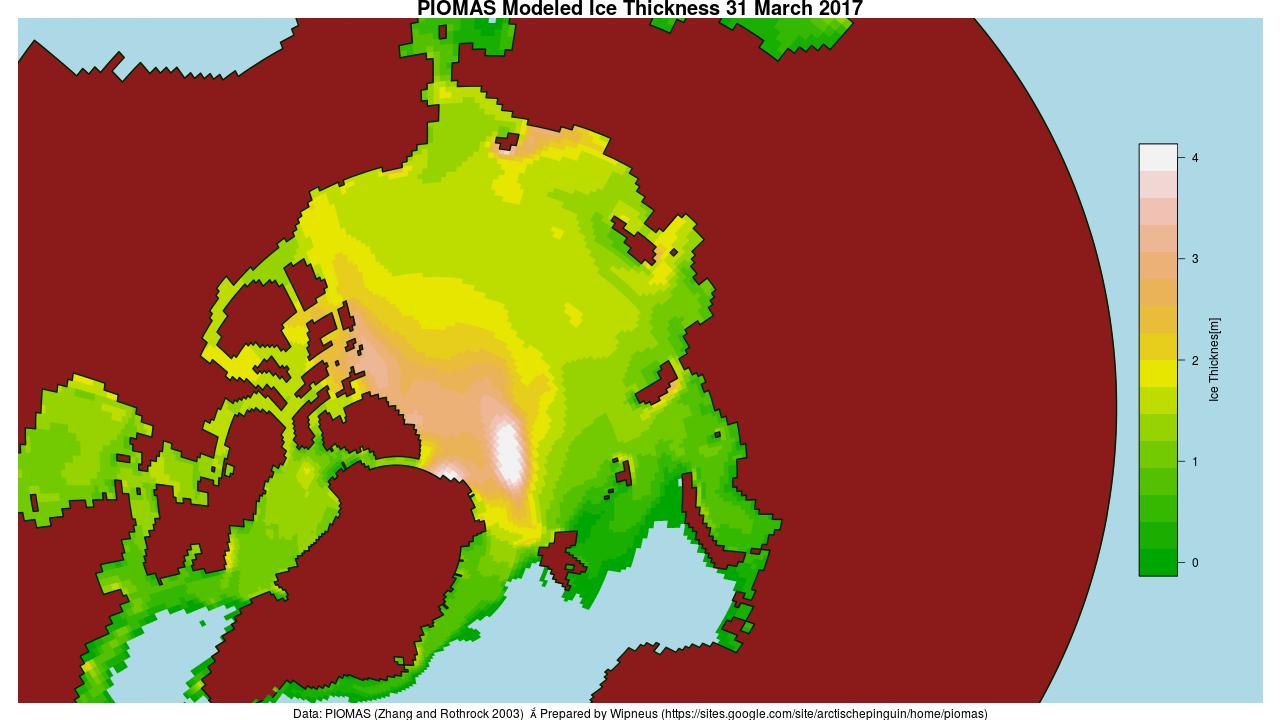
Here too is the PIOMAS modelled Arctic sea ice thickness map:
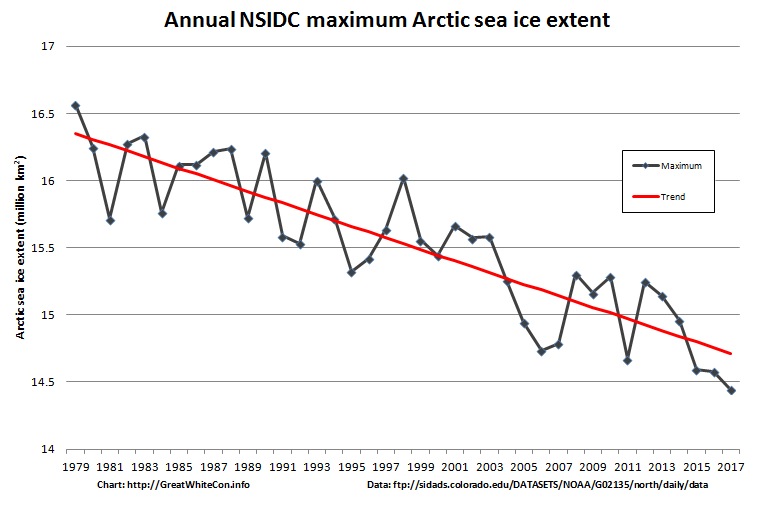
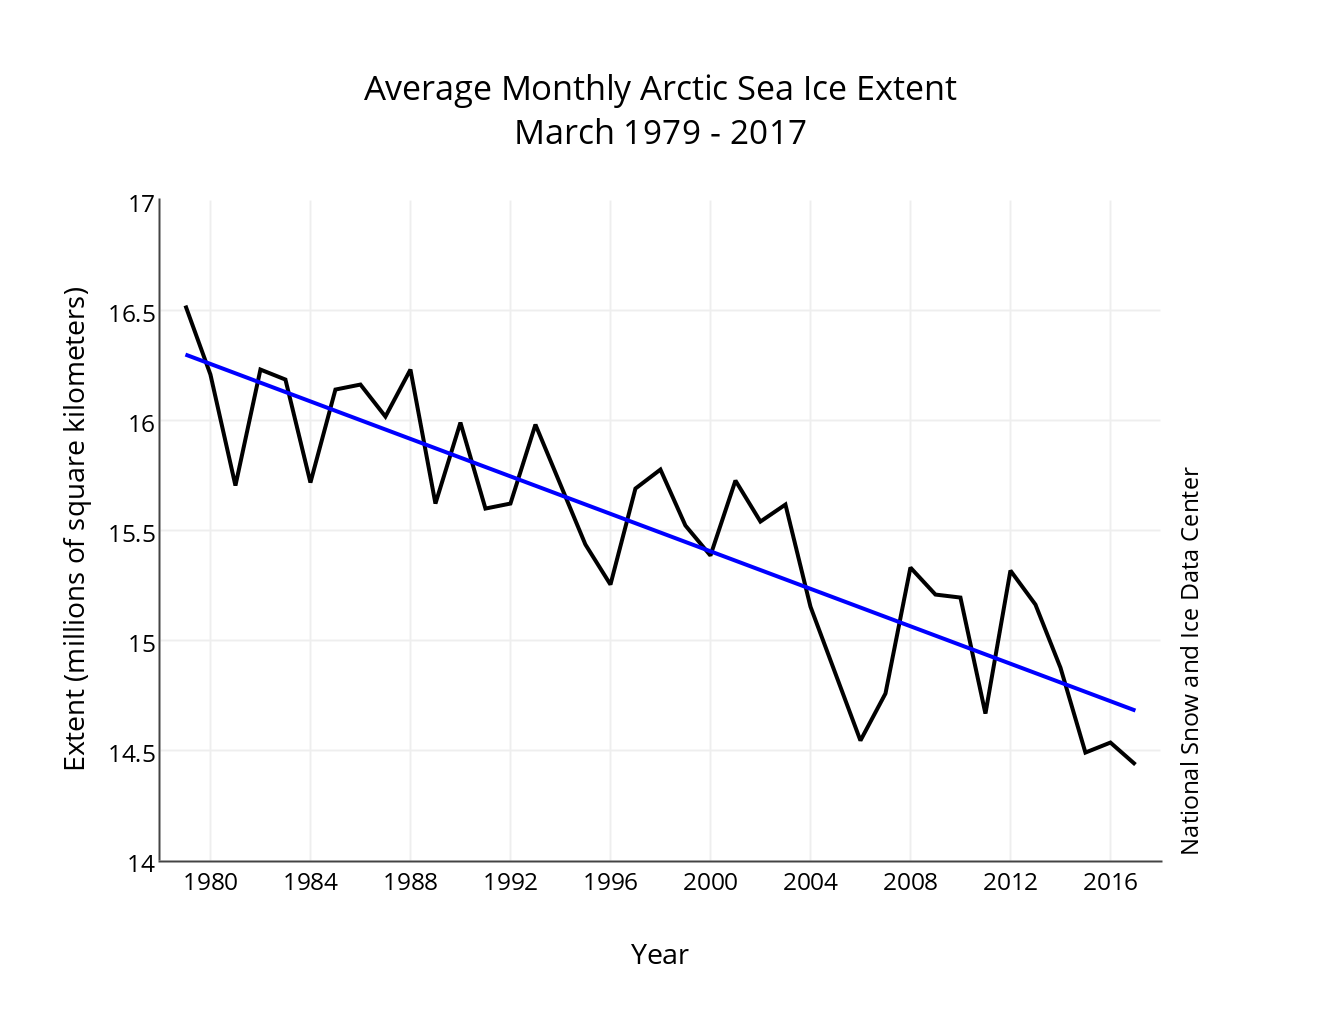
The latest edition of the NSIDC’s Arctic Sea Ice News confirms that their monthly extent metric for March 2017 was the lowest in the satellite record for the month:
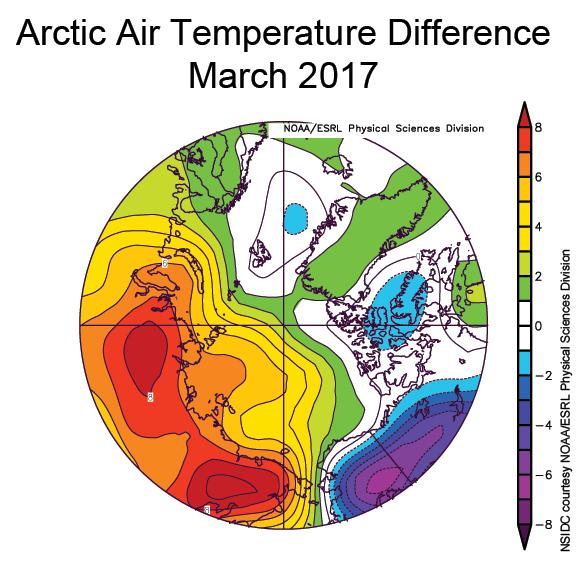
As well as highlighting the anomalously warm temperatures across much of the Arctic:
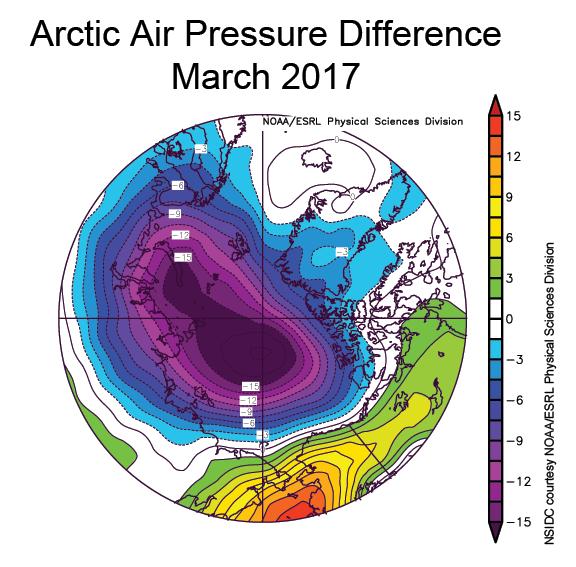
the NSIDC article includes this telling pressure anomaly map:
There’s also mention of a new paper:
New work by an international team led by Igor Polyakov of the University of Alaska Fairbanks provides strong evidence that Atlantic layer heat is now playing a prominent role in reducing winter ice formation in the Eurasian Basin, which is manifested as more summer ice loss. According to their analysis, the ice loss due to the influence of Atlantic layer heat is comparable in magnitude to the top down forcing by the atmosphere.