R/V Lance serendipitously encountered an energetic wave event around 77°N, 26°E on 2 May 2010. Onboard GPS records, interpreted as the surface wave signal, show the largest waves recorded in the Arctic region with ice cover. Comparing the measurements with a spectral wave model indicated three phases of interaction:
wave blocking by ice
strong attenuation of wave energy and fracturing of ice by wave forcing, and
uninhibited propagation of the peak waves and an extension of allowed waves to higher frequencies (above the peak)
Wave properties during fracturing of ice cover indicated increased groupiness. Wave-ice interaction presented binary behavior: there was zero transmission in unbroken ice and total transmission in fractured ice. The fractured ice front traveled at some fraction of the wave group speed. Findings do not motivate new dissipation schemes for wave models, though they do indicate the need for two-way, wave-ice coupling.
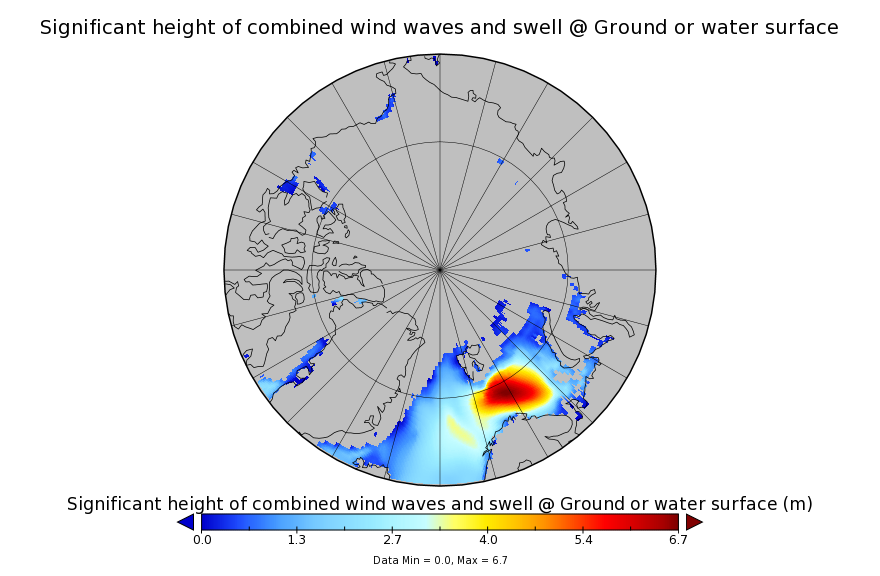
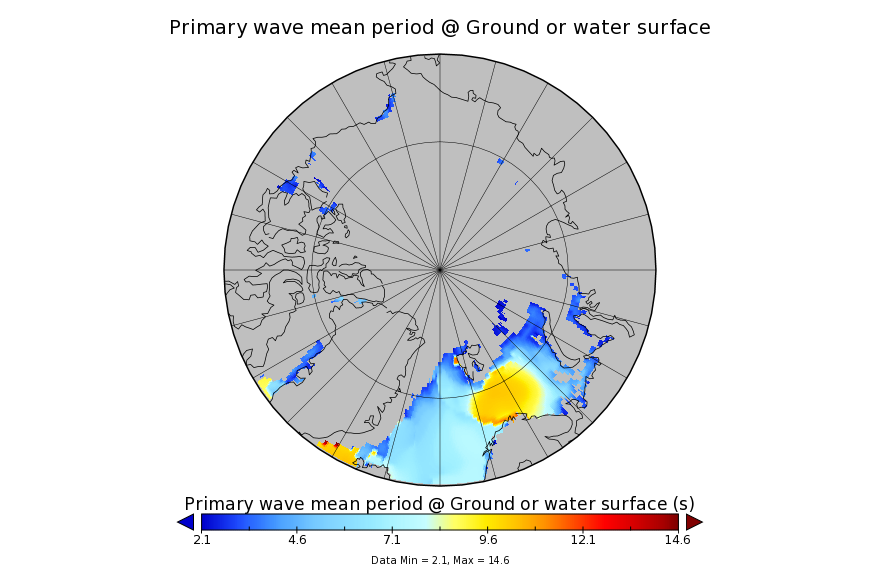
There’s a lot of equations and similarly technical stuff in the body of the paper which is nevertheless well worth a read even if you’re not a techie, as are the articles in the long list of references at the end. However, there aren’t any “swell forecasts” of the sort we like to put in our discussions of “waves-in-ice“, so firstly let’s fix that. Here’s some visualisations from NOAA’s WaveWatch III reanalysis for 18:00 on May 2nd 2010:
which reveal a swell with a significant height of 6 meters and a period of 11 seconds in the open ocean south of Hopen Island and Svalbard. Collins et al. concluded that:
Our results suggest that accurate wave prediction would have required coupling with an ice model which resolved scales of hours and kilometers. Implementation at such scales will no doubt be a future challenge. These are the largest known waves recorded in the Arctic with substantial ice cover present, and we expect the measurement of large-wave events to occur more frequently in the future due to the fetch wave-ice fetch feedback loop.
Now comes news that the R/V Lance has been subject to another “waves-in-ice” event, although this time it was north of Svalbard. First of all here’s a video showing an earlier stage of the Lance’s 2015 Arctic program:
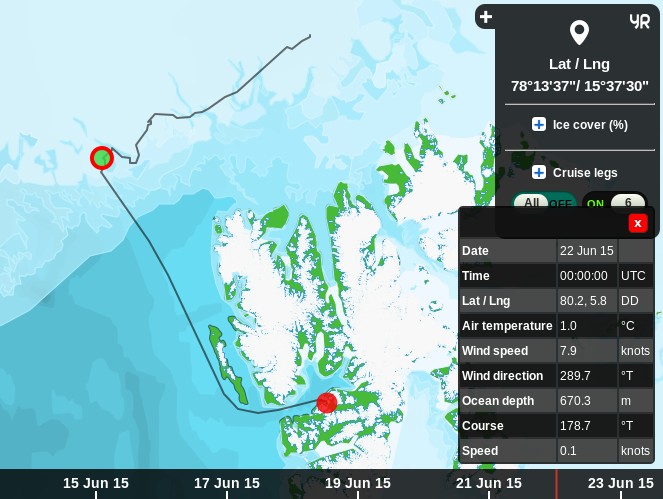
Next the latest serendipitous encounter for the Lance. According to the Twitter feed of the Oceanography & Sea Ice department of the Norwegian Polar Institute on June 22nd 2015:
The sea ice floe with the N-ICE2015 research camp broke
Now some further information (and more pictures!) has emerged via the Twitter feed of Harvey Goodwin, who says that:
When a light swell comes in the 5km sea ice floe we’d been working on broke into pieces not more than 30m [across] in an hour:
Equipment rescue[d] after sea ice breakup. Some cables cut but no equipment lost!
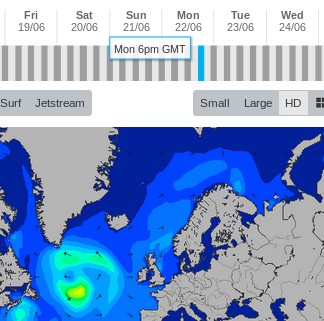
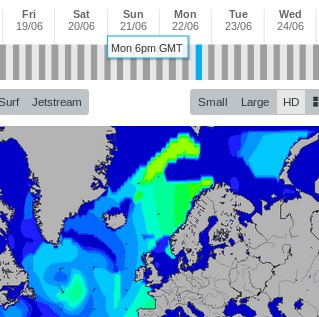
The WaveWatch III reanalysis for June 2015 isn’t available yet. We’ll bring you that information once it is, but for now here’s a couple of quick snapshots from the Magic Seaweed surf forecasting site:
They suggest that a smaller but longer period swell was responsible for the ice break up this time around, compared to 2010. I wonder if it will take another 5 years for this latest event to be more fully documented in the scientific literature?
“Steven Goddard” is evidently magically turning into “Snow White’s” muse. His latest fairy tale addresses her second favourite subject after Arctic sea ice, which is of course northern hemisphere snow cover. The article is entitled “October-March Snow Cover At Record High Levels“, and proudly proclaims that:
Fifteen years ago, climate experts said that snow is a thing of the past. Since then, Northern Hemisphere snow cover has soared to record levels.
What this tells us is that cold air is intruding further south during the snow season. It also tells us that Tom Karl at NOAA is lying about global temperatures.
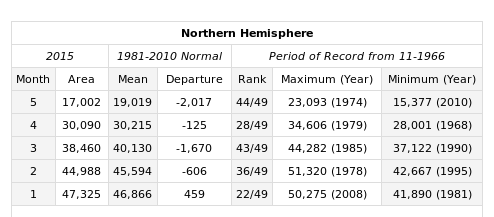
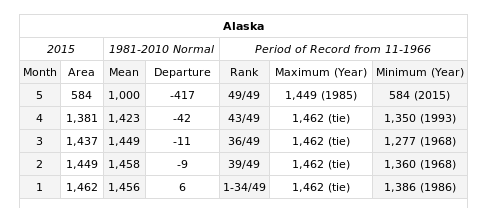
Snow White and I innocently followed Steve’s link, then clicked on the “Rankings” link on the left hand side, where we discovered this:
not to mention this:
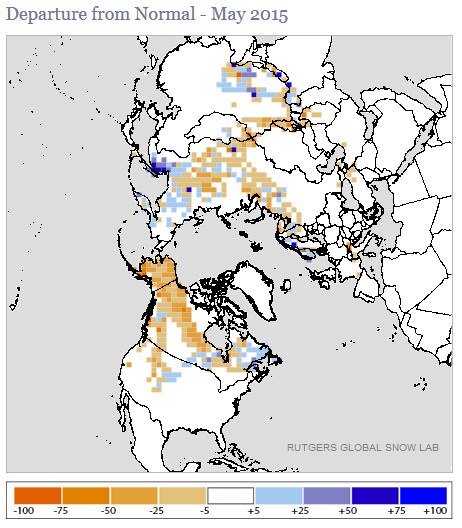
Feeling confident that all the Real Scientists would be interested in the latest data hot off the presses from the Snow Lab we showed them this picture:
and enquired?
What does that tell us?
The initial response from “gator69”?
The fact that you refer to “normal” in climate or weather tells us that you have zero understanding of either.
When will you work to help the starving millions by confronting alarmists, and assist in diverting money to where it is desperately needed right now?
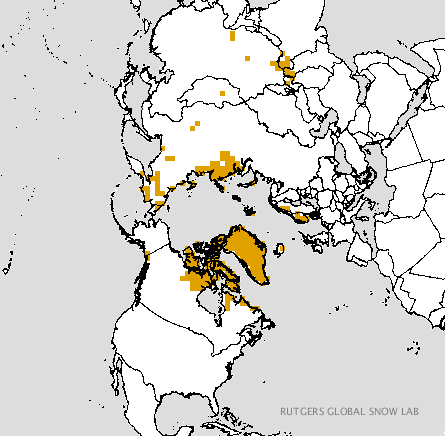
Since “Real Scientists” are apparently aghast at anomaly maps, here are the current absolute values from Rutgers:
Just in case you are wondering what all this has to do with Snow White’s favourite subject of all, here’s the current Topaz 4 map of Arctic sea ice snow cover:
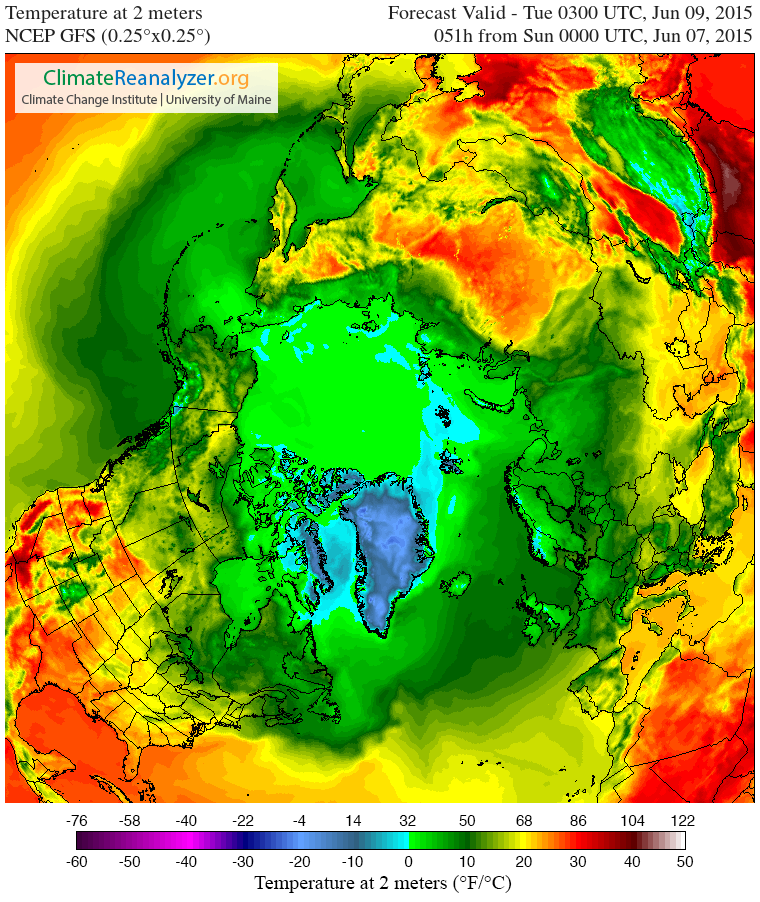
and here is the current northern hemisphere temperature forecast for Tuesday morning from the “Climate Reanalyzer”
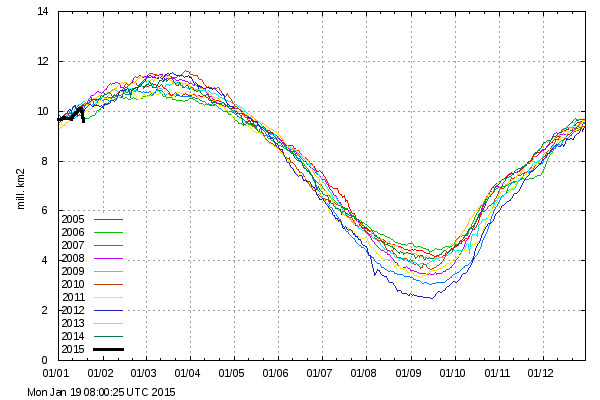
Snow White and I cannot help but wonder what effect temperatures above zero across virtually the entire Arctic Ocean will have on the snow cover that currently remains. We also cannot help but wonder whether 2015 Arctic sea ice extent will suddenly start tracking 1995 or 2006 as a consequence.
We also wondered what Tom Karl et al. of NOAA have been saying about the Arctic, and discovered this:
Since the IPCC report, new analyses have revealed that incomplete coverage over the Arctic has led to an underestimate of recent (since 1997) warming in the Hadley Centre/Climate Research Unit data used in the IPCC report. These analyses have surmised that incomplete Arctic coverage also affects the trends from our analysis as reported by IPCC.
Finally, for the moment at least, here’s the Topaz 4 snow depth forecast for June 16th 2015:
Thanks to “Nightvid Cole” and “Vergent” at the Arctic Sea Ice Forum for bringing that view of things to our attention.
Today we’re going to delve into the application of surf science in the Arctic. If you’re not already familiar with the basics of how the best surf is created then perhaps you might first wish to take a detour to the StormSurf “Wave Basics” article:
Wind waves, though rideable, are not the optimal type of wave one likes to ride. Swells are much better. Wind waves are only the raw material that swells are made from. But, the more energy wind waves accumulate while being driven by wind, the greater the likelihood they will transform into a swell. Enough energy and the swell can travel the entire circumference of the globe with only a slow decay in size!
During a typical open ocean winter storm, one could expect to see winds of 45-55 kts blowing over 600-1000 nautical miles for 36 hours. In such a storm, the average highest wind waves (or ‘seas’) commonly reach 30-35 ft towards the center of the fetch area and produce a swell with a period of 17-20 secs.
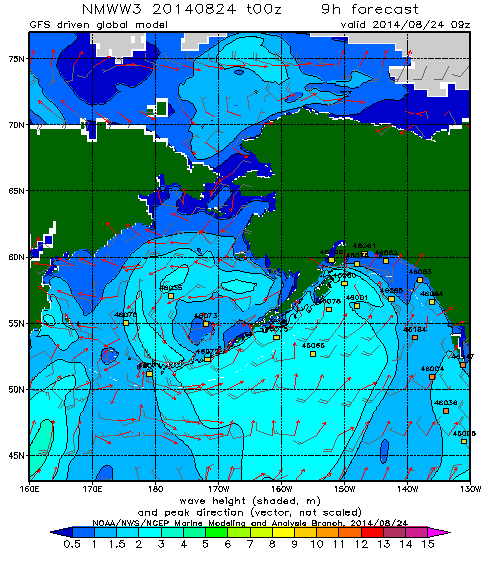
Regular readers may recall that on August 24th 2014 we revealed this WaveWatch III “surf forecast” for the Beaufort Sea, which lies off the north coast of Alaska and the Canadian Northwest Territories (i.e. top center of the map): and noted that the 2 meter waves depicted:
Have blasted past Point Barrow and are currently heading straight for the Beaufort Sea Marginal Ice Zone.
Here’s a video from the University of Washington’s Applied Physics Laboratory which explains that the Marginal Ice Zone is:
The area between declining unbroken sea ice and the expanding area of open water.
The theoretical significance of such swells has been discussed in a number of academic papers recently. Take for example these extracts from “Swell and sea in the emerging Arctic Ocean” by Jim Thomson from the University of Washington and W. Erick Rogers from the US Naval Research Laboratory. Note first of all that the authors distinguish between “wind seas” and “swells” as follows:
Pure wind seas have a wave age less than one, indicating that the wind is driving the waves, and these points cluster largely below the Pierson–Moskowitz limit. Swells have a wave age greater than one, indicating that the waves are outrunning the wind.
They then go on to use some more terms very familiar to the average surfer:
Ocean surface waves (sea and swell) are generated by winds blowing over a distance (fetch) for a duration of time. In the Arctic Ocean, fetch varies seasonally from essentially zero in winter to hundreds of kilometers in recent summers. Using in situ observations of waves in the central Beaufort Sea, combined with a numerical wave model and satellite sea ice observations, we show that wave energy scales with fetch throughout the seasonal ice cycle. Furthermore, we show that the increased open water of 2012 allowed waves to develop beyond pure wind seas and evolve into swells. The swells remain tied to the available fetch, however, because fetch is a proxy for the basin size in which the wave evolution occurs. Thus, both sea and swell depend on the open water fetch in the Arctic, because the swell is regionally driven. This suggests that further reductions in seasonal ice cover in the future will result in larger waves, which in turn provide a mechanism to break up sea ice and accelerate ice retreat.
It is possible that the increased wave activity will be the feedback mechanism which drives the Arctic system toward an ice-free summer. This would be a remarkable departure from historical conditions in the Arctic, with potentially wide-ranging implications for the air-water-ice system and the humans attempting to operate there.
In practice there were several more swells that impacted the Beaufort Sea marginal ice zone over the course of the next couple of weeks. Here’s what the charts looked like, as visualised by MagicSeaweed.com rather than NOAA:
Beaufort Sea on August 27th 2014 – Winds / Wave Height / Wave PeriodBeaufort Sea on September 1st 2014 – Winds / Wave Height / Wave PeriodBeaufort Sea on September 7th 2014 – Winds / Wave Height / Wave Period
Note that on the right of each set of three is a depiction of the period of the waves in question. As StormSurf points out:
Chop tends to have a period ranging from 3-8 seconds. That is, there is anywhere from 3-8 seconds between each wave crest. Wind waves range from 9-12 seconds. Ground swells range from 13-15 seconds, and strong ground swells have a period anywhere from 16-25 or more seconds.
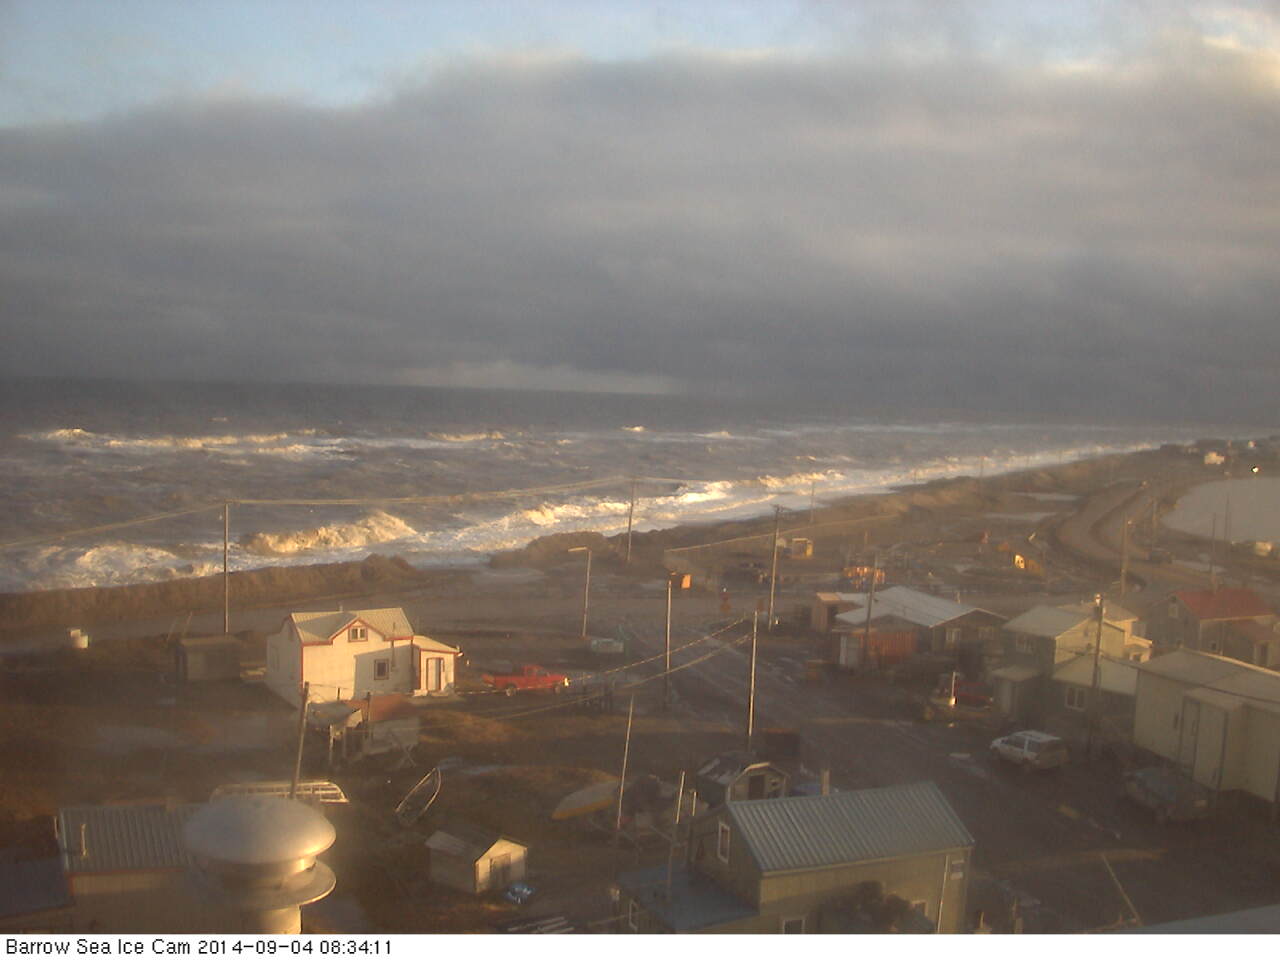
Thus the final swell on September 7th was actually the best of the bunch, with a small area of waves over 10 feet in height and with a period of over 9 seconds. According to StormSurf those are merely “wind waves” and not yet a full blown “swell”. To give you a feel for such waves here’s what some “wind waves” hitting the beach at Barrow looked like on September 4th 2014:
Next here’s another video that reveals what effect those series of waves had on the sea ice in the Beaufort Sea:
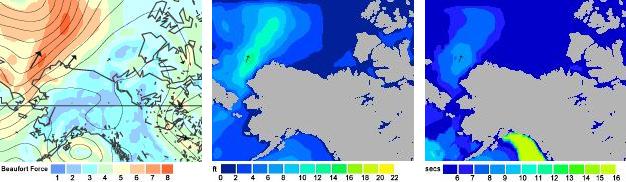
For future reference here also is the same swell described by Thomson and Rogers, but illustrated in an identical “surfer friendly” format to the 2014 swells we’ve been looking at:
Beaufort Sea on September 18th 2012 – Winds / Wave Height / Wave Period
whilst here is the swell produced by the “Great Arctic Cyclone” of early August 2012, also mentioned in passing by Thomson and Rogers:
Beaufort Sea on August 5th 2012 – Winds / Wave Height / Wave Period
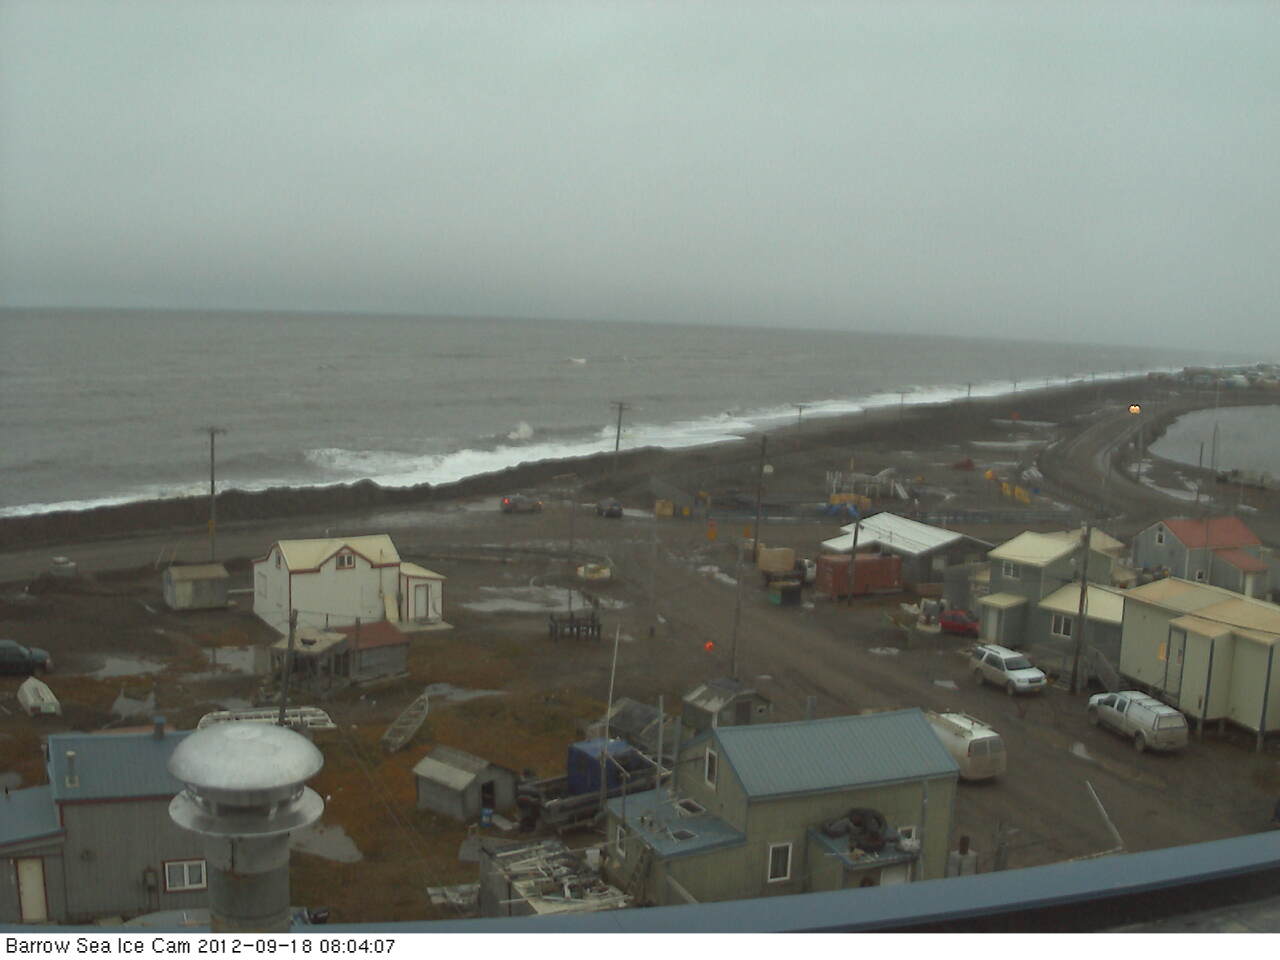
As you can see, if you’re a surfer used to tracking swells across the world’s oceans at least, whilst the September 2012 swell was indeed rather more substantial than those we have looked at in 2014, with a height in excess of 20 feet, the period was too short to qualify as a full blown swell and it was in fact directed away from the ice edge rather than towards it. Here’s what that 2012 swell looked like once it reached Barrow:
All of which does rather make one wonder what might happen if a slightly longer period swell directed at the ice edge in the Beaufort Sea were to occur at some point in the not too distant future? Whilst we all wait with bated breath to discover what that future holds for the sea ice in the Arctic, not to mention the beach at Barrow, here’s another video about the 2014 Marginal Ice Zone Program, which summarises the year’s campaign as a whole:
Note that Craig Lee says that:
We had very little wave activity. It was surprisingly calm when we were out there in the Araon, both when we were in the ice and in the open water. There just wasn’t much wind, and so there weren’t very many surface waves.
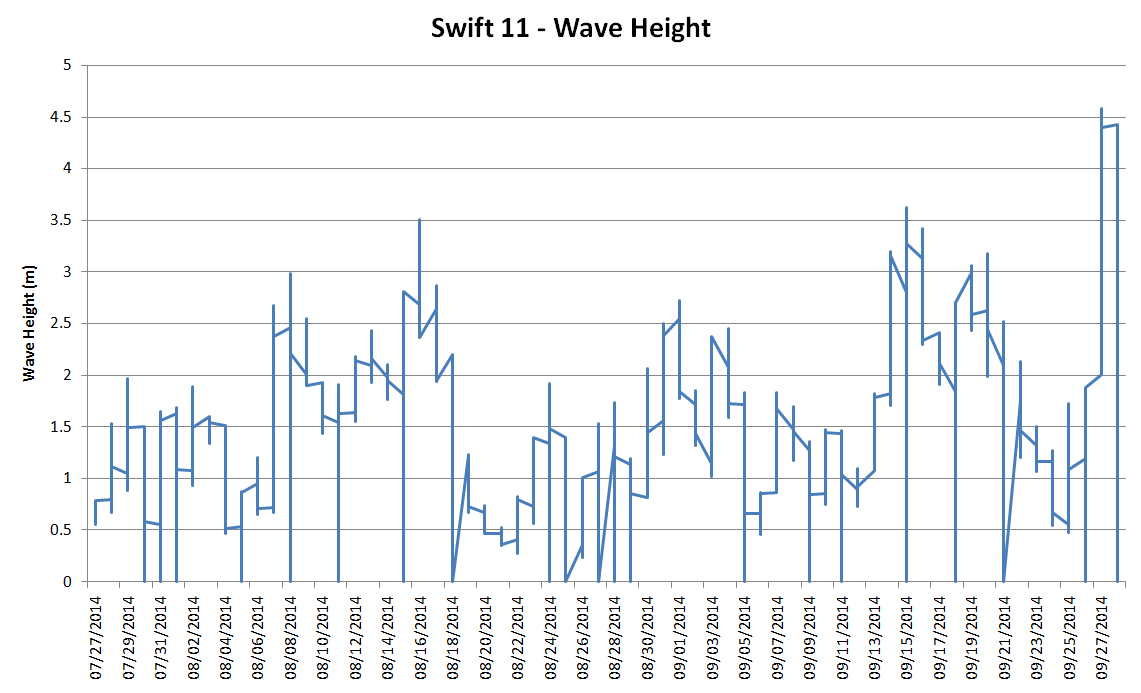
However at least one of the “robots” he refers to did discover some significant wave activity. Here’s a visualisation of SWIFT 11‘s record of significant wave height as it floated across the Beaufort Sea in the summer of 2014:
I don’t know about you, but I don’t think I would describe 4.5 meter waves as “surprisingly calm”, especially in the Arctic!
Regular readers of our so far somewhat surreal reporting from up here in the penthouse suite at the summit of the Great White Con ivory towers will no doubt have noticed that we like to concentrate on the facts about the Arctic, whilst occasionally naively exploring assorted psychological aspects of journeying through the “denialosphere”.
Today, however, we’re branching out in a different direction with the aid of our first ever guest post. It has been carefully crafted by Sou Bundanga of the HotWhopper blog, on the topic of the “journalistic tricks that professional disinformers use”. It covers some of the same ground as a recent post of our own, albeit from a rather different angle. If you would like view the original version on Sou’s blog please click here. Alternatively, please continue below the fold:
This is just a short article to show the journalistic tricks that professional disinformers use. It consists of excerpts from an article by David Rose, who is paid to write rubbish for the Mail on Sunday, a UK tabloid of the sensationalist kind. He’d probably claim that he’s just “doing his job”. His job being to create sensationalist headlines and not bother too much about accuracy, but to try to do it in such a way as to stop the paper ending up in court on the wrong end of a lawsuit. Just. (The paper probably doesn’t mind so much getting taken to the Press Complaints Commission. )
The Nasa climate scientists who claimed 2014 set a new record for global warmth last night admitted they were only 38 per cent sure this was true.
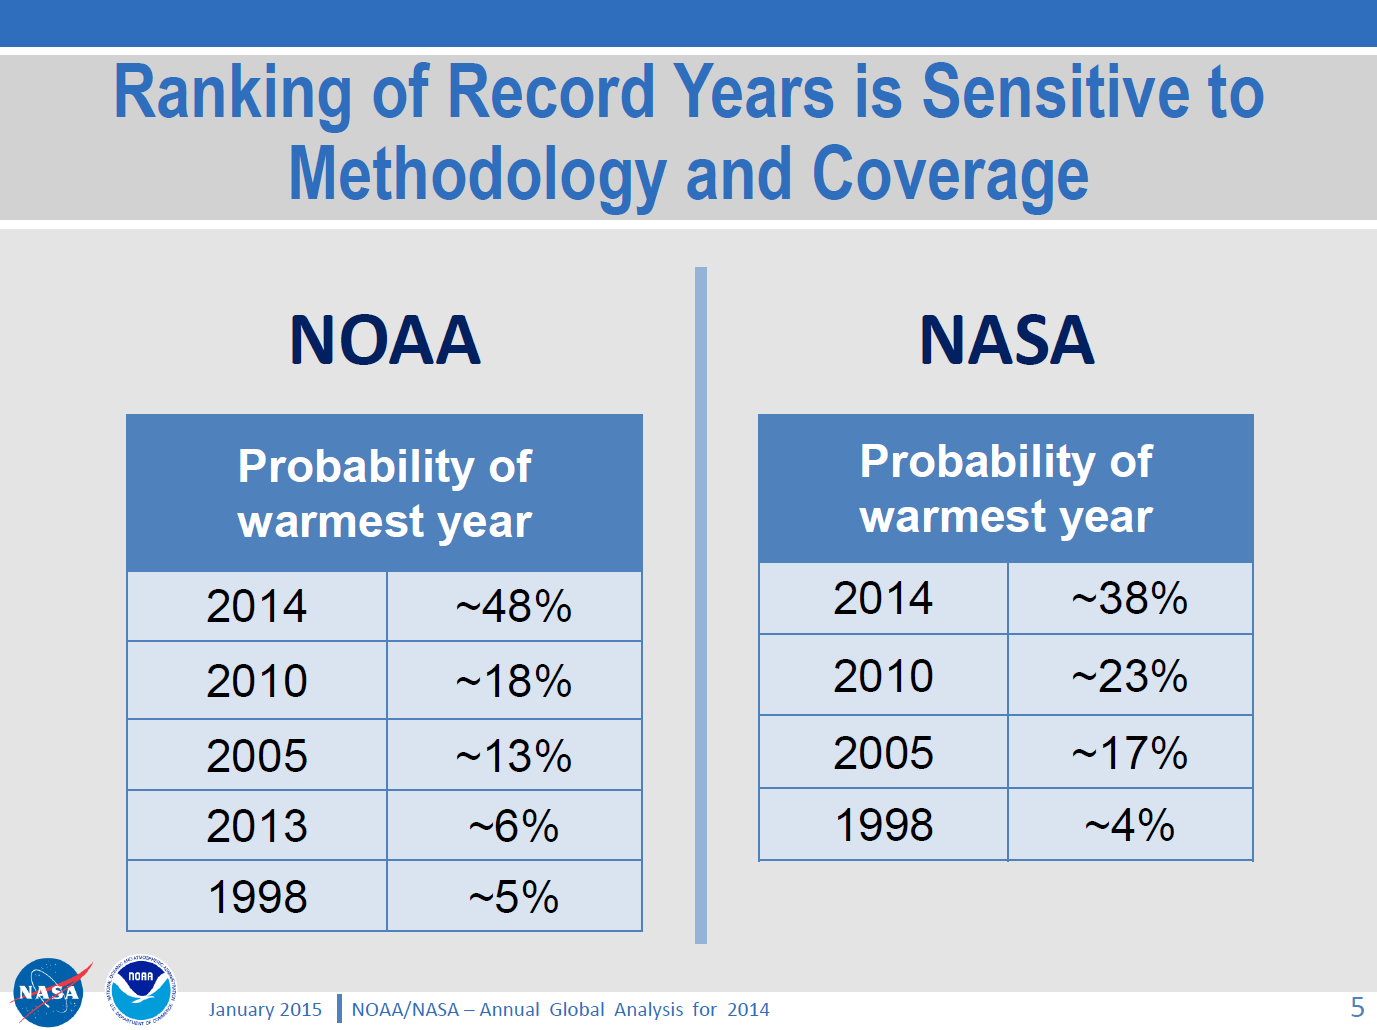
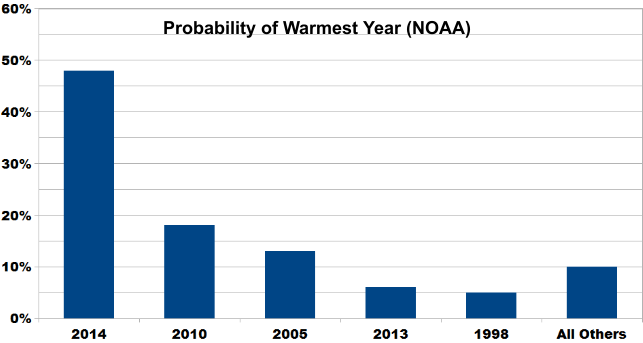
First of all notice the use of the word “admitted” – as if it was something that the scientists were forced into, whereas in fact they provided all the information in their press briefing. Notice also that David has taken one number and used it out of context. The 38% number is the probability that 2014 is the hottest year compared to the probability that 2010 and other hot years are the hottest. 2010, the next hottest year, only got a 23% probability by comparison. Here is the table showing out of 100%, what the different probabilities are:
You can see how David misused the 38% number. In fact the odds of it being the hottest year on record are the highest of the lot.
In a press release on Friday, Nasa’s Goddard Institute for Space Studies (GISS) claimed its analysis of world temperatures showed ‘2014 was the warmest year on record’.
The claim made headlines around the world, but yesterday it emerged that GISS’s analysis – based on readings from more than 3,000 measuring stations worldwide – is subject to a margin of error. Nasa admits this means it is far from certain that 2014 set a record at all.
See how David Rose distorts things. How he uses rhetoric, abusing words like “emerged” and “claim” and “admits”. He is also being “economical with the truth” about the “far from certain”. He just made that one up. It may not be “certain”, but it is much more certain than “far from”. And it is more “certain” that 2014 was the hottest year than that any other year was the hottest year.
If David Rose were arguing that you beat your wife, even though you don’t, he’d probably write it up as:
The so-called scientist claims that he doesn’t beat his wife. He admits that he cannot prove he doesn’t beat his wife. However this journalist can show that it has emerged that his claim is subject to a margin of error. 95% of wife-beaters deny beating their wives.
And I doubt he’d add the confidence limits to the 95% number!
David Rose continues his deception writing:
Yet the Nasa press release failed to mention this, as well as the fact that the alleged ‘record’ amounted to an increase over 2010, the previous ‘warmest year’, of just two-hundredths of a degree – or 0.02C. The margin of error is said by scientists to be approximately 0.1C – several times as much.
That section by David Rose contains the same journalistic tricks of rhetoric, as well as an error of fact. The margin of error of the annual averaged global surface temperature is described in the GISS FAQ as ±0.05°C:
Assuming that the other inaccuracies might about double that estimate yielded the error bars for global annual means drawn in this graph, i.e., for recent years the error bar for global annual means is about ±0.05°C, for years around 1900 it is about ±0.1°C. The error bars are about twice as big for seasonal means and three times as big for monthly means. Error bars for regional means vary wildly depending on the station density in that region. Error estimates related to homogenization or other factors have been assessed by CRU and the Hadley Centre (among others).
If the press release didn’t include any confidence limits, then where did David Rose get his numbers from you may ask? That’s a very good question. It turns out that NOAA and NASA held a press conference, during which they showed some slides and explained the confidence limits, among other things. So David Rose was being very deceitful, wasn’t he. Which isn’t a surprise.
What bit of deception does he swing to next? Well here it is. You be the judge:
As a result, GISS’s director Gavin Schmidt has now admitted Nasa thinks the likelihood that 2014 was the warmest year since 1880 is just 38 per cent. However, when asked by this newspaper whether he regretted that the news release did not mention this, he did not respond. Another analysis, from the Berkeley Earth Surface Temperature (BEST) project, drawn from ten times as many measuring stations as GISS, concluded that if 2014 was a record year, it was by an even tinier amount.
More rhetorical tricks using words like “admitted”. More deception by David Rose. When and how and where did David Rose ask Gavin Schmidt the question? I don’t know. It looks as if it was via an accusatory tweet of the type “have you stopped beating your wife”, like this one on January 17th:
@ClimateOfGavin why didn’t you mention the size of the 2014 “record” and the uncertainty in the GISS press release? Do you regret this?
That’s about it. I’ll leave it to you to decide who is the grand deceiver.
I’d not trust David Rose, denier journo, with a single fact. It is alleged that he is a master of deception. He’d probably try to claim he is just doing his job.
Thanks very much for that article Sou, and by way of conclusion here’s yet another tweet from Gavin Schmidt, this time from January 24th:
I don’t usually get involved in debates about “the global warming pause”, but as you will eventually see there is an Arctic connection, so please bear with me. Personally I reckon “global heat” is more relevant than “global surface temperature”, but nevertheless NASA and NOAA issued a “news release” a couple of days ago stating that:
The year 2014 ranks as Earth’s warmest since 1880, according to two separate analyses by NASA and National Oceanic and Atmospheric Administration (NOAA) scientists.
The 10 warmest years in the instrumental record, with the exception of 1998, have now occurred since 2000. This trend continues a long-term warming of the planet, according to an analysis of surface temperature measurements by scientists at NASA’s Goddard Institute of Space Studies (GISS) in New York.
In an independent analysis of the raw data, also released Friday, NOAA scientists also found 2014 to be the warmest on record.
The announcement was accompanied by this video:
I figured our old friend David Rose would have something to say about all that in the Mail on Sunday, and I was not disappointed. Yesterday David reported, in bold headlines:
Nasa climate scientists: We said 2014 was the warmest year on record… but we’re only 38% sure we were right
Nasa’s Goddard Institute for Space Studies claimed its analysis of world temperatures showed ‘2014 was the warmest year on record’
But it emerged that GISS’s analysis is subject to a margin of error
Nasa admits this means it is far from certain that 2014 set a record at all
David Rose includes this NASA video in the online version of his article:
which finishes up showing the Arctic blanketed in red for the period 2010-14. In the body of the article David suggests that:
GISS’s director Gavin Schmidt has now admitted Nasa thinks the likelihood that 2014 was the warmest year since 1880 is just 38 per cent.
but for some strange reason David neglects to mention this NASA/NOAA “press briefing“, which includes the following figure:
As you can see and hear, Gavin Schmidt’s “admission” was pretty public, and available for anyone doing their due diligence on this thorny topic to see well before the Mail on Sunday published David Rose’s article. For still more from Gavin see also the second half of yet another video from NASA, which we’ve hastily made embeddable from YouTube since NASA’s Goddard Space Flight Center don’t seem to have done so themselves as yet:
[Edit – 23/01/2015]
By way of further elucidation of the NASA/NOAA table of probabilities above, here’s a new graphic courtesy of Skeptical Science:
The probability of 2014 being the warmest year (due to margin of uncertainty and the small differences between years) is almost ten times that of 1998. And the contrarians were very certain that year was warm!
Does that help make things clearer, for those who evidently have difficulty understanding statistics?
[/Edit]
I also figured that the likes of “Steve Goddard” and Anthony Watts would be jumping on the same bandwagon, so you can imagine my disappointment when I discovered that they have both, unlike Gavin, blocked me from their Twitter feeds! Venturing over to the so called “Real Science” blog instead I discovered that Steve/Tony does at least read Gavin’s Twitter feed, although apparently not NASA/NOAA press briefings:
Them:
Implausible Deniability
Gavin is playing his usual game, trying to cover his ass with “uncertainty” that wasn’t mentioned in the NASA press release.
They get the propaganda out there for the White House and major news outlets, then try to generate implausible deniability through back channels like twitter. None of this was mentioned in the NASA press release.
Us:
I take it you weren’t on the call either Tony? Have you by any chance seen this press briefing?
THE DATA ON WEATHER AND CLIMATE (NASA AND NOAA) CAN BE COMPARED TO THE STOCK MARKET ON WALL STREET, MUCH CORRUPTION AND ALTERING. WE ARE NOT GUARANTEED A CERTAIN TEMPERATURE EVERYDAY; ALTHOUGH, THAT IS WHAT THEY WOULD HAVE US THINK, JUST BECAUSE OF SEASONS IN GENERAL.
Further to previous correspondence on similar matters, on January 27th 2015 I received the following email from the Personal Assistant to John Wellington, David Rose’s managing editor at the Mail on Sunday:
Dear Jim,
Thank you for your email.
I am afraid the best person to deal with your question is John Wellington who will reply on his return at the beginning of March.
Thank you for your patience.
Kind regards
Poppy Hall
Us:
CC: IPSO.co.uk
Dear Poppy,
Thanks for that information, but I am afraid my almost infinite patience in this matter is exhausted.
In John’s absence perhaps I might reiterate a question posed by Bob Ward of The Grantham Institute on Twitter yesterday:
Predictable that Mail on Sunday censored all letters pointing out errors in last week's article by @DavidRoseUK about @NASAGISS
Please would you ask whoever owns the desk on which the buck currently stops for the article entitled “Nasa climate scientists: We said 2014 was the warmest year on record… but we’re only 38% sure we were right” by David Rose to communicate with me as soon as possible. FYI – Here it is:
As I’m sure you must realise by now, unfortunately it includes some inaccurate and/or misleading statements which as far as I can ascertain have still not been publicly corrected.
Best wishes,
Jim Hunt
Post Script:
Bob Ward lodged a formal complaint with the Independent Press Standards Organisation about the Mail on Sunday article. Their conclusion?
The complaint was not upheld.
Remedial Action Required – N/A
Date complaint received: 13/02/2015
Date decision issued: 22/06/2015
Their “reasoning”?
The Committee noted that information about the margin of error had been made available by GISS, but that it was not in dispute that these details had been omitted from the press release. The article had made clear that this specifically was the basis for its criticism of Nasa, and the newspaper was entitled to present its view that this omission represented a failure on the part of the organisation. While the information had been released by Nasa, it had been released to a limited selection of people, in comparison to those who would have had access to the press release, and had not been publicised to the same level as the information in the release. The press briefing images referred to by the complainant were available on Nasa’s website, but were not signposted by the press release. In this context, it was not misleading to report that the information relating to the margin of error had emerged in circumstances where the position was not made clear in the press release. While these details of the margin of error may have been noted in a press briefing two days previously, rather than “yesterday”, as reported, this discrepancy did not represent a significant inaccuracy requiring correction under the terms of the Code.
This website uses cookies to improve your experience. We'll assume you're ok with this, but you can opt-out if you wish. Cookie settingsACCEPT
Privacy & Cookies Policy
Privacy Overview
This website uses cookies to improve your experience while you navigate through the website. Out of these, the cookies that are categorized as necessary are stored on your browser as they are essential for the working of basic functionalities of the website. We also use third-party cookies that help us analyze and understand how you use this website. These cookies will be stored in your browser only with your consent. You also have the option to opt-out of these cookies. But opting out of some of these cookies may affect your browsing experience.
Necessary cookies are absolutely essential for the website to function properly. This category only includes cookies that ensures basic functionalities and security features of the website. These cookies do not store any personal information.
Any cookies that may not be particularly necessary for the website to function and is used specifically to collect user personal data via analytics, ads, other embedded contents are termed as non-necessary cookies. It is mandatory to procure user consent prior to running these cookies on your website.