Our coverage of the Northwest Passage is starting somewhat earlier then usual in 2016. That’s because an educational comment of mine seems to have gone permanently missing over at Andrew Montford’s blog. Over there commenter “Golf Charlie” suggested that:
Perhaps based on rumours, or folk stories, the possibility of a North West Passage, was the answer to many peoples dreams of wealth, fame and fortune. The Franklin Expedition set off, with all confidence, knowing that there had been an unprecedented retreat in Arctic sea ice extent. They never came home. The ships then sent to rescue them, never came home either, but some survivors did.
In July 2010, due to unprecedented ice loss, a team set out to find HMS Investigator, (one of the rescue ships) and found her within 15 minutes, exactly where she was trapped and abandoned. How had she got there?
This may be just a load of boring and irrelevant history to you, but as an ice expert keen to lecture others, it just seems strange that you don’t acknowledge the fact that before man made CO2 emissions could possibly had any remote chance of shrinking sea ice, it had all happened before.
It is likely that whatever caused the ice to retreat in the 1830s/40s, may have caused the current retreat. As no attempt has been made to explain this historical retreat, it seems premature to jump to conclusions about the present. What stories and folklore convinced Franklin there was a NWP? Had it opened before? Did the Vikings circumnavigate the North Pole? No one knows for sure.
Here’s the beginnings of my by now expanded reply:
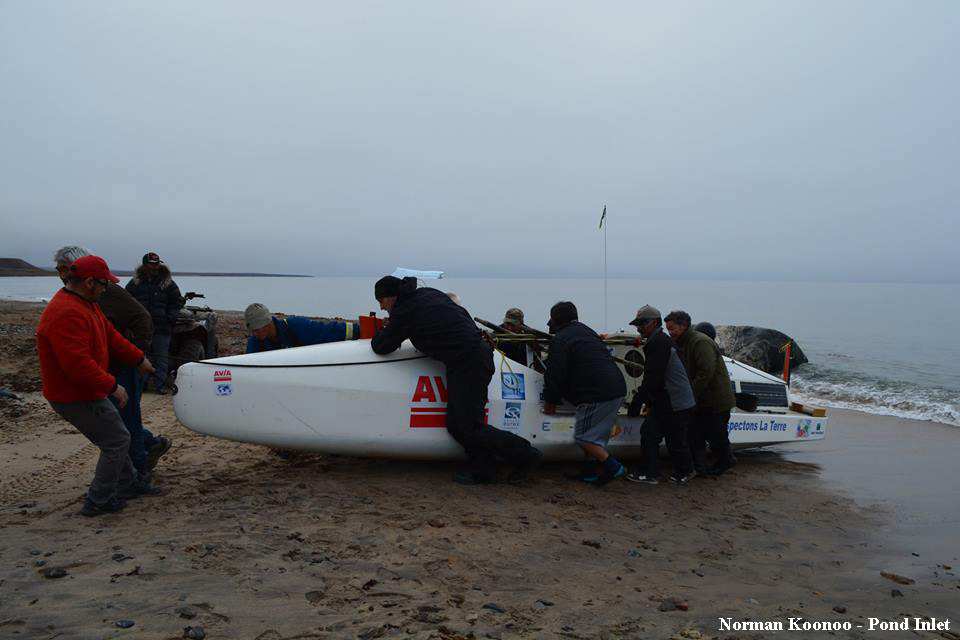
I am already very familiar with the sorry tale of Franklin’s ill fated expedition. By way of some more recent Northwest Passage history, were you previously aware that Charles Hedrich completed his own multi-year voyage through the NWP last summer? His vessel was much smaller than Franklin’s:
“He is now, the first man to have rowed solo the North-West Passage.”
It’s not terribly clear, but apparently Charlie thinks his “unprecedented ice loss” in the Summer of 2010 had a precedent in the 1840s and/or 50s. Perhaps he will pop in and elucidate? Whilst we wait to see what transpires in that regard, here’s an animation of sea ice concentration across the Northwest Passage last summer:
You will note that the “southern route” taken by Roald Amundsen in Gjøa opens first, ultimately followed by the “main route” via the McClure Strait.
My missing comment also referenced (by way of example!) a 2015 academic journal paper entitled “Ice thickness in the Northwest Passage“. Amongst its other conclusions can be found this:
Global climate models with their coarse resolution likely have difficulty capturing intricate sea ice dynamic processes within the narrow channels of the CAA. Specifically, the import, survival, and thickness of MYI are difficult to predict and may in fact increase during the transition to a sea ice-free Arctic with more mobile ice conditions in the Queen Elizabeth Islands which are located between the Arctic Ocean and NWP. Presumably, MYI from the Arctic Ocean will be more heavily ridged and thicker than locally formed MYI, posing greater danger to transiting ships than locally grown MYI.
Whilst we look forward to the prospects of the “transition to a sea ice-free Arctic”, what about the prospects for the Northwest Passage in the summer of 2016. As you can see from the video there wasn’t much in the way of multi-year sea ice left there by the Autumn of 2015, and there doesn’t seem to have been much transport of ice into the Canadian Arctic Archipelago over the winter either.
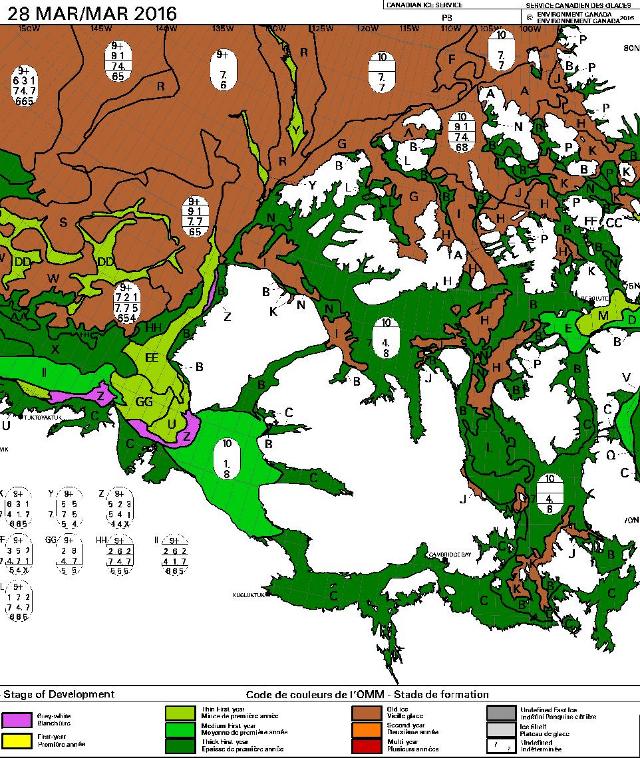
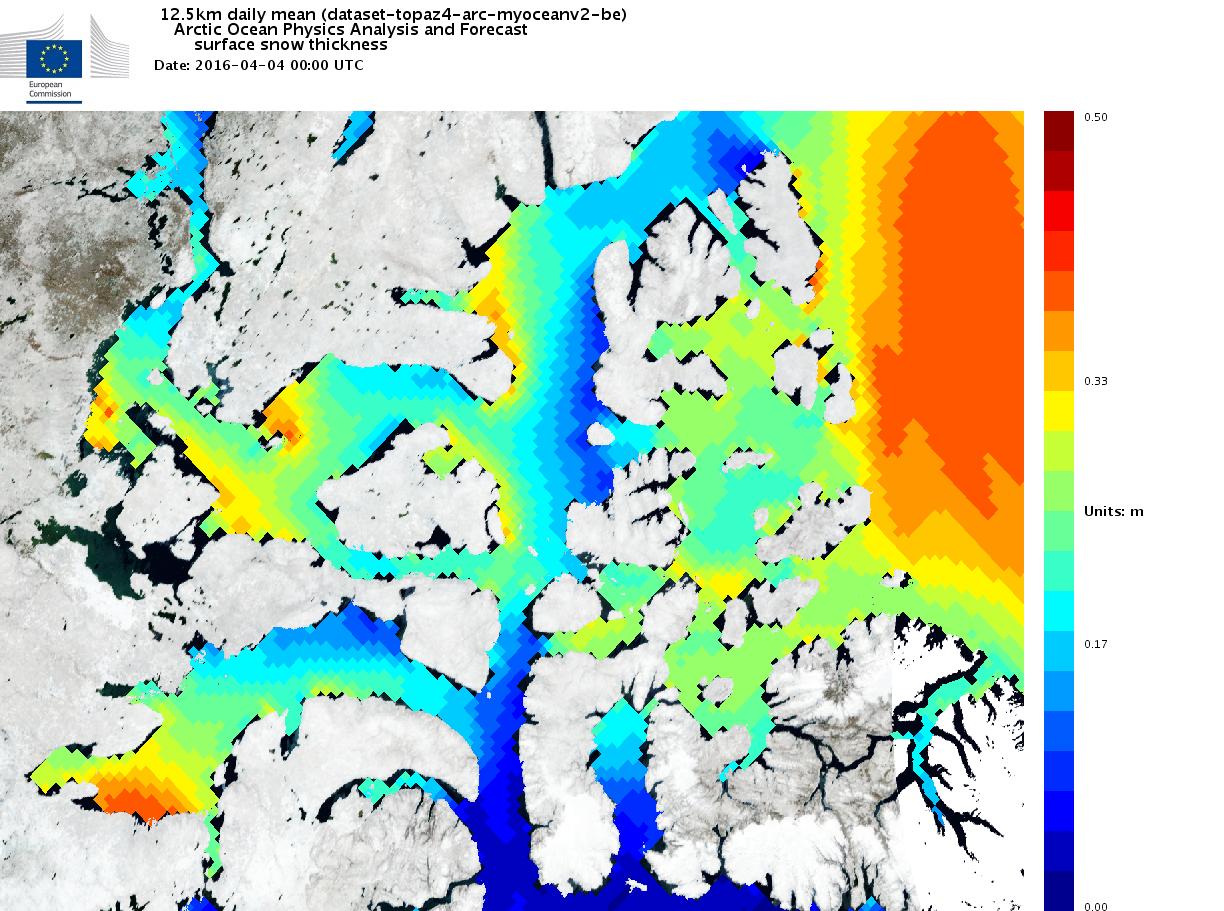
On top of the ice there will of course be some snow by now. Here’s how the Topaz 4 snow cover map of the area looks at the moment:
All in all it looks to me at this early stage of the 2016 Arctic sea ice melting season as though one or more of the assorted routes through the Northwest Passage will be open again this coming summer. Do you suppose that will look like yet another “unprecedented retreat” to “Golf Charlie’s” eyes?
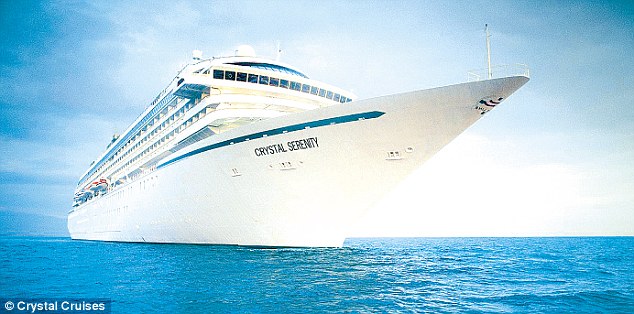
It seems as though a large commercial organisation sees things that way too. Crystal Cruises have concluded that in 2016 the Northwest Passage offers:
The ultimate expedition for the true explorer!
Anchorage to New York on Crystal Serenity
DATES : August 16 – September 17, 2016 (32 Days) CRUISE-ONLY FARES FROM : $21,855 Per PersonMore than 18 months of careful planning and analysis has already gone into this project from January 2013 to July 2014, and will continue up to, and through, departure.
There will not be shore-based cell phone signals along the transit, except in the communities and towns we will be visiting. However, guests are requested to not use this signal when in port, as it will overwhelm the local system and disrupt the communication within the community.
While communication channels may be temporarily limited or unavailable to guests, the ship’s Captain and crew will always have operational and emergency communication throughout the entire voyage.