As is our current habit this month’s report begins with the high resolution Arctic sea ice area and extent graphs based on the University of Hamburg’s AMSR2 concentration maps:
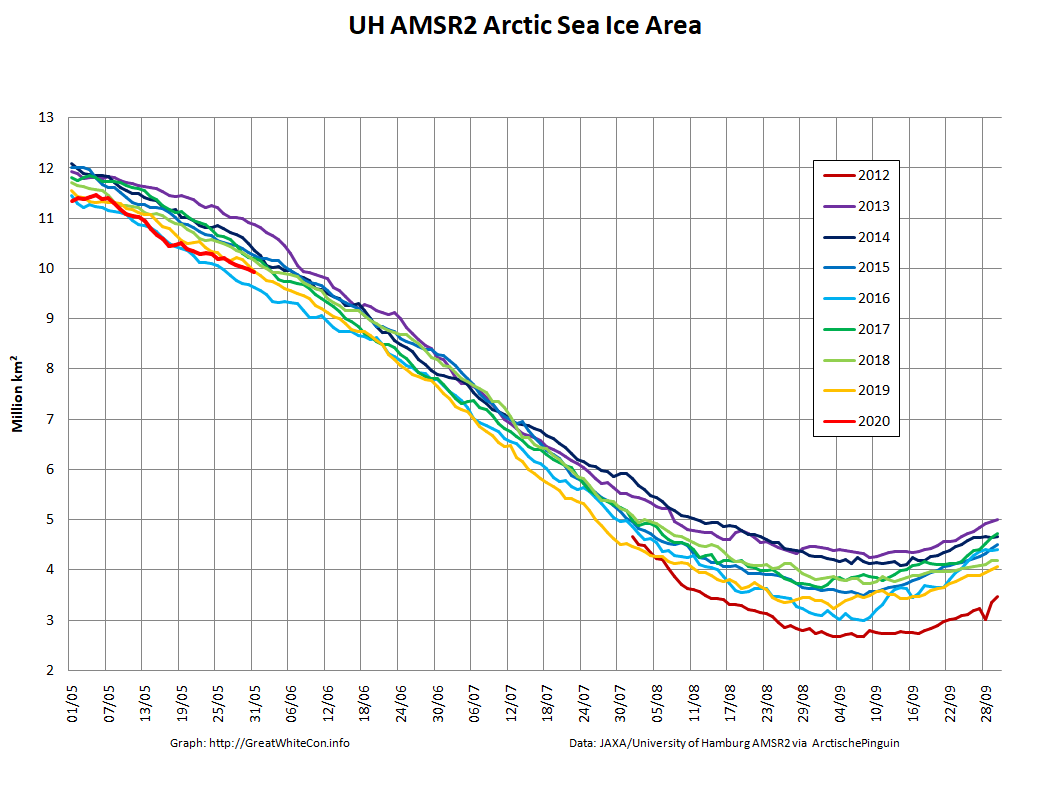
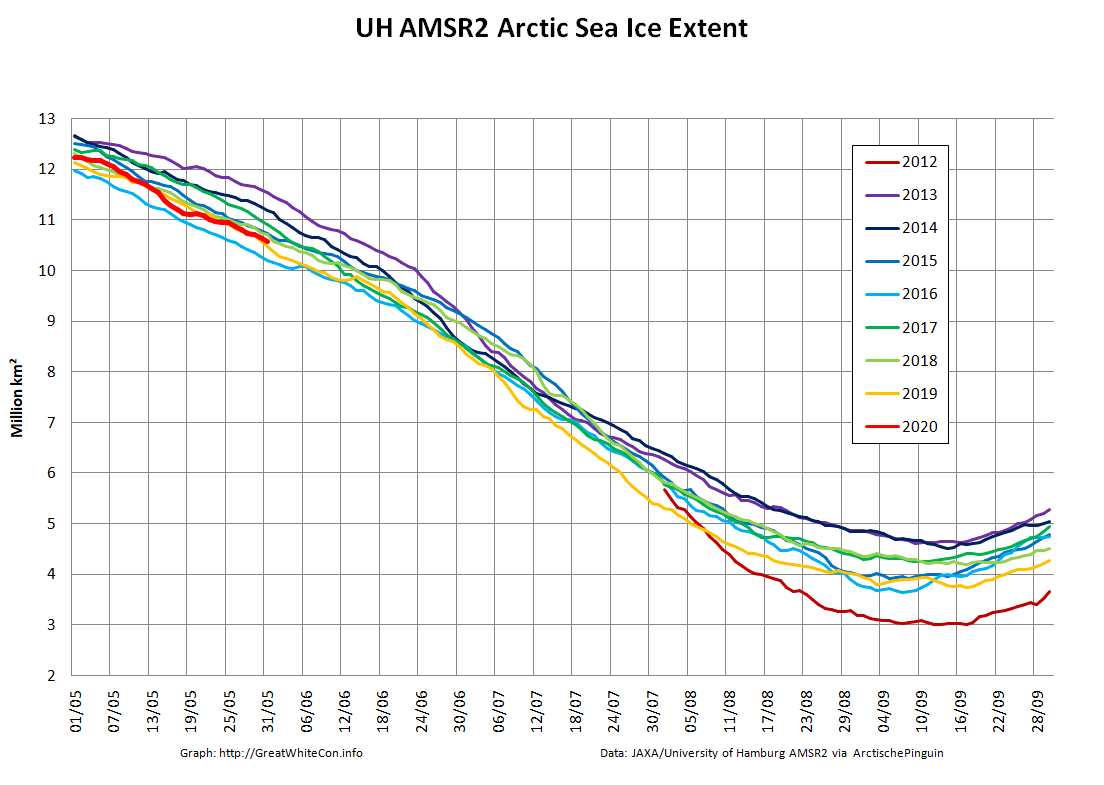
Area and extent are currently vying for second place with 2019 on the “lowest for the date” leader board, a little behind 2016 at this point in the 2020 melting season.
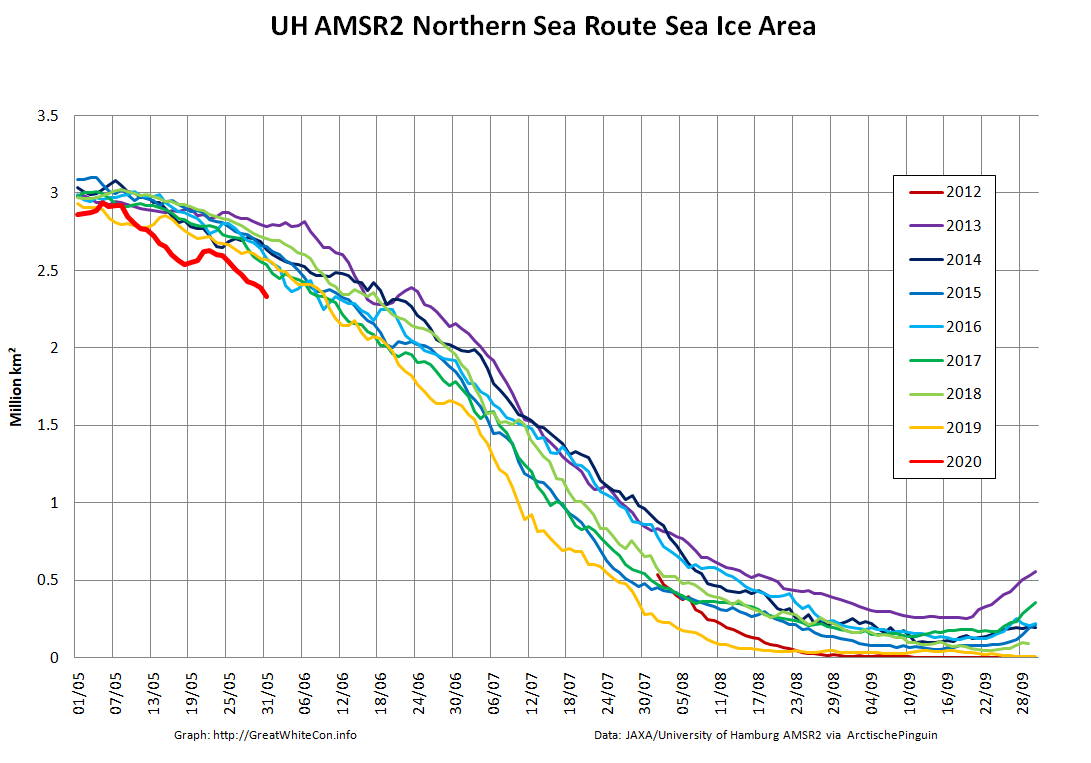
However following the extremely warm spring in Siberia, the sea ice area along the assorted sea that comprise the Northern Sea Route is well below all previous years in the AMSR2 record:
Another effect of the sweltering Siberian spring is evident in the melt ponds visible below the clouds across the southernmost parts of the Laptev Sea:
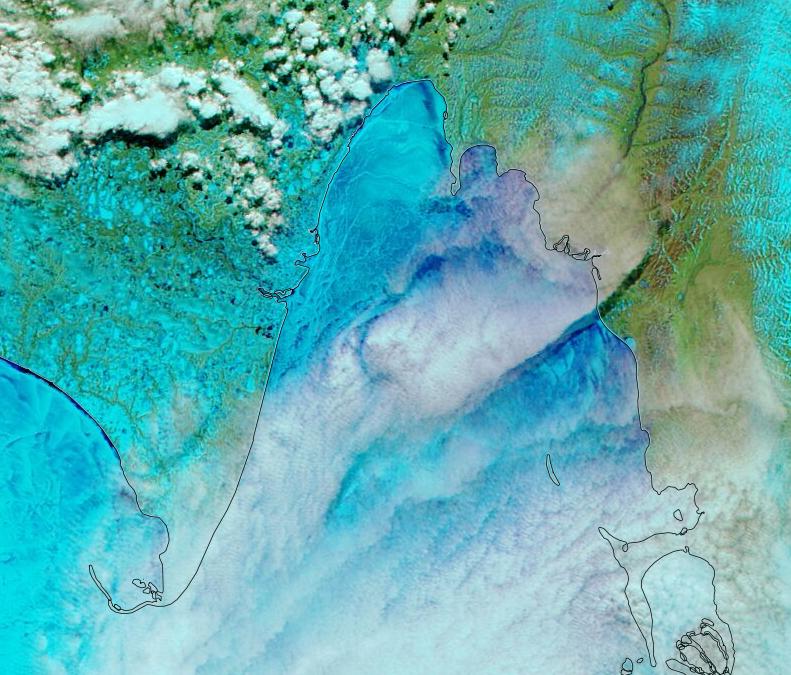
plus the East Siberian Sea and Chaunskaya Bay:

[Edit – June 4th]
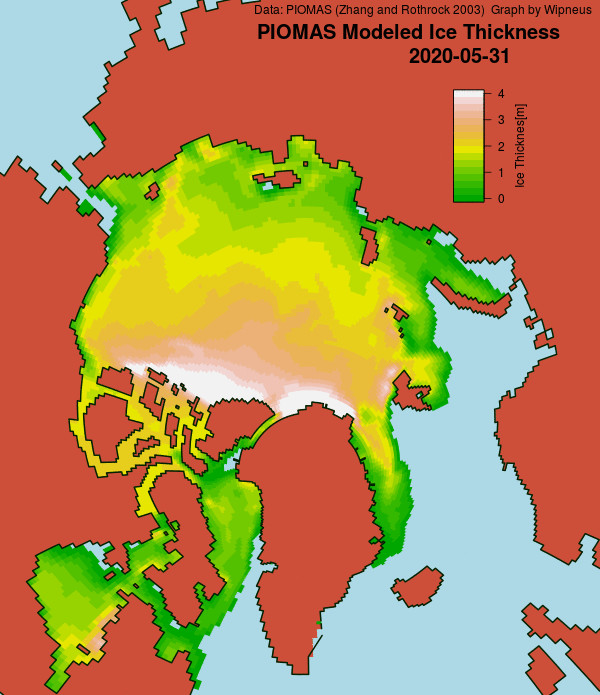
The May 31st PIOMAS gridded thickness numbers have been released, and Wipneus has crunched the numbers:
Here too is the latest volume graph:
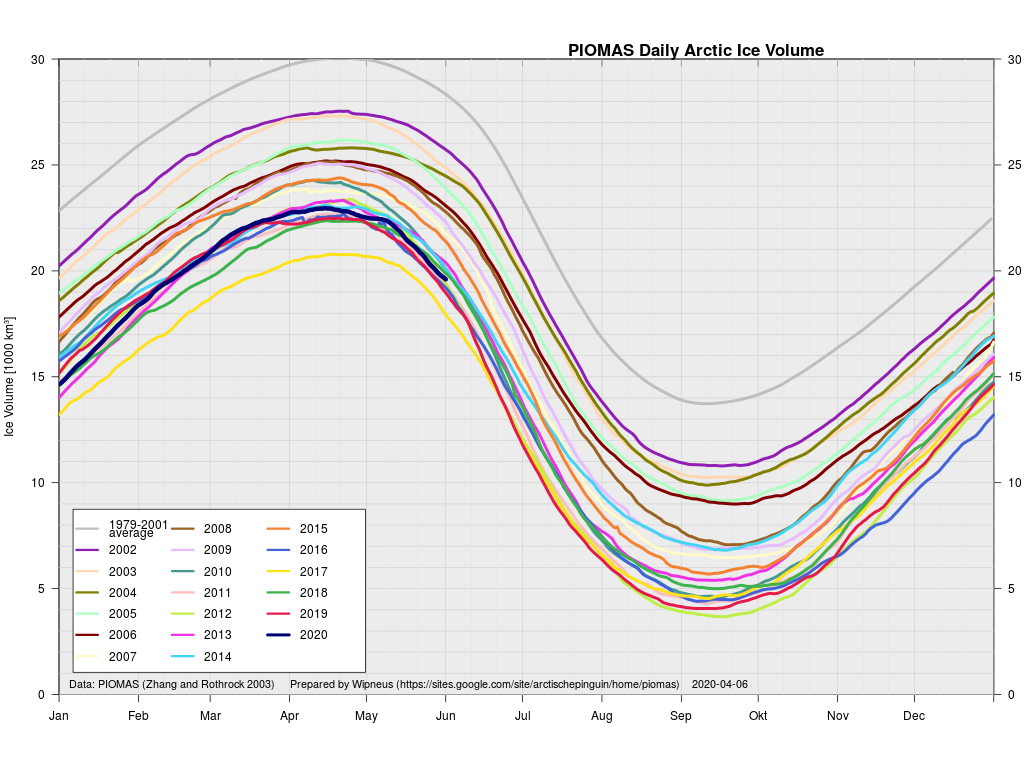
According to the Polar Science Center’s May 2020 update:
Average Arctic sea ice volume in May 2020 was 21,500 km3. This value is 1700 km3 above the record minimum value of 19,800 km3 set in 2017, making it the sixth lowest on record. Monthly ice volume was 39% below the maximum in 1979 and 25% below the mean value for 1979-2019. May 2020 ice volume falls 0.8 standard deviations above the trend line. Daily volume anomalies for May progressed at a fairly normal pace for recent years. Average ice thickness is in the middle of the pack for the more recent years. Ice thickness anomalies for May 2020 relative to 2011-2018 continue the April pattern and show relatively thin ice along the Russian Coast and thicker than normal sea ice in the Barents sea. There are some fairly strong positive anomalies in the eastern Beaufort and north of Greenland. This anomaly pattern is likely due to the very strong positive Arctic-Oscillation index pattern that occurred during the Winter of 2020.
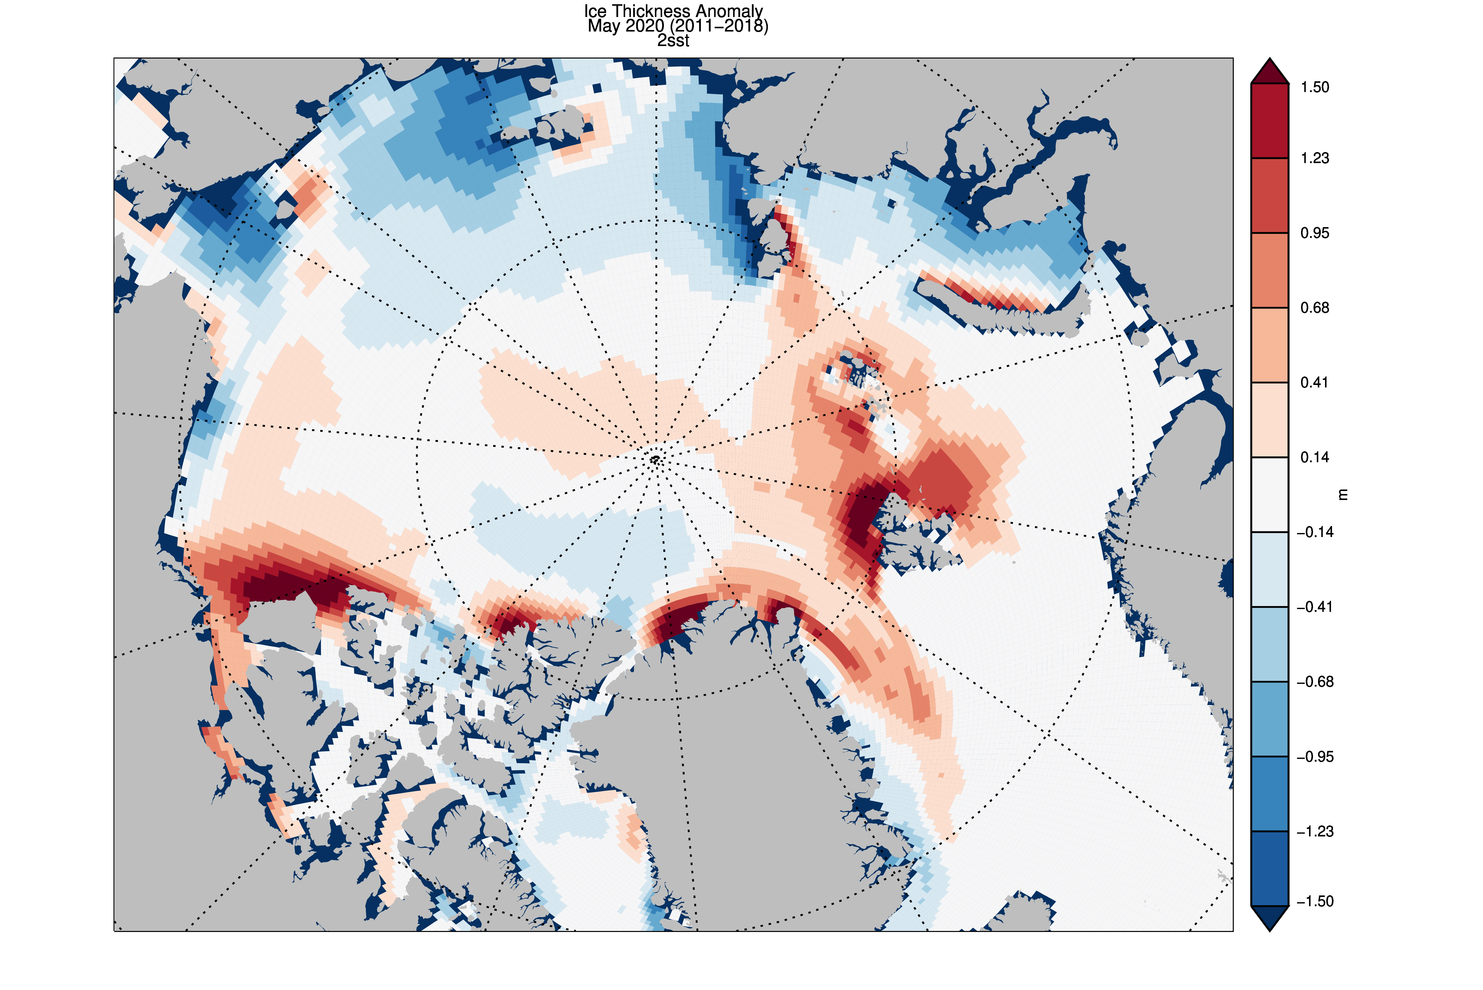
There looks to be a lot of anomalously thick ice waiting to melt out on the Atlantic periphery, and it will be interesting to see how the thicker ice in the eastern Beaufort Sea fares as the melting season progresses.
As also suggested by the area graph above, the Northern Sea Route is going to be open early in 2020. In fact a ice hardened tanker has already begun its journey through, unsupported by an icebreaker:
It was the “Christophe de Margerie” that on the 19th May kickstarted this year’s shipping season across the eastern part of the Northern Sea Route. The vessel owned and operated by Russian shipping company Sovcomflot loaded up liquefied natural gas in Sabetta and is due to arrive in the Chinese port of Jingtang on the 11th June. It was the earliest east-bound shipment on the route ever for this kind of vessel.
By 27th May, the ship had made it almost to Wrangel Island, information from ship tracker service MarineTraffic shows. The “Christophe de Margerie” is accompanied by nuclear powered icebreaker “Yamal”.
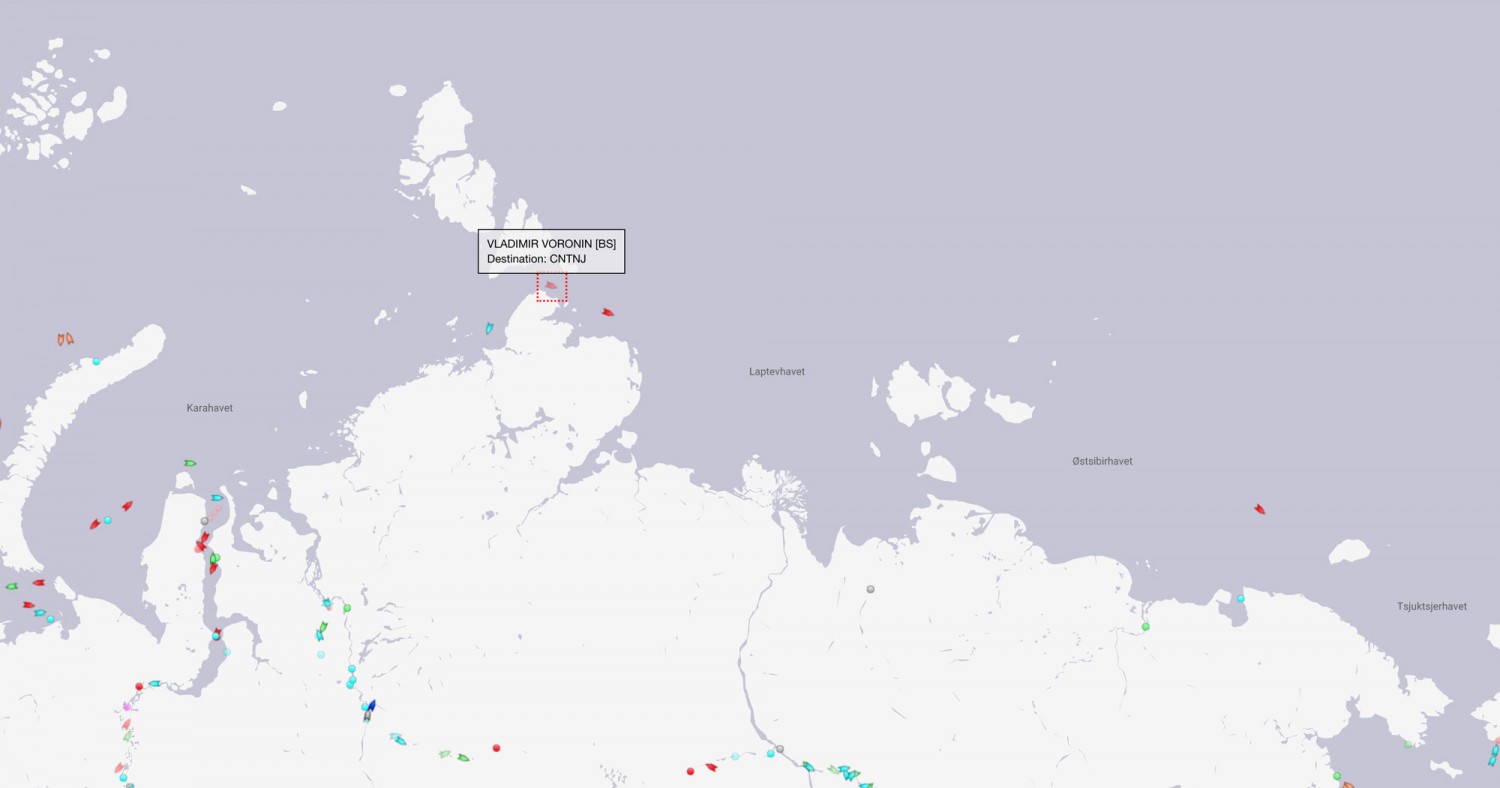
In the wake of the almost 300 meter long vessel now follows the “Vladimir Voronin”, a vessel that is operated by company Teekay. The “Vladimir Voronin” on the 25th May left Sabetta and was on May 27th located in the Vilkitsky Strait north of the Taymyr Peninsula.
The ”Vladimir Voronin” is not accompanied by icebreaker. The “50 Let Pobedy” that escorted the ship out of Sabetta and eastwards towards the Vilkitsky Strait has now returned and appears to be on its way back to Sabetta.
[Edit – June 17th]
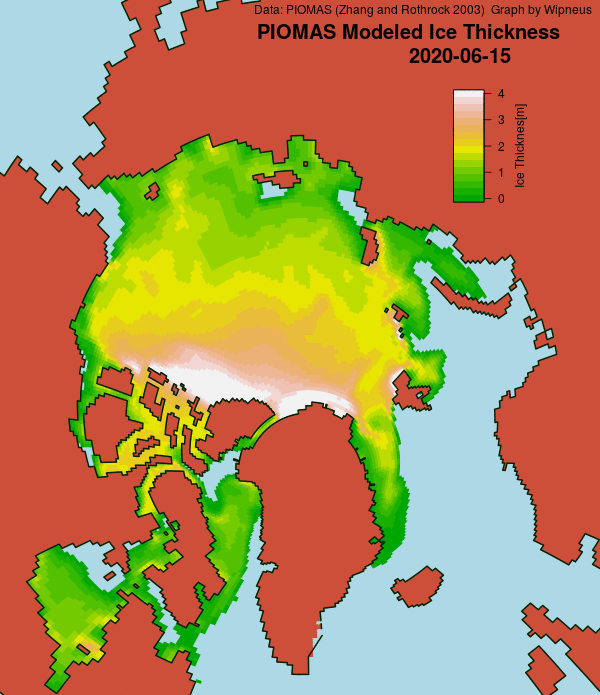
The mid month PIOMAS gridded thickness numbers have just been released. Here’s the thickness map:
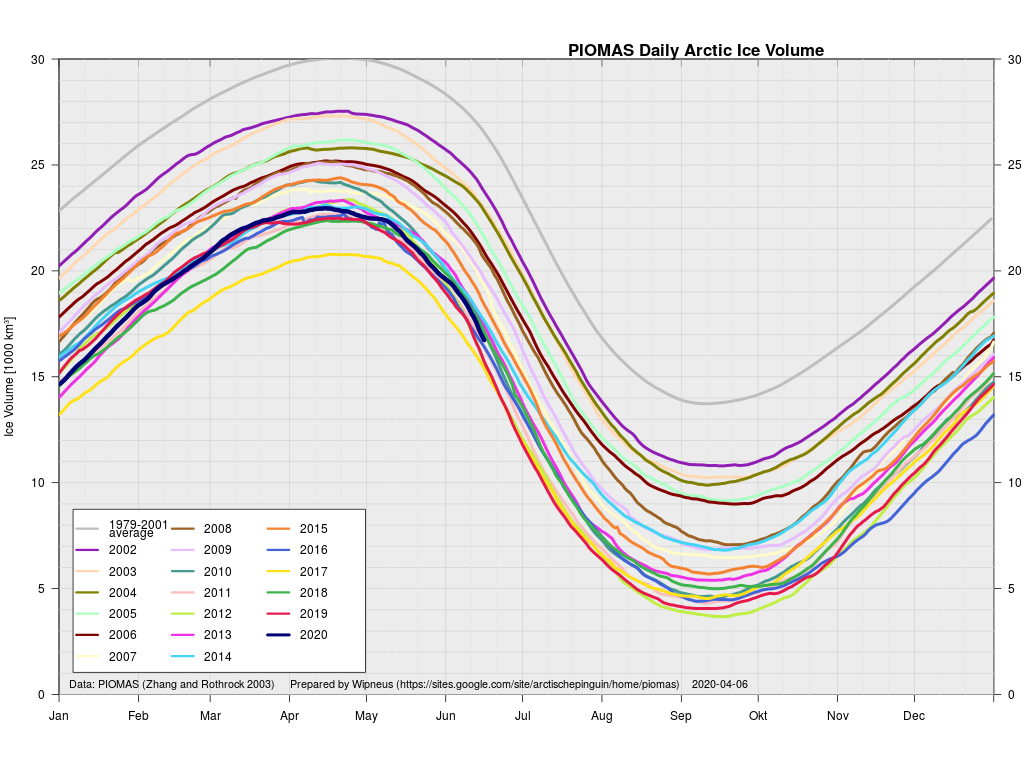
and the volume graph:
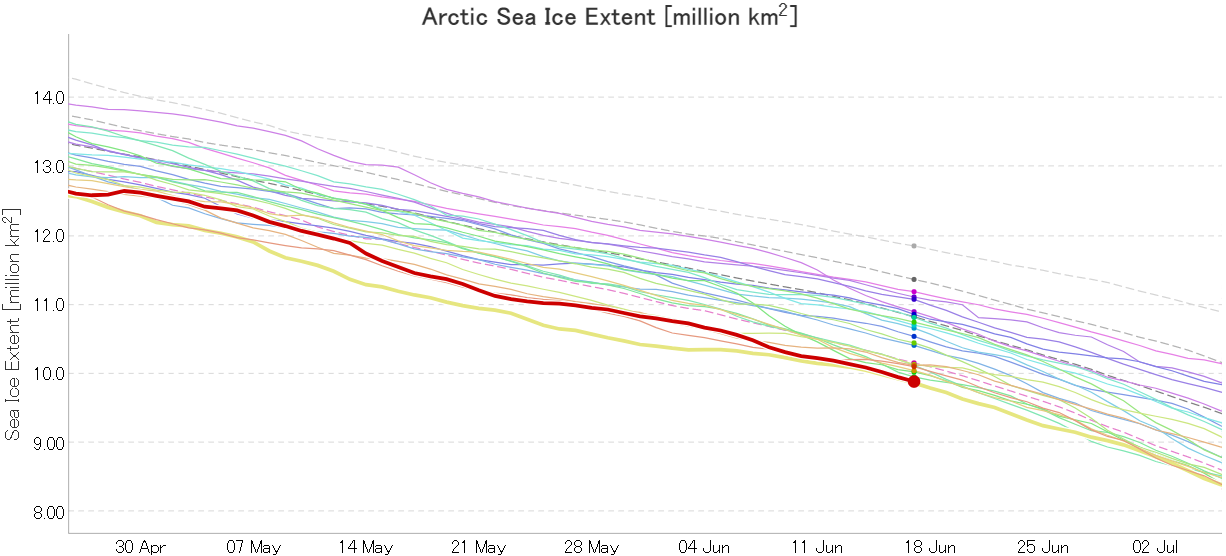
In addition JAXA extent is now in a “statistical tie” with 2019 in the “lowest for the date” competition:
Watch this space!
Man this year just keeps throwing sinkers!
https://www.accuweather.com/en/weather-news/zombie-fires-erupt-in-arctic/749130
…and this:
https://www.themoscowtimes.com/2020/06/03/russias-2020-wildfires-cover-greece-sized-area-greenpeace-a7046
https://siberiantimes.com/other/others/news/state-of-emergency-in-norilsk-after-20000-tons-of-diesel-leaks-into-arctic-river-system/
Well, PIOMAS is out for May. Not a lot of ‘fodder for the faithful, I’m afraid. It’s a shame that starting the trends in 1979 (driven by technology, not by reason) has misled so many for so long.
Hello again Taylor,
You must have been typing your comment as I was preparing my update above?
Can I safely assume that in your view my “the Northern Sea Route is going to be open early in 2020” and Shawn’s Siberian news doesn’t count as “fodder for the faithful”?
Yes, Jim,
I read the same PIOMAS report that you quoted above. My point is that there has been significant recovery in the past few years, and in fact, trends are essentially flat over the past 10 years in most of their monthly trend graphs. Russian icebreakers and hardened tankers are punching through to areas of open water along the Siberian coast, but there’s still 3 meters of ice in key parts of the northwest passage, so we’ll see how that season goes.
As our friends at NSIDC demonstrate, it’s always possible to find support for your cause somewhere in the Arctic, while ignoring what doesn’t fit the narrative.
And “skeptics” can of course “always find support for [their] cause somewhere in the Arctic”!
The Canadian Arctic Archipelago has certainly had a chillier winter than many of late. Where’s your evidence for your “3 meters of ice” assertion hiding?
Not here!
I was referring to an area just southwest of the Bellot Strait. DMI currently has it at 3-3.5 meters in places. Your map has portions at 2.5 and above, so I guess it depends on who you believe.
https://www.scientificamerican.com/article/high-temperatures-set-off-major-greenland-ice-melt-again/
Yup. See: http://nsidc.org/greenland-today/
Sorry, Shawn,
I think your posting of the Scientific American article was perhaps a bit premature. Without getting into what a sad shadow of it’s former self is that once great journal, I note with interest that DMI now has 80 degree north temps back to normal, and after some near record-setting snow accumulations (for the date), Greenland mass balance is at its highest point for the year. It could all change tomorrow, of course, but I always get a chuckle when the clueless alarmist press goes ‘own goal’ within days of publication.
Whilst I agree with your point about the decline of Scientific American I’ll take issue with your other ones.
DMI temps are heavily weighted towards the North Pole, which is pretty much irrelevant this early in the melting season.
In addition, here’s the current NSIDC Greenland surface melt plot:
Jim, I agree that melt was up, but now snowfall is back up and surface mass balance is accelerating. So net, net, as they say, more piling up than melting, at least for now. That was my point, as soon as you try to put a stake into Greenland and call it over, the more likely Nature will arise and ruin the narrative. Call me when somebody can predict SMB for Greenland 6 months in advance, let alone several years
Nothing to be sorry for, I would like to note that most of Greenland lies south of 80 degrees. This area of Siberia is forecast to have temps in the low 30’s C in the coming days. Note the fires:
https://worldview.earthdata.nasa.gov/?v=-1532461.51305361,1834499.4885624507,167967.34250725538,2664106.6862715827&p=arctic
Shawn,
I believe the thread above started with your post about melt conditions in Greenland, not a heat wave in Siberia. My response about DMI temps was only and example of the wide variability of the data. Jim supported your argument with a Greenland melt graph, which had spiked. To support my point on variability/unpredictability, I now point out that melt is back to “normal” (actually a bit below):
https://nsidc.org/greenland-today/images/greenland_daily_melt_plot.png
If you want to shift to Siberia, that’s fine, but I’d prefer to First here your comments on what happened to turn the narrative around on Greenland.
This is opinion only TP but watching the north closely for the past 6 years or so as a layman really, no scientific training, it would seem the polar vortex is trying to circulate around the coldest spot in the arctic. That being the Greenland ice sheet and the what’s left of the multi year ice packed up against Canadian Archipelago. I think this cold centre is its own weather maker and is promoting its own cold spells. Where in northern Asia and Europe there isn’t a large thick block of extremely cold ice, hence the inflow of continental heat as there is nothing to counter it. Even the ice in the ESS and elsewhere on that side of the arctic ocean is thin first year ice. Thin by arctic standards :). The melt water from the Greenland ice sheet is also noticeable in the north Atlantic as well as the Labrador sea as a cold blob against the background warmth anomalies of the ocean beyond. Again all working to help push the intrusive continental heat south. Thankfully I might add. I may well be completely out to lunch with this hunch, however a new cold pole does seem in the making, at least until the glacial ice is greatly reduced in area and volume.
Apologies to our regular reader(s).
We’ve been “hacked”!
Normal service will be resumed shortly.
How’s it going Jim and company? I was wondering why the Lincoln Sea ice is not officially measured? Is it considered less important somehow…?
You’ve lost me slightly SML.
Do you mean why isn’t the Lincoln Sea identified as a separate region by the NSIDC, in the same way as the Barents and Greenland Seas?
In which case you could ask much the same question about the Wandel Sea, and the answer is they are both considered to be part of the Central Arctic Basin.