Regular readers will no doubt recall that I have previously been “banned” on trumped up charges at the “Watts Up With That” blog. It thus came as a pleasant surprise when I recently popped back there and tried to pass comment on a “reprint” of an article by Professor Byron Sharp in Medium entitled “How I changed my mind… about global warming“:
Most, if not all, people would consider themselves to be open-minded. Yet, if you ask someone to name an important belief that they have changed their mind about, in response to evidence and/or logic, most struggle to give even one example.
This is the first in a series of blogs where I describe how and why I changed my mind about something. I hope to encourage myself to change my mind more often. And to encourage others.
Short summary: I now worry less about global warming than I did, the scientific evidence is that it’s not going to be catastrophic. PS Our best course of action is to adapt to the effects and to invest in R&D to develop new low carbon energy.
My initial comments survived the onerous WUWT moderation process and several of them were published without undue delay. The gist of my argument was quite simple:
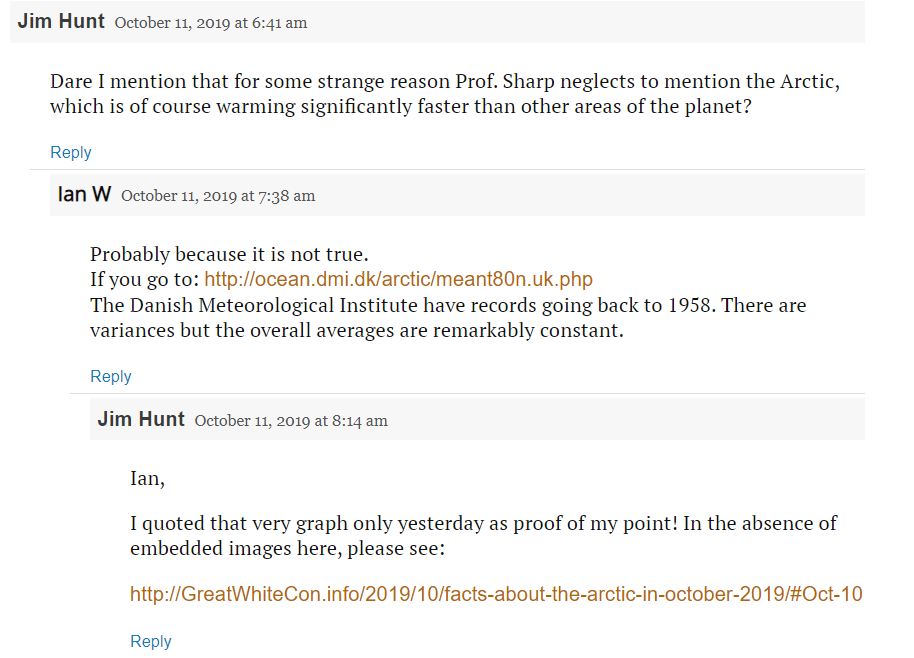
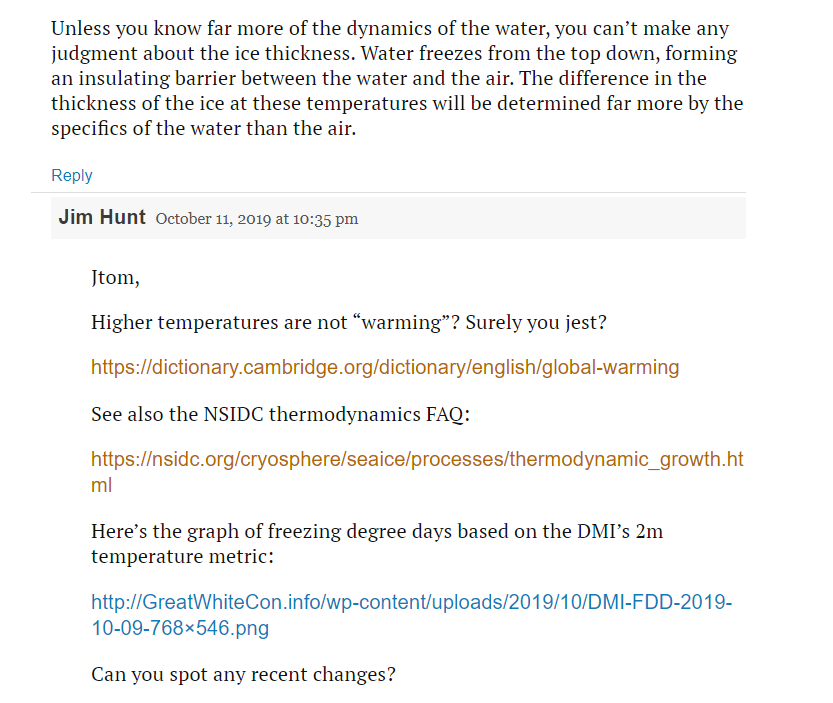
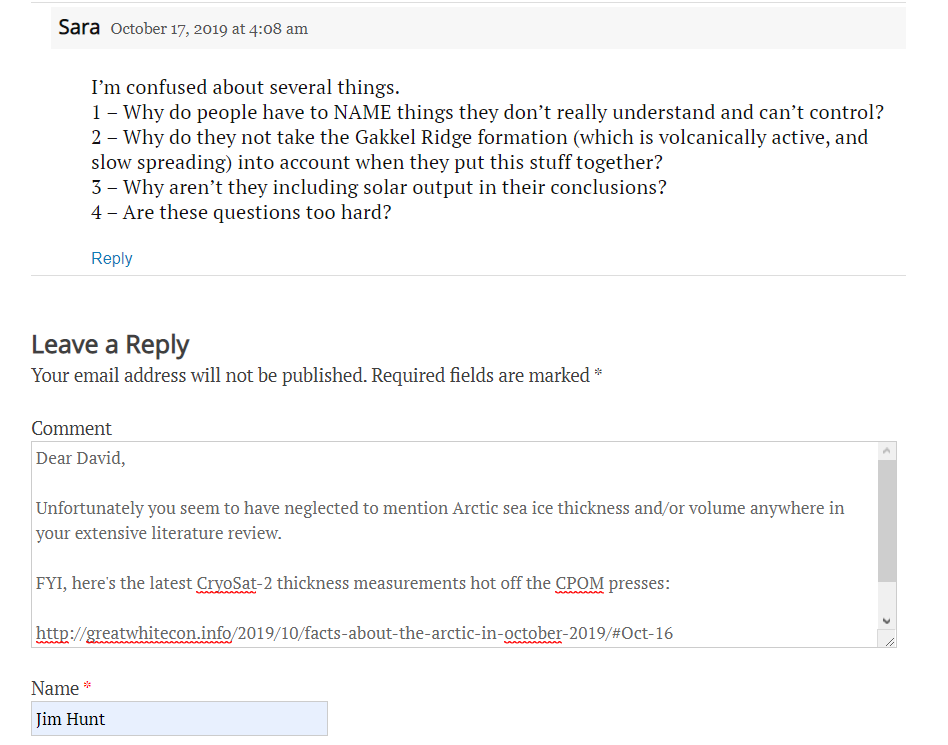
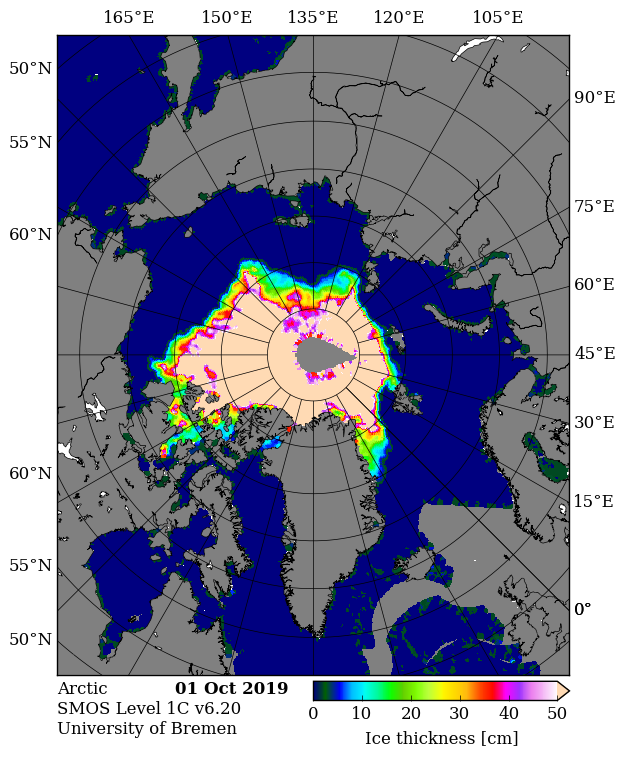
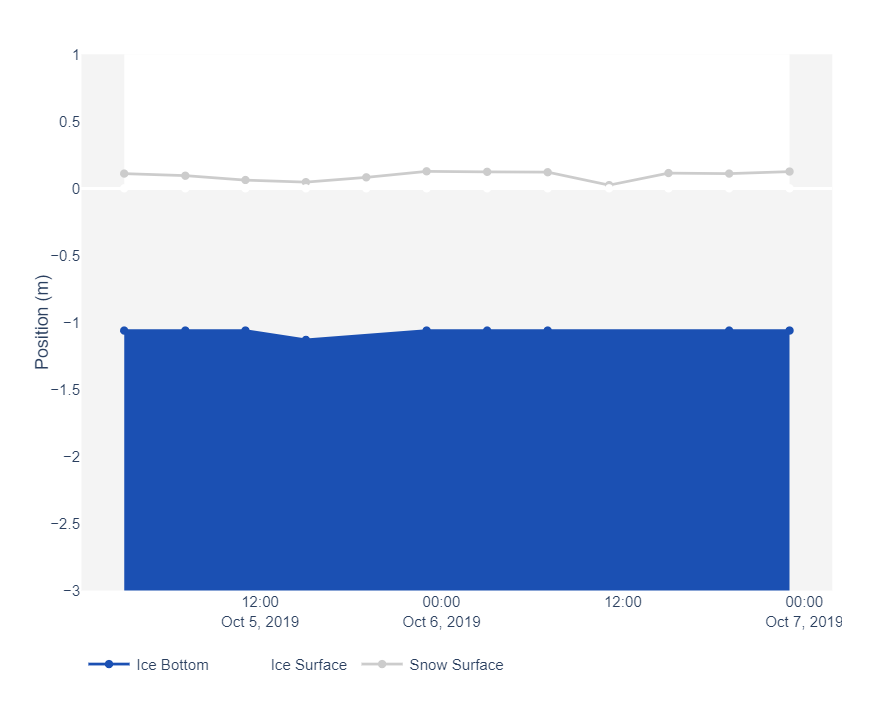
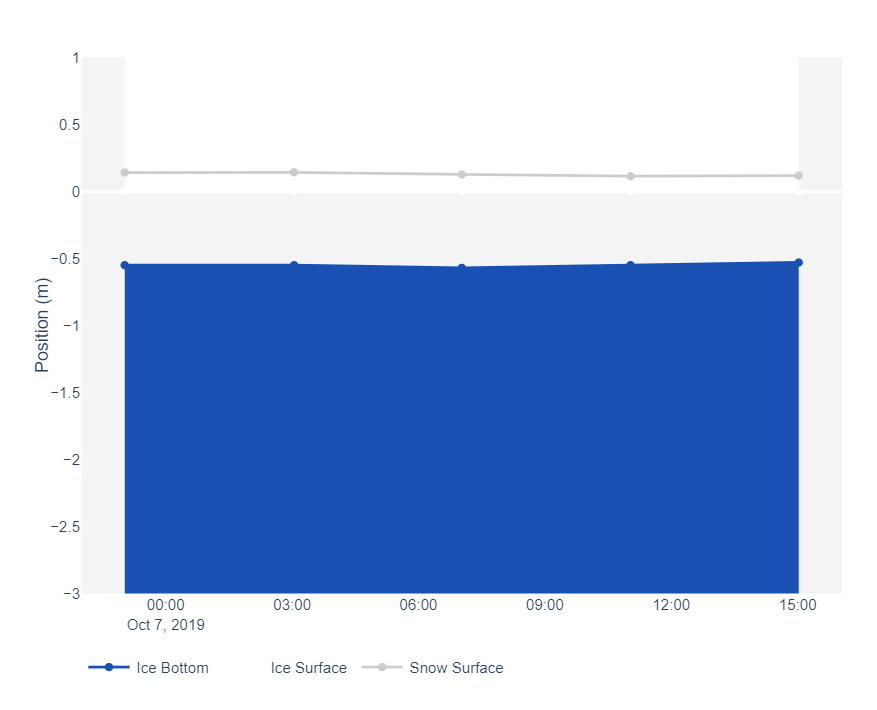
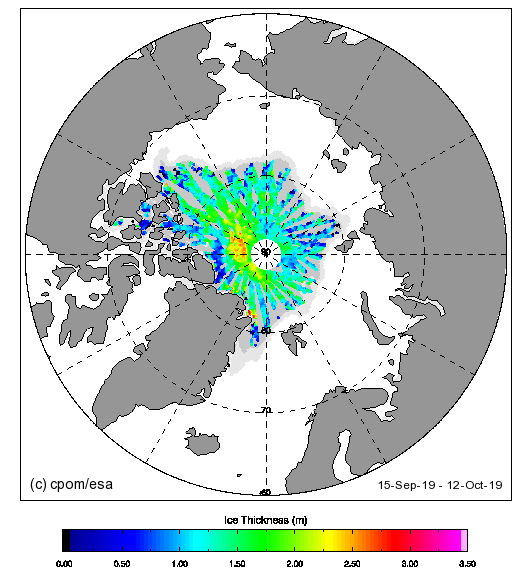
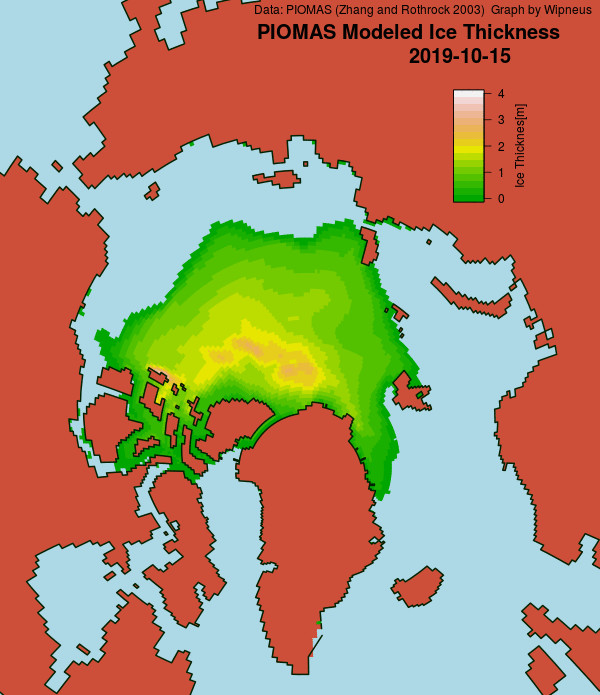
I even managed to comment when somebody introduced the word “thickness” into the discussion:
Needless to say my good fortune couldn’t last forever, and eventually Anthony himself was on my case:
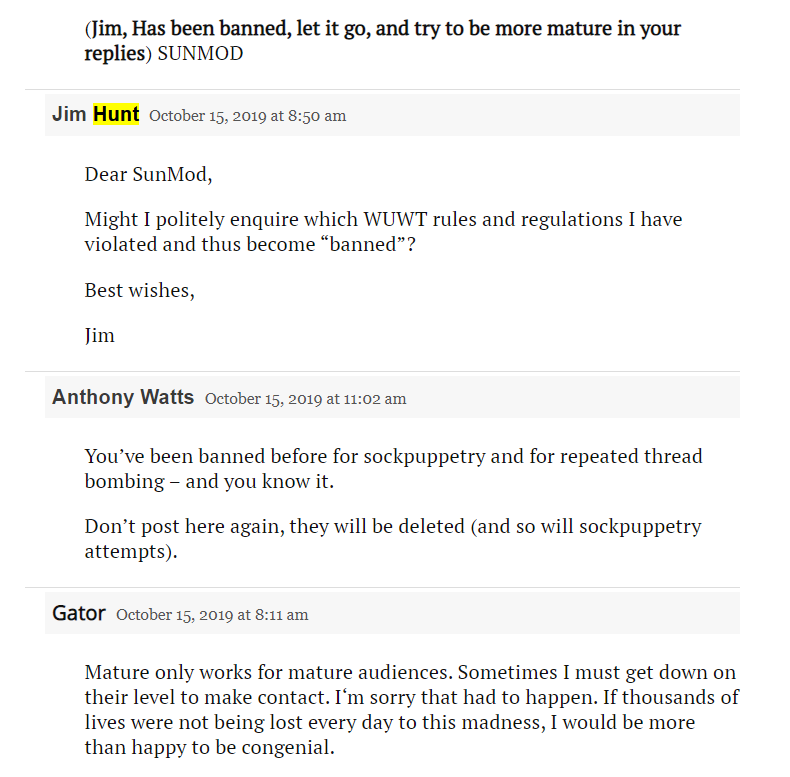
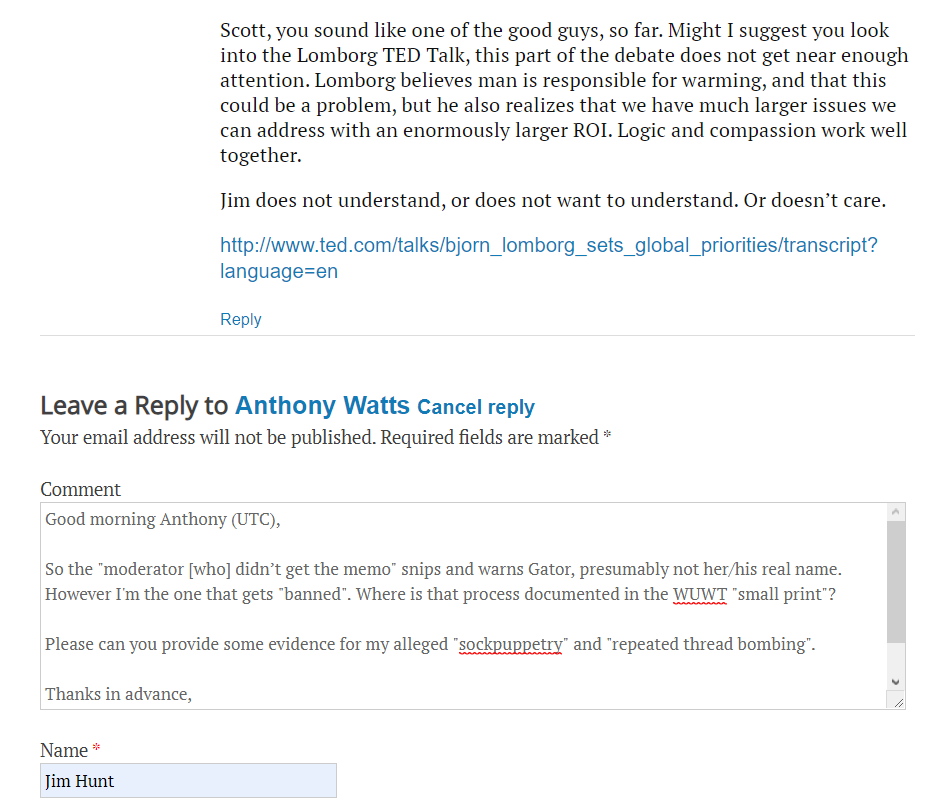
My request for an explanation has thus far been ignored:
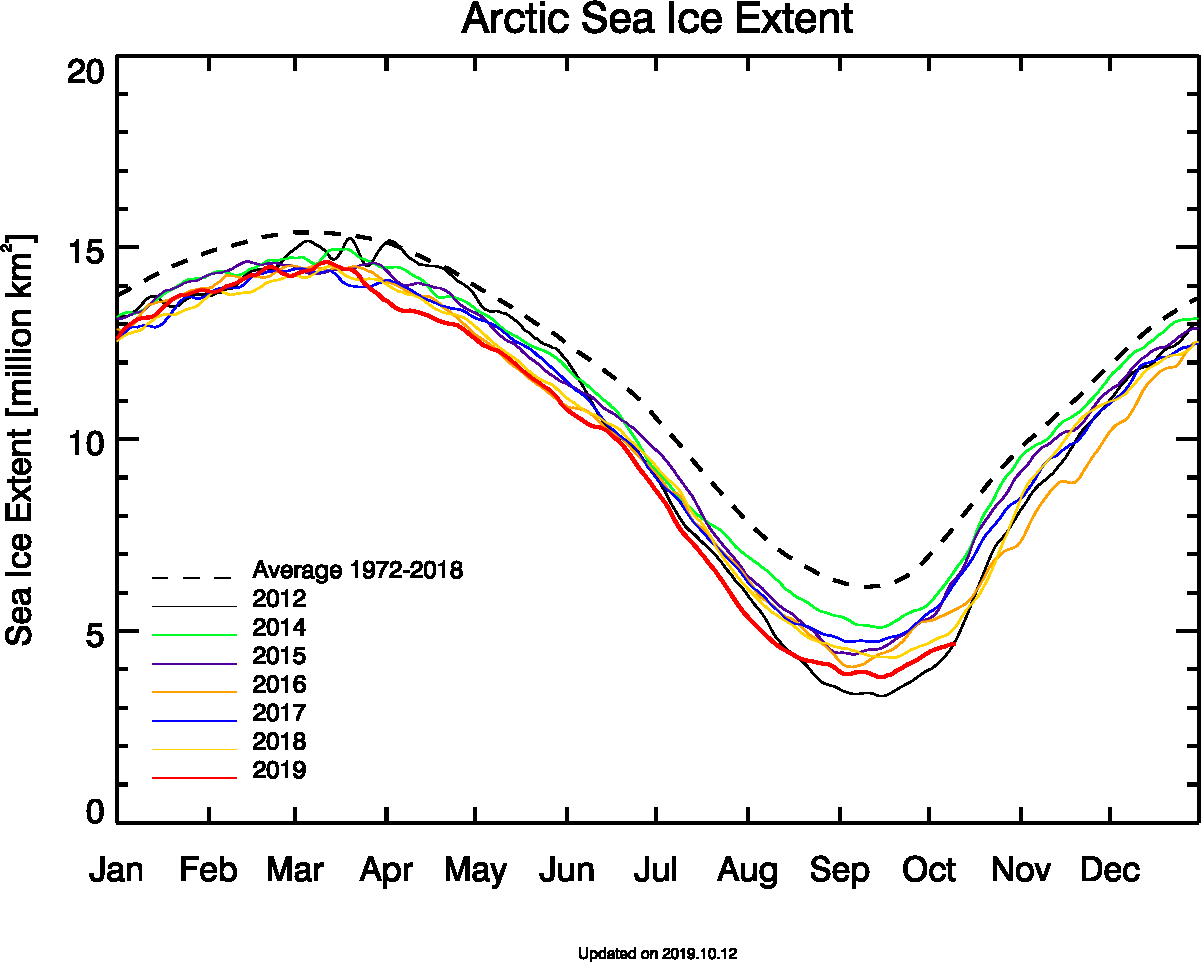
How “unfortunate” it is then, that a couple of days after my “banning” on yet more trumped up charges WUWT published an article by David Middleton entitled “Back to the Anthropocene! Arctic Sea Ice Edition”, telling a familiar tale:
Two key takeaways:
- Maximum Holocene sea ice extent occurred within the past 500-1,000 years at every location.
- The current sea ice extent is higher at all of the locations than over 50% to 85% of the Holocene.
A significant reduction in Arctic summer sea ice relative to today, would be returning to Early Holocene conditions. If we currently have an “Anthropocene in the Arctic,” it’s actually icier than most of the Holocene’s “Goldilocks conditions.”
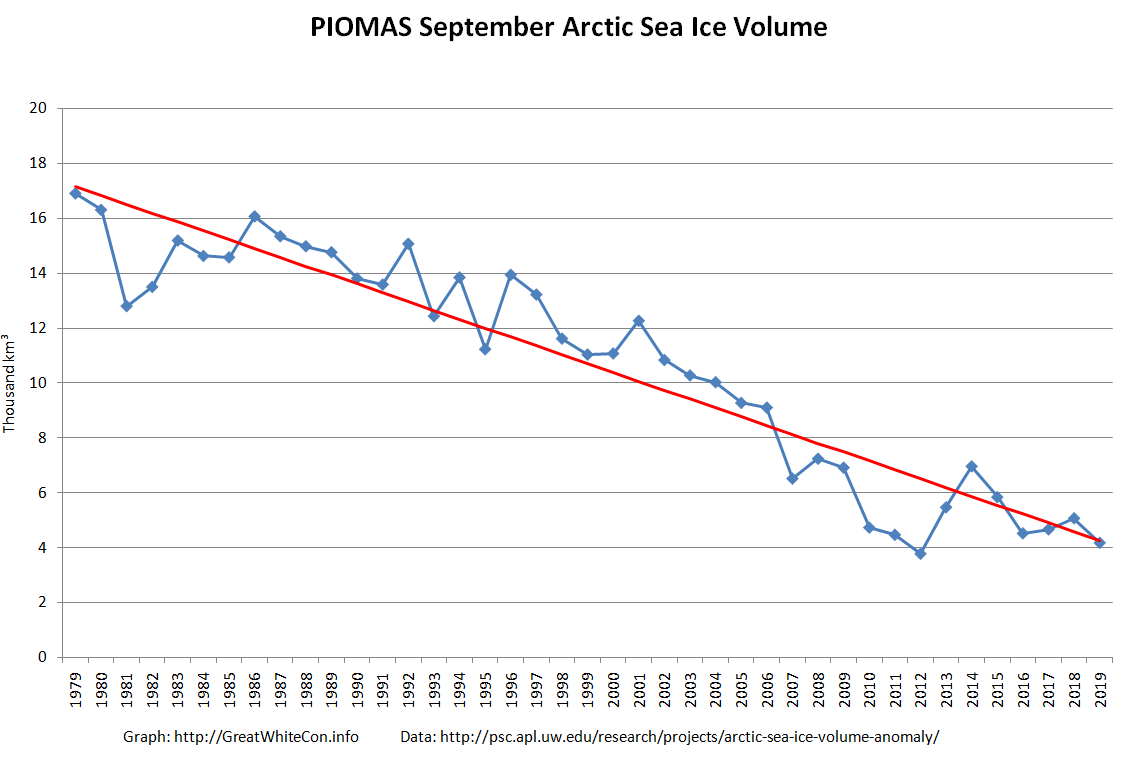
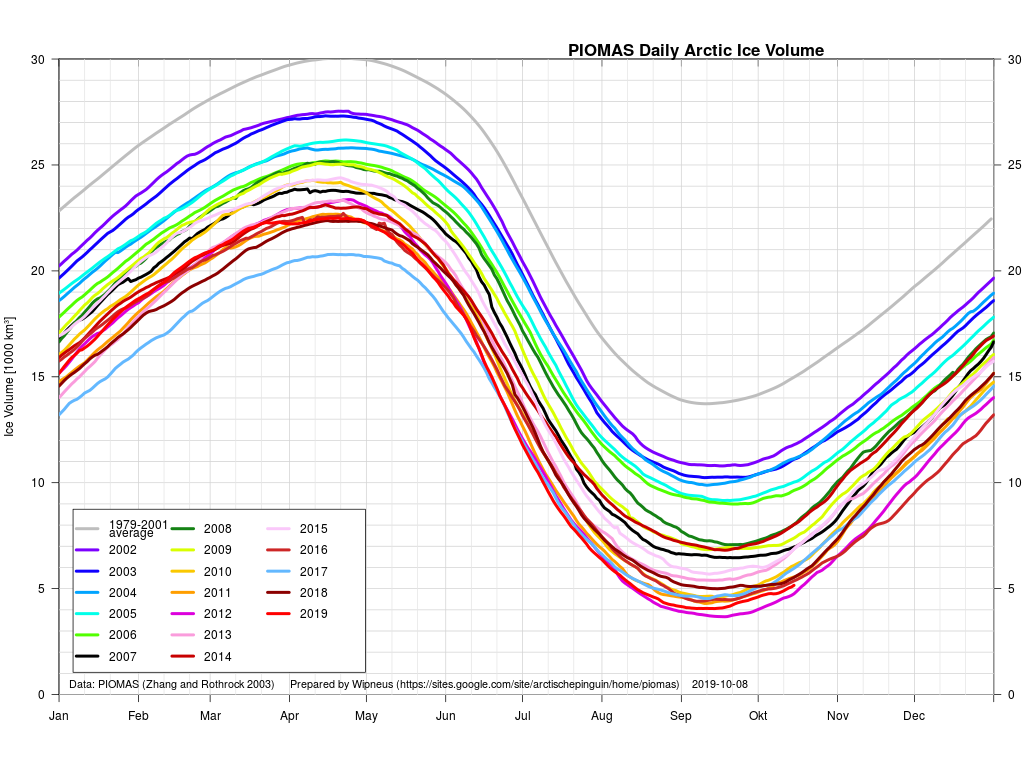
David’s article once again neglected to mention Arctic sea ice thickness and/or volume. My plaintive cries were made in vain:
Amongst other things my recent “banning” from Watts Up With That means I am unable to ask David the same question my Arctic alter ego “Snow White” recently put to Down Under’s favourite skeptical senator, Malcolm Roberts:
What were the sea levels in London like at the time @MRobertsQLD? Or Miami, or Manhattan, or Dhaka?
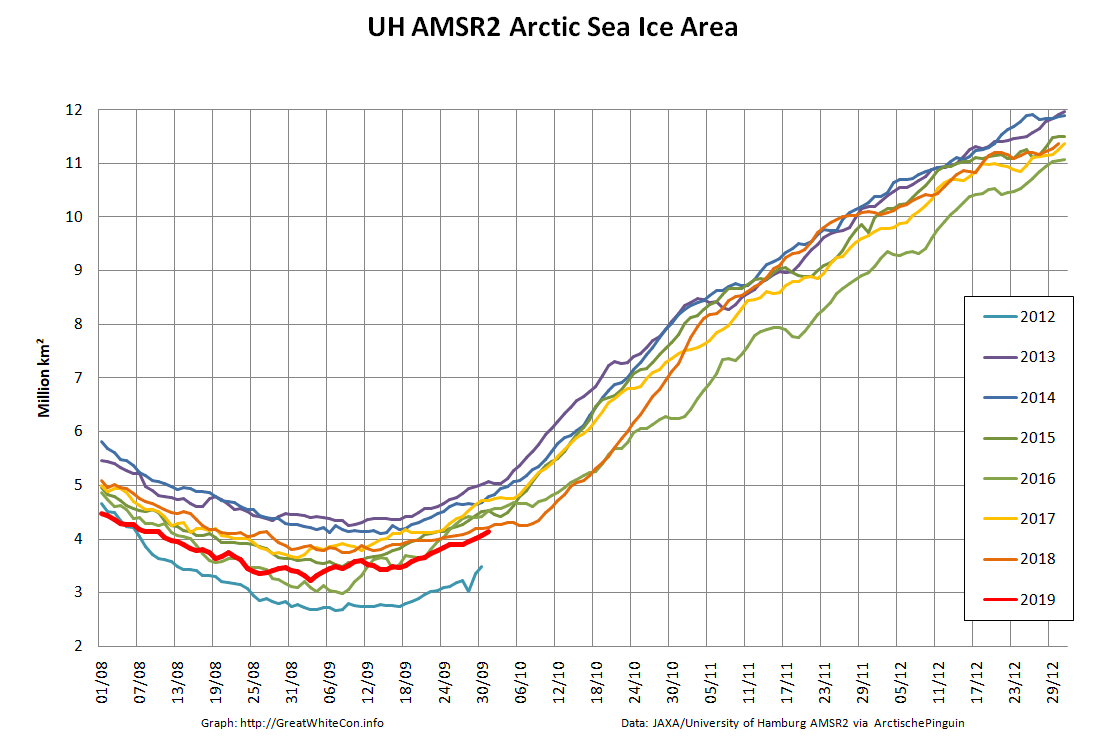
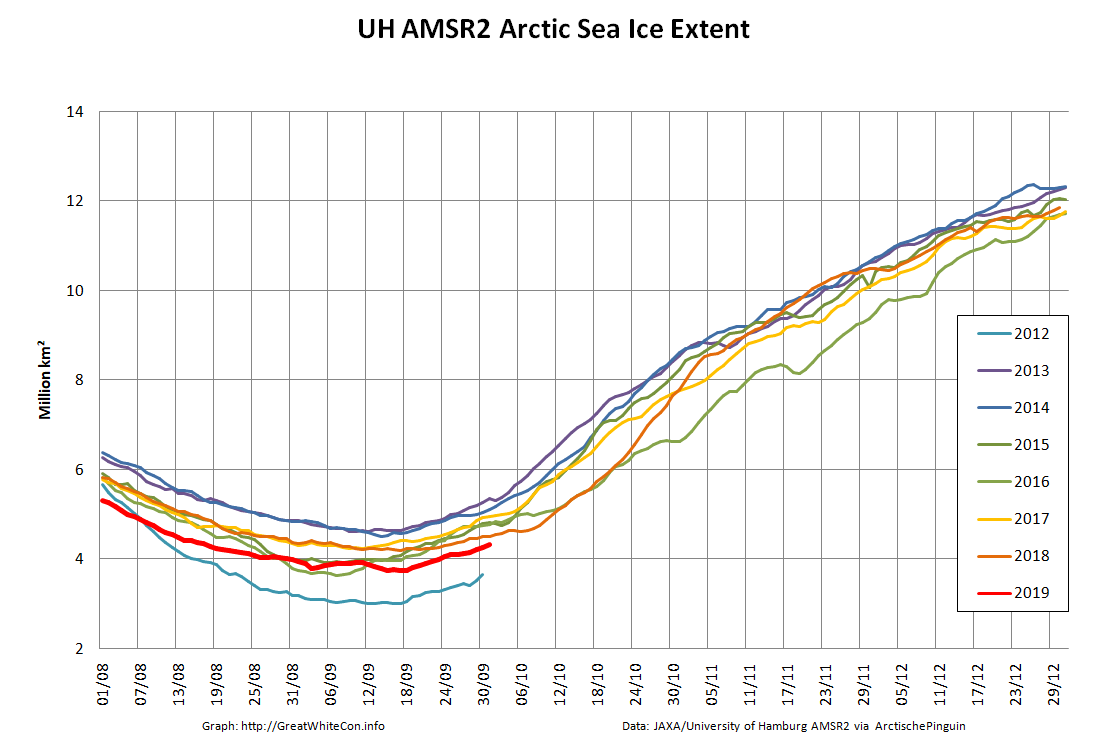
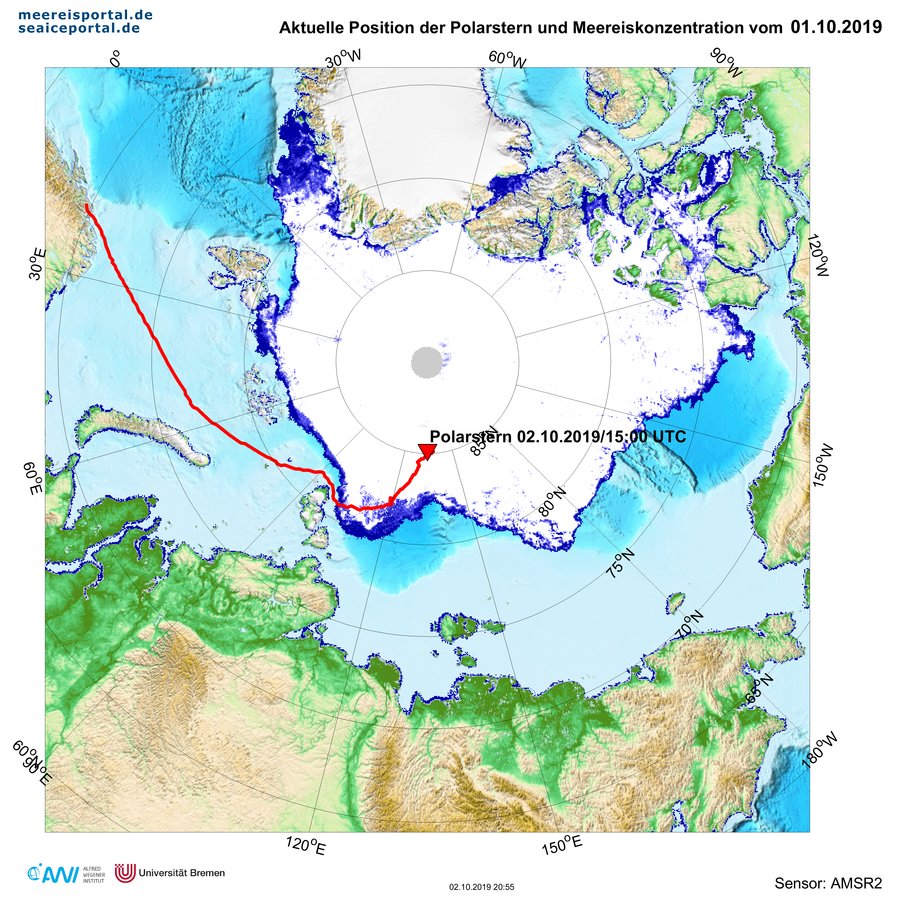
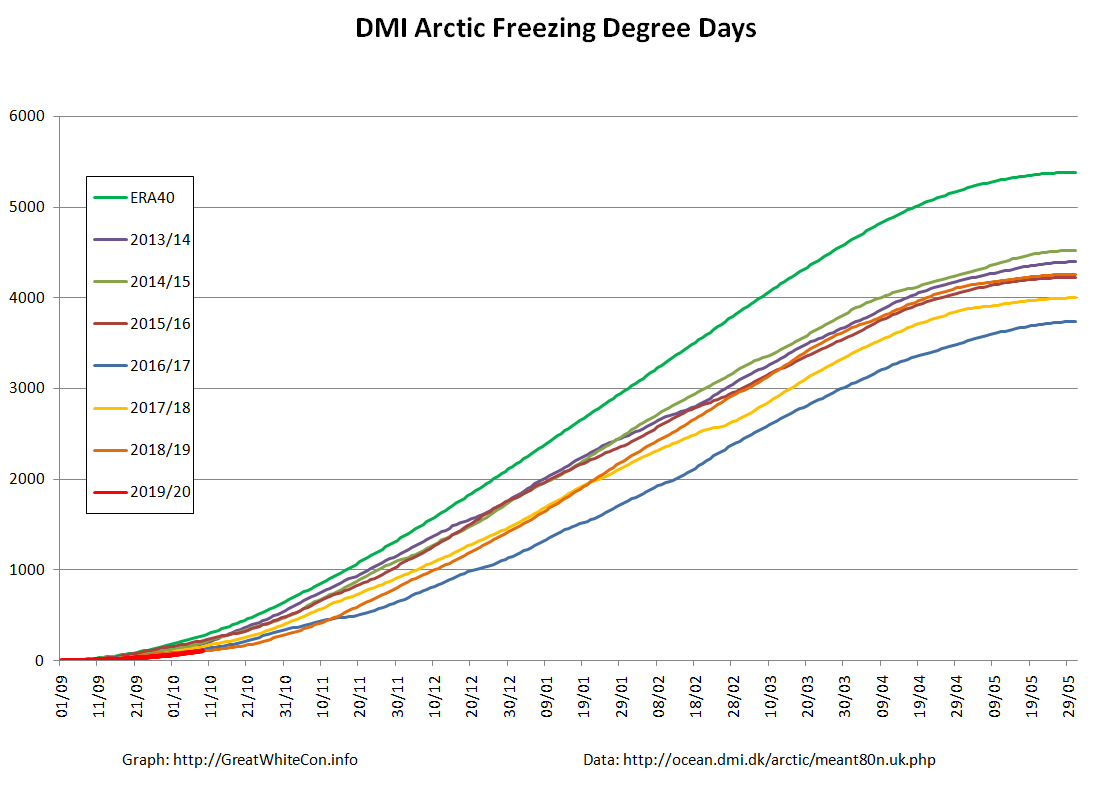
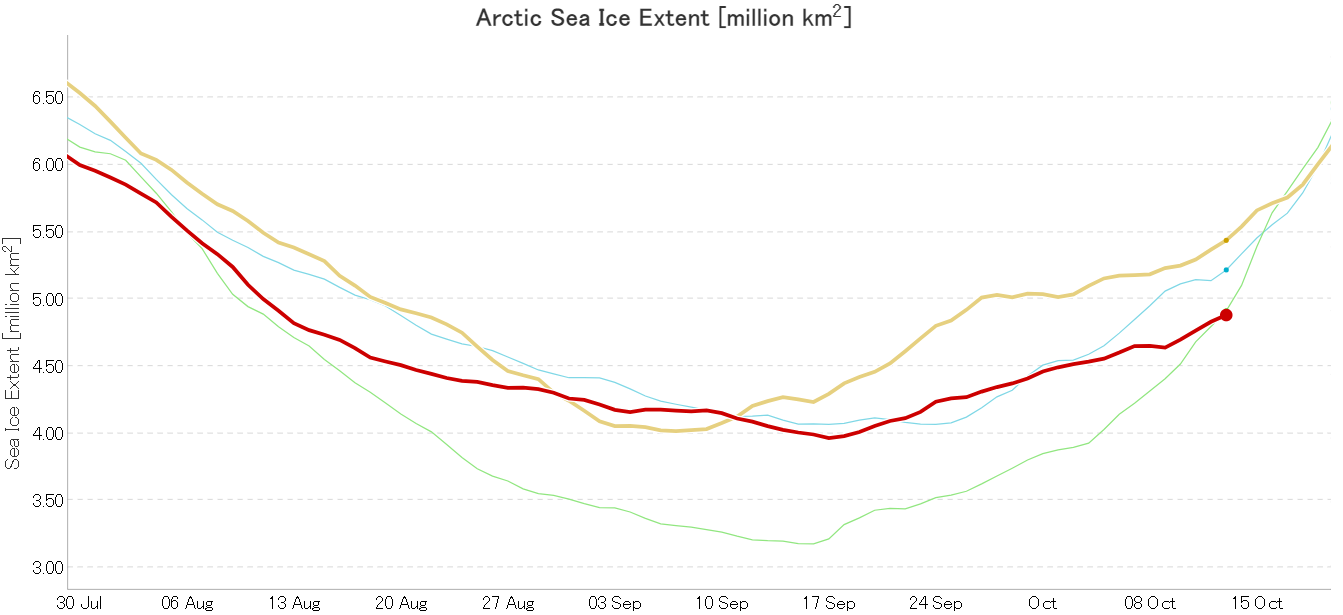
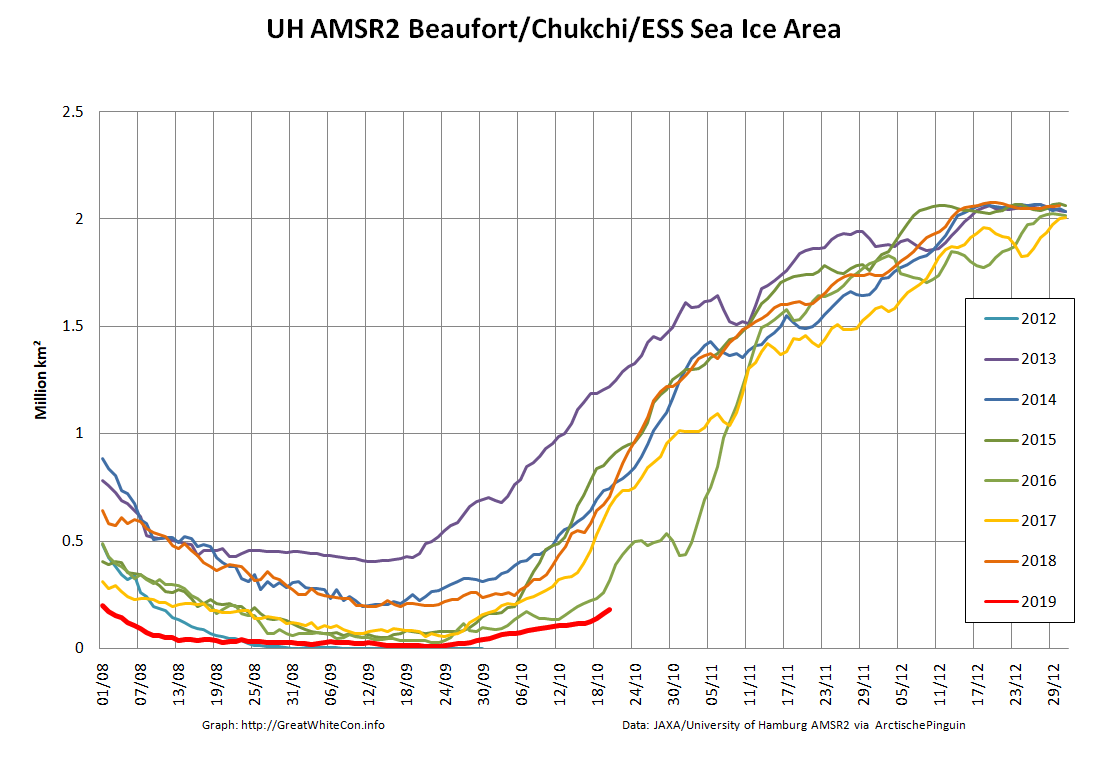
Meanwhile in the present day #Arctic old #SeaIce is disappearing:https://t.co/8SiCDnZw7Y
Keep a close eye on the red stuff.
— Snow White (@GreatWhiteCon) September 26, 2019
Malcolm hasn’t bothered to answer as yet.
Quod Erat Demonstrandum?


