Monthly Archives: May 2019

An Inconvenient Truth About Polar Ice Melt

The celebrated web site of our old friend Anthony Watts published an article yesterday entitled “The polar ice melt myth“. As a self styled expert on that particular topic I popped over there expectantly, only to discover that it is an actual fact a cut ‘n’ paste of an April 30th article by Dr. Jay Lehr at CFACT. Part of that article reads as follows:

Al Gore predicted in 2007 that by 2013 the Arctic Ocean would be completely ice free. In the summer of 2012 ice levels did reach all time lows in the Arctic. Emboldened by this report Australian Professor Chris Turney launched an expedition in December of 2013 to prove that the Antarctic Sea Ice was also undergoing catastrophic melting only to have his ship trapped in sea ice such that it could not even be rescued by modern ice-breakers.

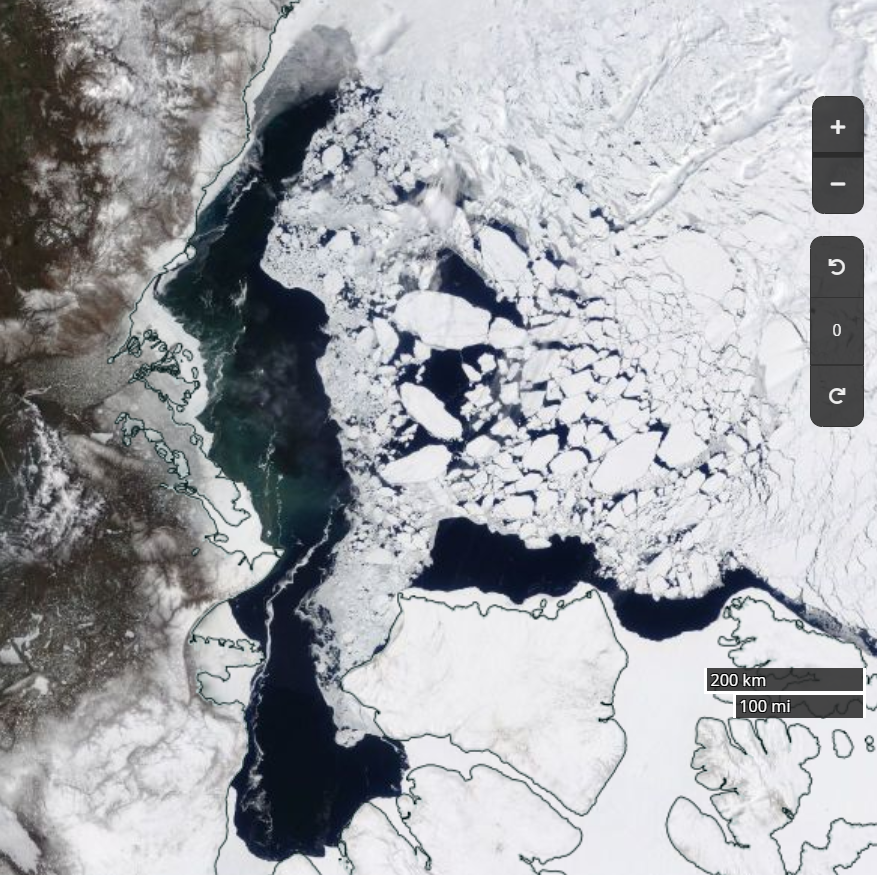
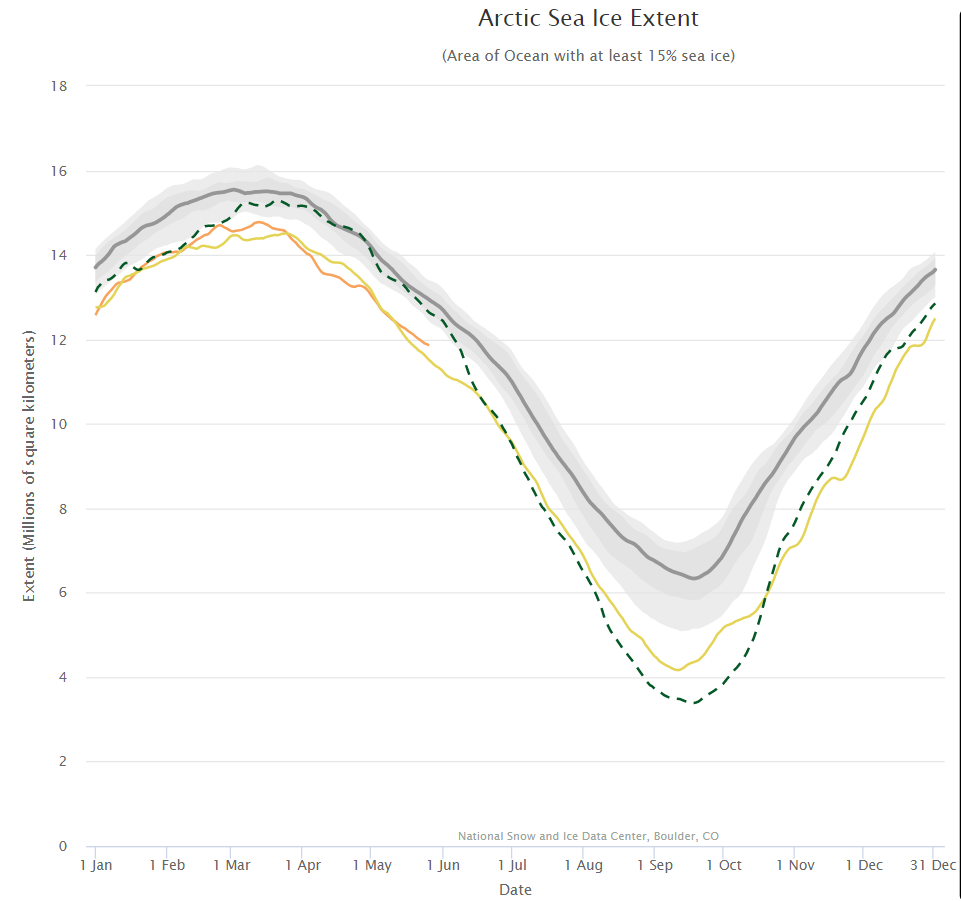
The Professor should have known that a more accurate estimate of sea ice can be had from satellite images taken every day at the Poles since 1981. These images show that between summer and winter, regardless of the degree of summer melting, the sea ice completely recovers to its original size the winter before for almost every year since the pictures were taken. The sea ice has been stubbornly resistant to Al Gore’s predictions. In fact the average annual coverage of sea ice has been essentially the same since satellite observations began in 1981. However that has not stopped global warming advocates and even government agencies from cherry picking the data to mislead the public.

I also like to think that I’m something of an expert on the way “skeptical” folks cherry pick the data to mislead the public. For example I once wrote a post about David Rose‘s Mail on Sunday article concerning  Al Gore’s interpretation of Prof. Wieslaw Maslowski’s research into Arctic sea ice decline. Hence I felt compelled to comment on this most recent of misleadling WUWT articles about polar ice!

As luck would have it Guy McPherson recently interviewed Wieslaw about events back in 2007 and his more recent research on Arctic sea ice melt. Here is a video recording of their conversation:

I endeavoured to bring this most relevant piece of information to the attention of Anthony’s loyal readership last night (UTC) as follows:

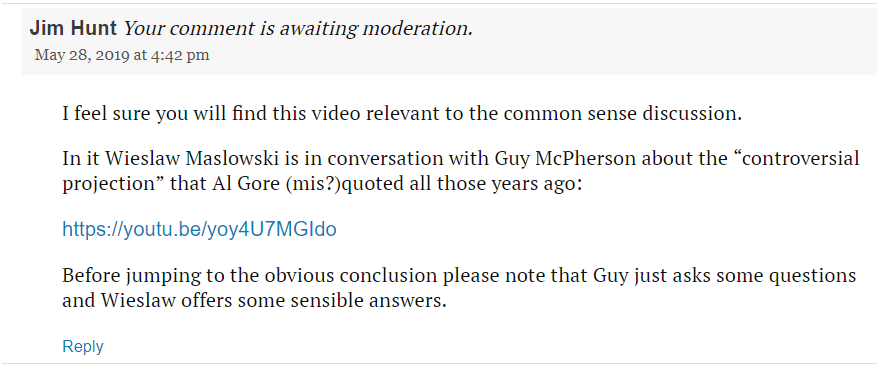
This morning my pertinent comment is still “awaiting moderation”.

Q.E.D?

Melt Pond May 2019

A couple of years ago I was asked to provide “a handful of things [you] will be keeping an eye on over the next few months to judge how ‘good’ or ‘bad’ the melt is going?”

My answer was, and remains:

5 fingers worth to start with? Not necessarily in order of time or importance!

1. How soon melt ponds and/or open water hang around in the Beaufort Sea this year. Things started very early [in 2016]:

https://GreatWhiteCon.info/2016/04/the-beaufort-gyre-goes-into-overdrive/

2. Ditto the Bering Strait and Chukchi Sea

3. Ditto the Laptev and East Siberian Seas

4. How many (and how deep, warm, wet) spring cyclones spin around the Arctic Ocean

5. How the snow melt progresses across Canada, Alaska and Siberia

Applying the same criteria this year, open water is already hanging around in the Beaufort Sea, as well as the Amundsen Gulf:

NASA Worldview “true-color” image of the Beaufort Sea on May 21st 2019, derived from the MODIS sensor on the Terra satellite

What’s more a cyclone is currently spinning in the area too:

With those prerequisites in place, how about my other criteria? Here’s the current northern hemisphere snow cover graph:

That suggests snow cover over land is close to recent lows, which is confirmed by the Rutgers University snow cover anomaly graph for April:

This year is anomalously low, but not by as much as 2012 and 2016. For completeness, here also is the current US National Ice Center snow cover map:

Moving on to melt ponds, there are plenty to be seen on the fast ice around the Mackenzie river delta:

NASA Worldview “false-color” image of the Mackenzie Delta on May 24th 2019, derived from the MODIS sensor on the Terra satellite

There also seem to be signs of some at a higher latitude off Ostrov Kotelny in the New Siberian Islands:

NASA Worldview “false-color” image of the Laptev Sea on May 23rd 2019, derived from the MODIS sensor on the Terra satellite

This year there is also a lot of open water in the Chukchi Sea, and almost no sea ice left in the Bering Sea:

Compared with 2016 at the same time of year I am compelled to say that with June 1st just around the corner the 2019 summer melting season is primed to progress more quickly.

The next obvious comparison to make is with the (in)famous year of 2012, which resulted in the lowest ever minimum extent in the satellite record. Firstly let’s look at the National Snow and Ice Data Center’s graph of Arctic sea ice extent:

Currently extent is significantly below 2012, albeit somewhat above 2016 at the same time of year. And what of melt ponds? In 2012 there was evidence of less snow cover over land and more surface water on the ice on the Siberian side of the Arctic:

NASA Worldview “false-color” image of the Eastern Arctic on May 25th 2012, derived from the MODIS sensor on the Terra satellite

Other than that Arctic sea ice in 2019 looks to be in worse shape than in 2012.

[Edit – May 27th]

We’ve established that the extent of Arctic sea ice at the end of May 2019 is less than in 2012, but something else to consider is whether that ice is currently thicker than in 2012, or not. Satellites can have a reasonable stab at measuring the area of sea ice, but the third dimension is much trickier. The European Space Agency’s CryoSat-2 satellite has been attempting to measure sea ice thickness since 2010, so let’s take at the conclusions it has reached:

Don’t forget to take a good long look at the associated uncertainties too:

Watch this space!

The Northwest Passage in 2019

It is perhaps rather early to start speculating about if, and when, the Northwest Passage will become navigable for the host of small vessels eager to traverse it this summer.

However one such vessel is already en route to the Arctic Circle, so why don’t we take a look at its live tracking map?

Moli (Mo for short) is being piloted singlehandedly by Randall Reeves, who has already circumnavigated Antarctica and is hell bent on circumnavigating America too!

http://figure8voyage.com/blog

According to Randall’s last but one update he’ll be stopping in St. Johns before heading for the Arctic Circle:

“Have you explained why your first stop is St John’s?” asked a friend recently, “Not New York, Boston, Camden, Lunenberg, Halifax, to name just, well, five?”

It is a good question, and the answer is simple: I never considered going anywhere else because a) St John’s is decidedly on the Figure 8 route and b) it has the required marine facilities and big grocery stores. And did I mention, it’s right on the route?

Actually, I did flirt briefly with the idea of Boston, thinking that goods there would be cheaper and marine facilities, more diverse. And though it does save some 500 miles of sailing on this inbound leg, Boston is so far west that it adds 1,000 miles to the leg up to the Arctic. So, I’ve decided to stick to the most logical stop.

St. John’s is less than a thousand miles north now. In any worthy wind, we’d be there before the end of the month. But when your average speed is 3.9 knots…you don’t do the when-do-we-make-port math.

Interestingly the background to Moli’s live tracking map is from Windy.com.

[Edit – June 10th]

It’s very early in the melting season to be reporting on this event, but any early bird traversing the Northwest Passage from west to east could now sail through open water around Point Barrow, along the Alaskan and Canadian coast and into the Amundsen Gulf. Here’s the latest sea ice concentration chart for Alaskan waters from the US National Weather Service:

Whilst we’re here why don’t we take a look at how Randall is getting along in Moli. According to his latest blog post he is now in Halifax scraping barnacles off Moli’s bottom!

On Friday, June 8, day 245 of the Figure 8 Voyage, I hauled Mo here at the Royal Nova Scotia Yacht Squadron. My expectations were that the bum would be nearly spotless. Instead, we had a new crop of hitchhikers coming in at the base of those older barnacles that remained.

Lessons Learned:
“There is no good bottom paint for aluminum boats,” says my friend, fellow cruiser, and aluminum boat builder, Gerd Marggraff. Prior to departure, I had applied three generous coats of a bottom paint known specifically to ward off hard growth, but barnacles are superior beings, able to penetrate even the best defenses.

An early jump. I might have had an easier time of it if I’d dived the hull before the first Cape Horn rounding, when the barnacles were young and few.

In hindsight, I think I could have dived the hull with some success, even when the barnacles had matured into a reef. I found here in the yard that the “hold fast” (the glue that holds the barnacle fast to the hull) was easier to remove with a sharpened spatula than I had thought. It would have been a big job, taking a full day or more–but not impossible.

[Edit – June 15th]

Delving deeper into the Canadian Arctic Archipelago, the clouds have cleared over “Amundsen’s Route” through the Northwest Passage to reveal extensive melt ponding:

NASA Worldview “false-color” image of the Northwest Passage on June 14th 2019, derived from the MODIS sensor on the Terra satellite

Bellot Strait appears to be largely free of sea ice already:

[Edit – August 16th]

After a tense wait Bellot Strait has recently become blocked by 9/10 concentration sea ice but the southern route through the Northwest Passage via Peel Sound is now open to any vessel willing to cope with 6/10 concentration or less: