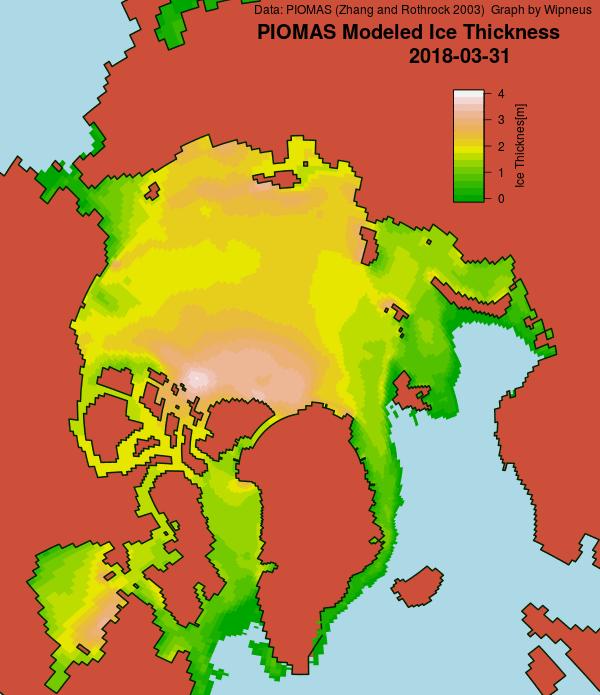
First of all Wipneus has been very quick off the mark this month with his PIOMAS gridded thickness map. Here is what it reveals for the last day of March:
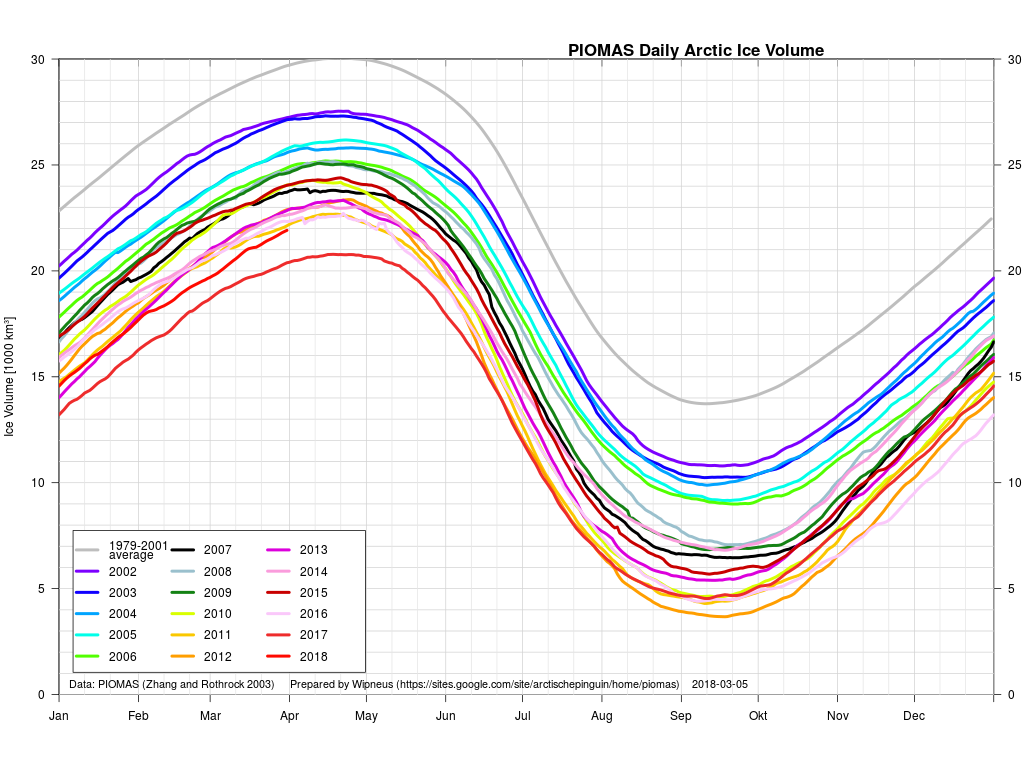
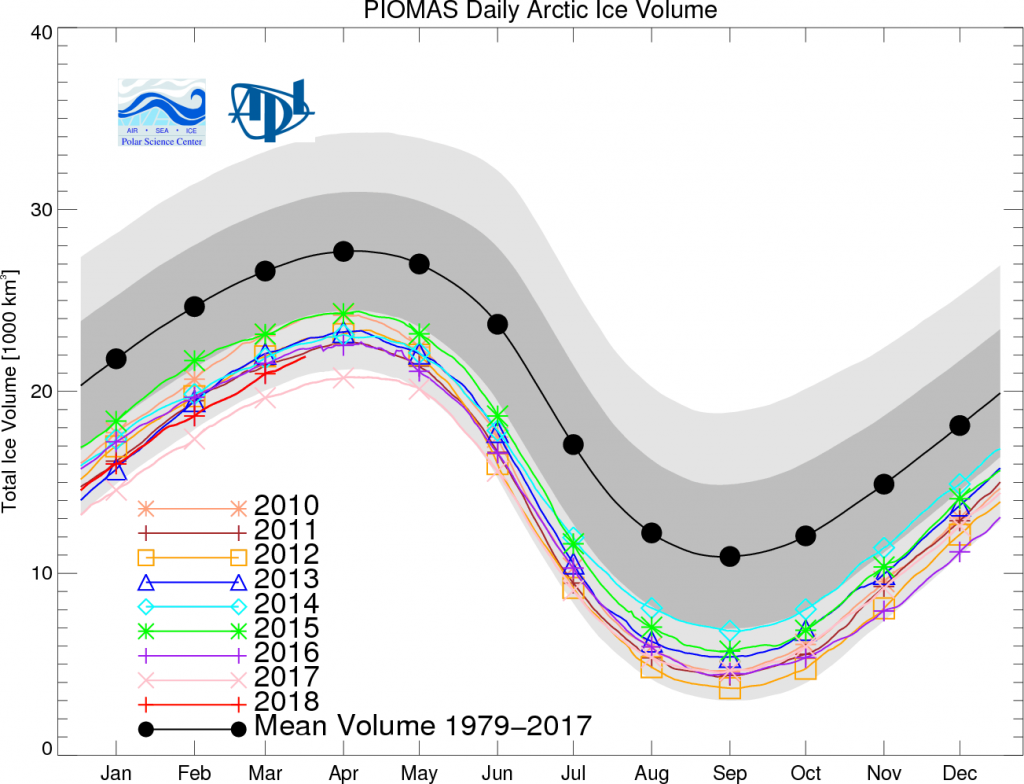
Here too is the latest PIOMAS volume graph:
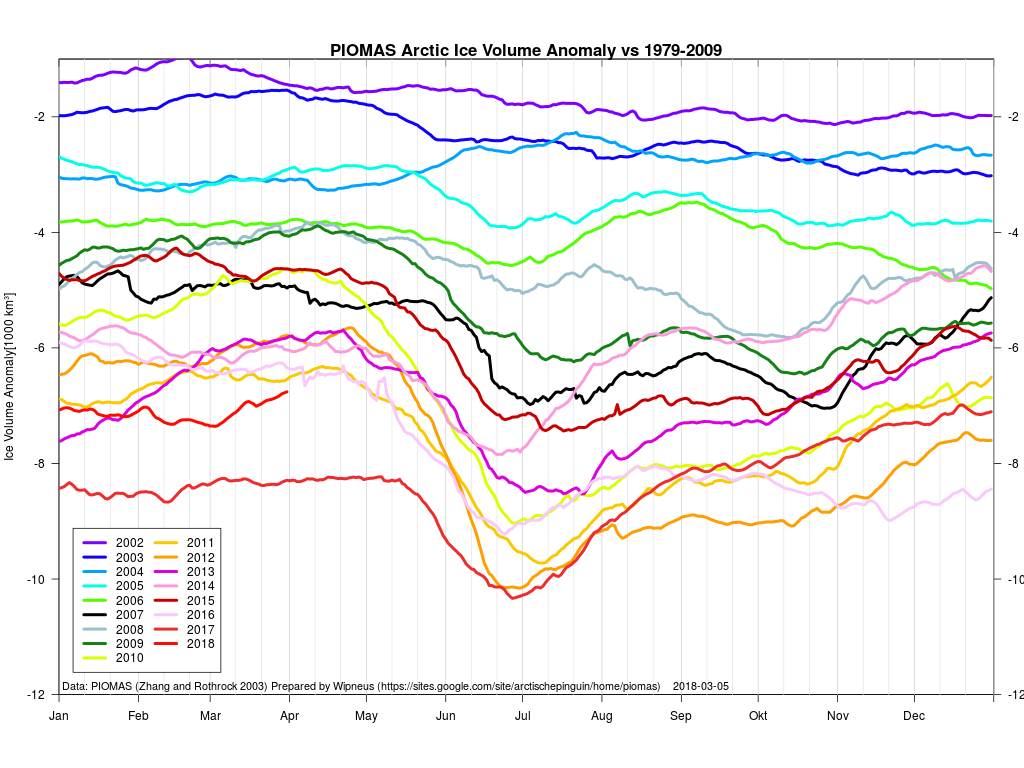
together with the associated anomaly graph:
They show 2018 still in second lowest position, albeit much closer to third place than last year’s line, which is currently leading the pack by a considerable margin.
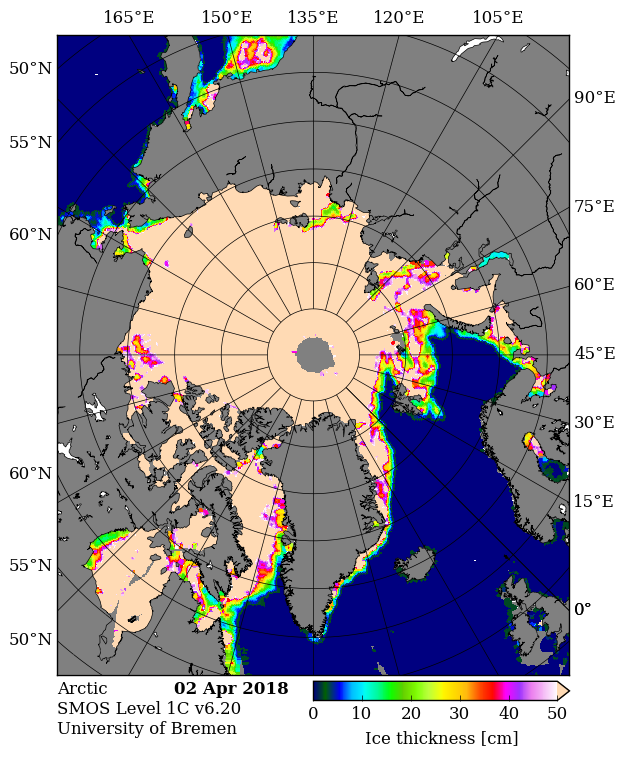
By way of comparison here are the current Arctic sea ice thickness maps from SMOS:
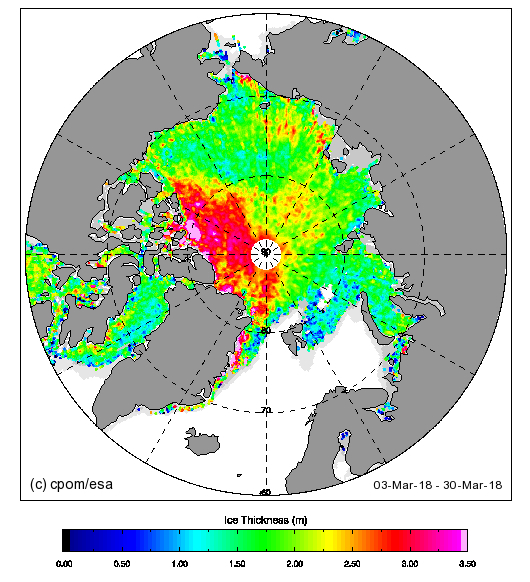
and CryoSat-2:
All eyes are still on the Bering and Chukchi Seas, where significant extent declines look likely over the coming days.
The official PIOMAS graph including March 2018 is now available:
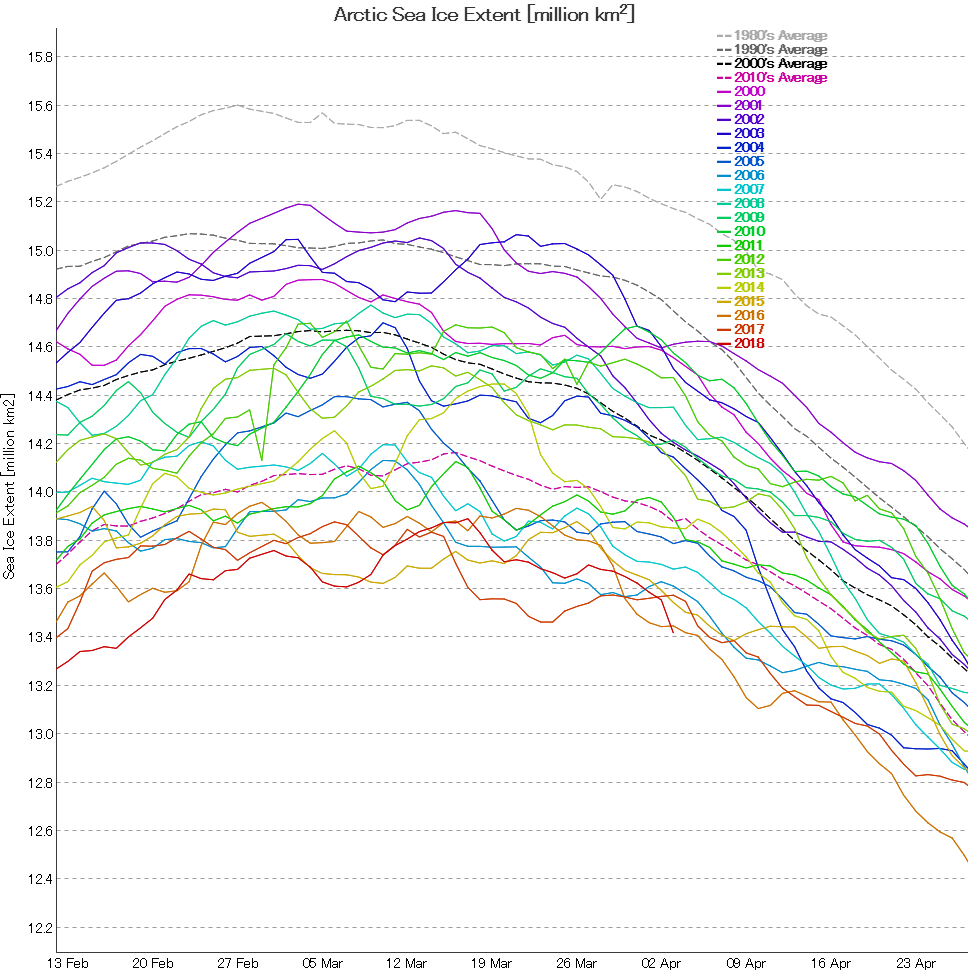
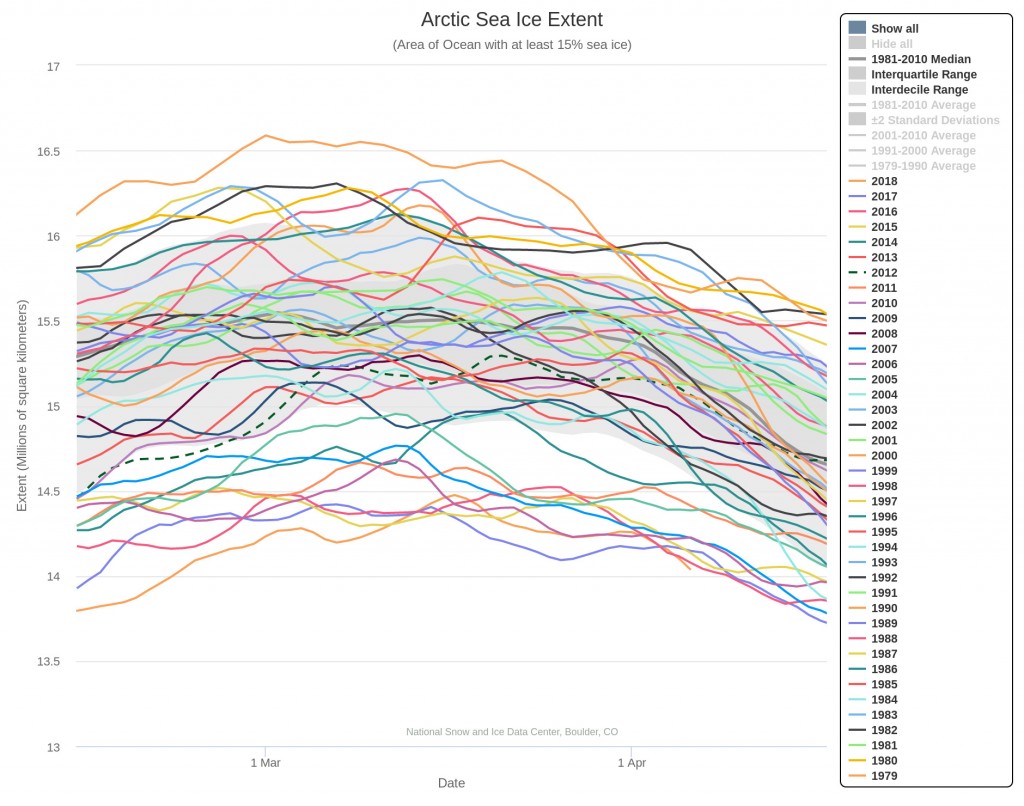
Meanwhile, according to NIPR/JAXA, Arctic sea ice extent is once again lowest for the date since their records began:
The NSIDC 5 day averaged extent is now in “lowest in our records” territory:
Meanwhile “JAXA” extent has just edged above 2016!
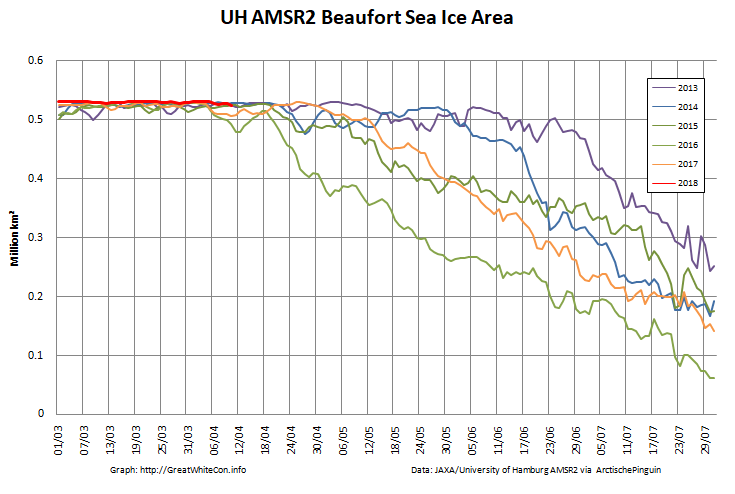
The focus has been on the Bering and Chukchi Seas until now. However there were clear skies over the Mackenzie Delta yesterday, revealing some open(ish) areas in the Beaufort Sea:
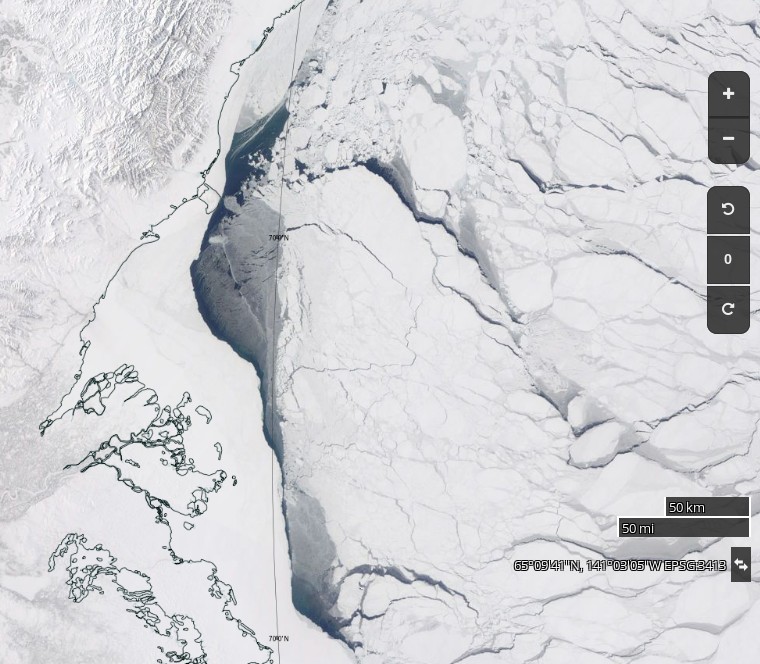
There’s only the merest hint of a blip on the area graph so far though:
It will be interesting to see if the decline in Beaufort Sea area continues from here, or whether this year’s “flatline” resumes and continues for a while longer.
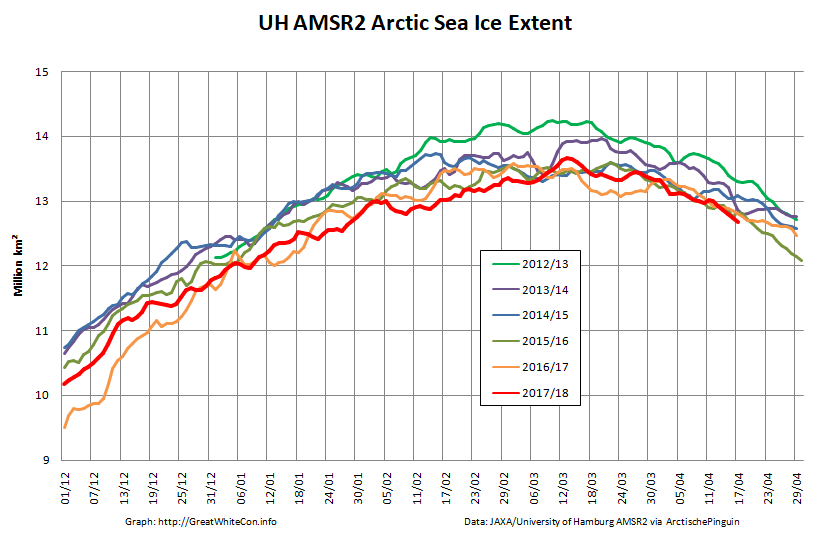
It’s not so apparent on the other extent metrics, but as the periphery melts the high resolution AMSR2 version looks to be heading into virgin territory on the downside:
Chukchi Sea will all melt eventually before September. If it forms a reasonable percentage of the volume it stands to reason that there should be a reasonable fall.
Is there any way of telling how much ice volume in the central arctic there is compared to in the past and hence the amount that can melt or be preserved from the final PIOMAS estimate of the remaining central ice?
Chris Reynolds used to do that on a regular basis, pre the Brexit vote!
https://greatWhiteCon.info/resources/gridded-piomas-graphs/piomas-regional-volume/
In principle that work could be reproduced with the latest data. I had a go at that a while ago, but I don’t have “spare time” enough at present to do it twice per month.
thanks. A bit complicated.
Jim ,can you sort me out on what multi year ice is when I see comments like not much MYI this year.
Is not all ice post late September multi year ice?
When the percentage of multi year ice for a year is worked out does this vary as per the amount of new ice added [increase in extent] or is it only saved to refer to the percentage left at the end of that year?
Here’s a video I prepared earlier:
As you say, once the September minimum has been reached all the remaining sea ice suddenly becomes “multi-year” ice. The dark blue area of newly frozen ocean is “first year” ice. As the subsequent melting season progresses the proportion of “multi–year” ice that melts away varies from year to year.
Here’s the most recent US sea ice age map that I’m aware of:
Here’s the more up to date Russian equivalent:
The dark blue area of newly frozen ocean is “first year” ice. Percentages must be worked out on area not volume then?
If a year has a low starting extent like this year then the overall amount of multi year ice will always be regarded as low.
It would take a large refreezing year with low ice melt til next September to increase the percentage relative to the average.