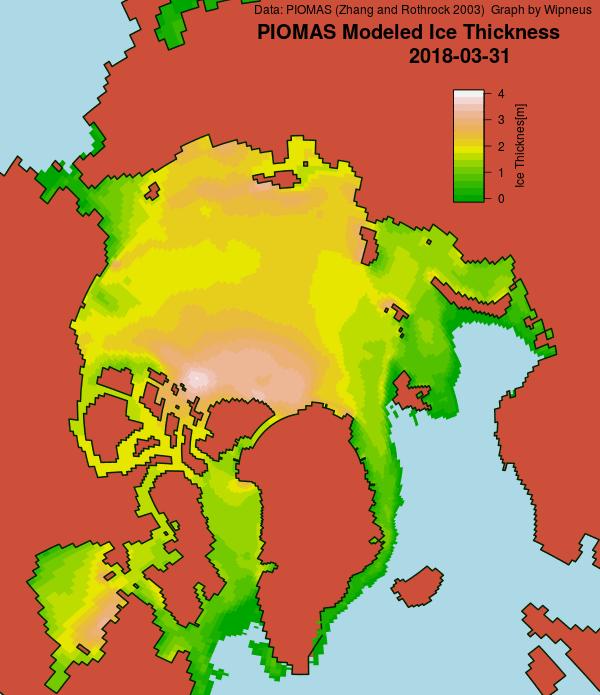
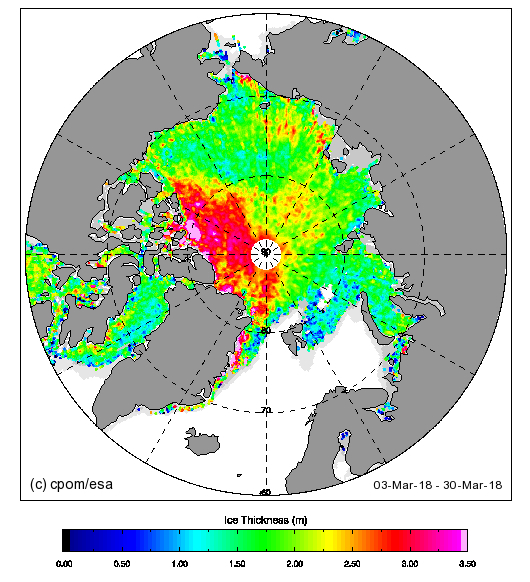
First of all Wipneus has been very quick off the mark this month with his PIOMAS gridded thickness map. Here is what it reveals for the last day of March:
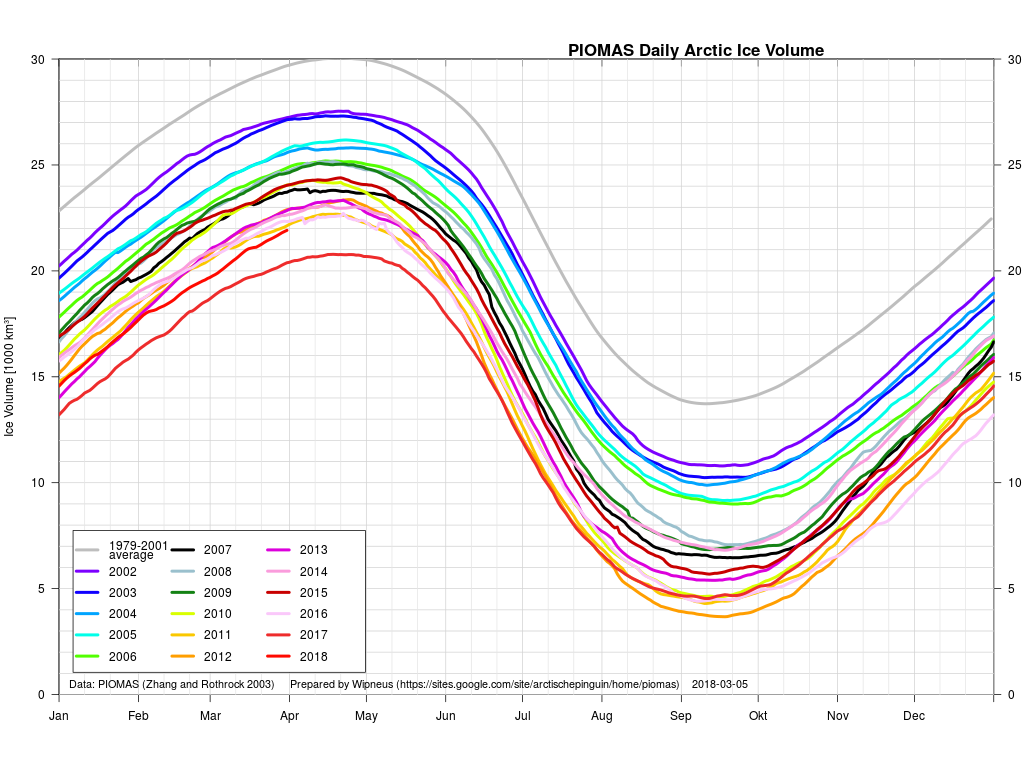
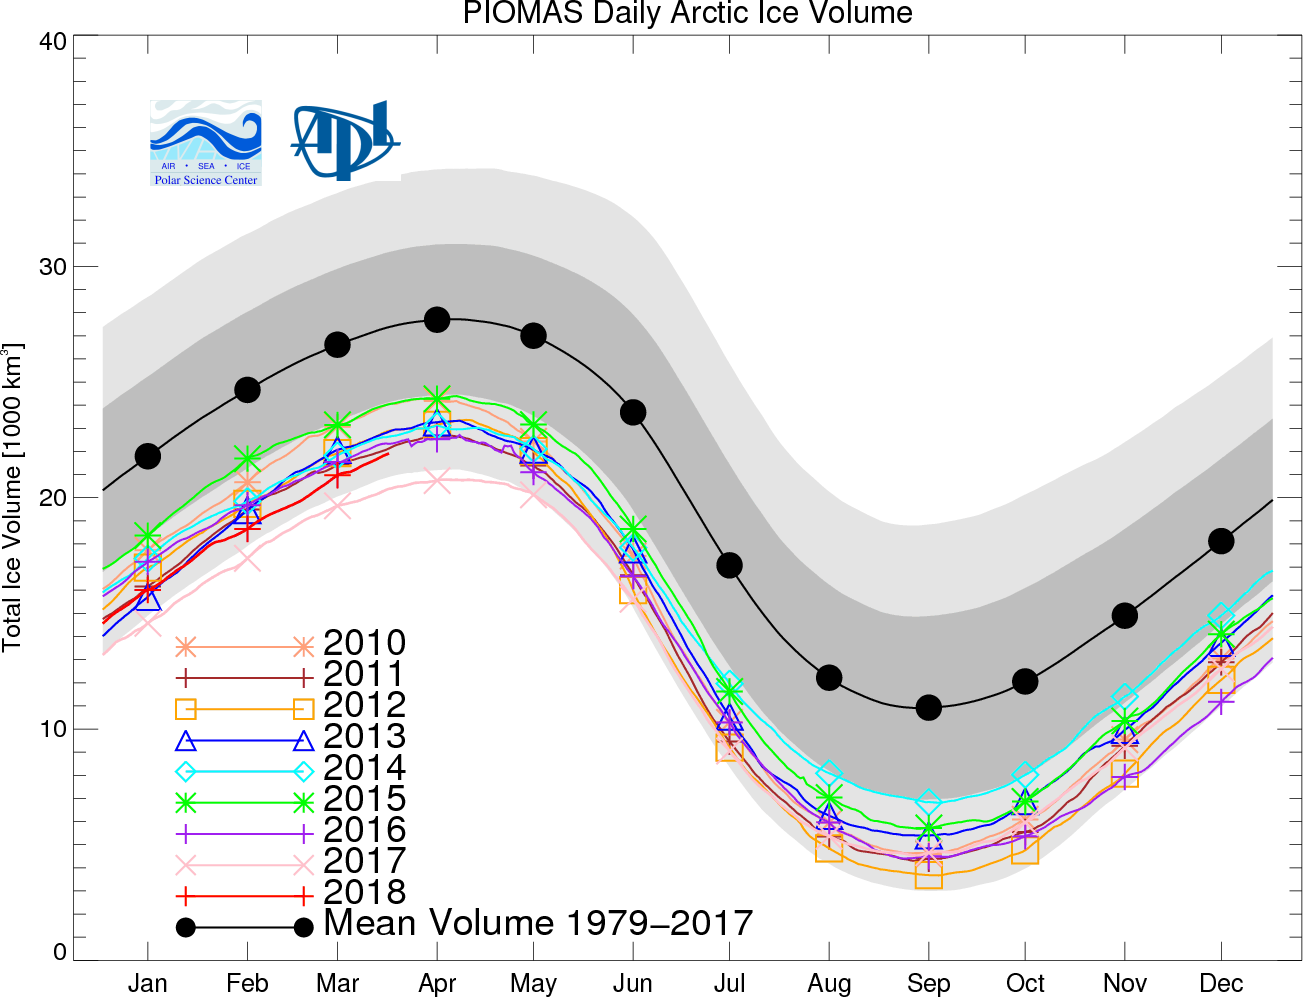
Here too is the latest PIOMAS volume graph:
together with the associated anomaly graph:
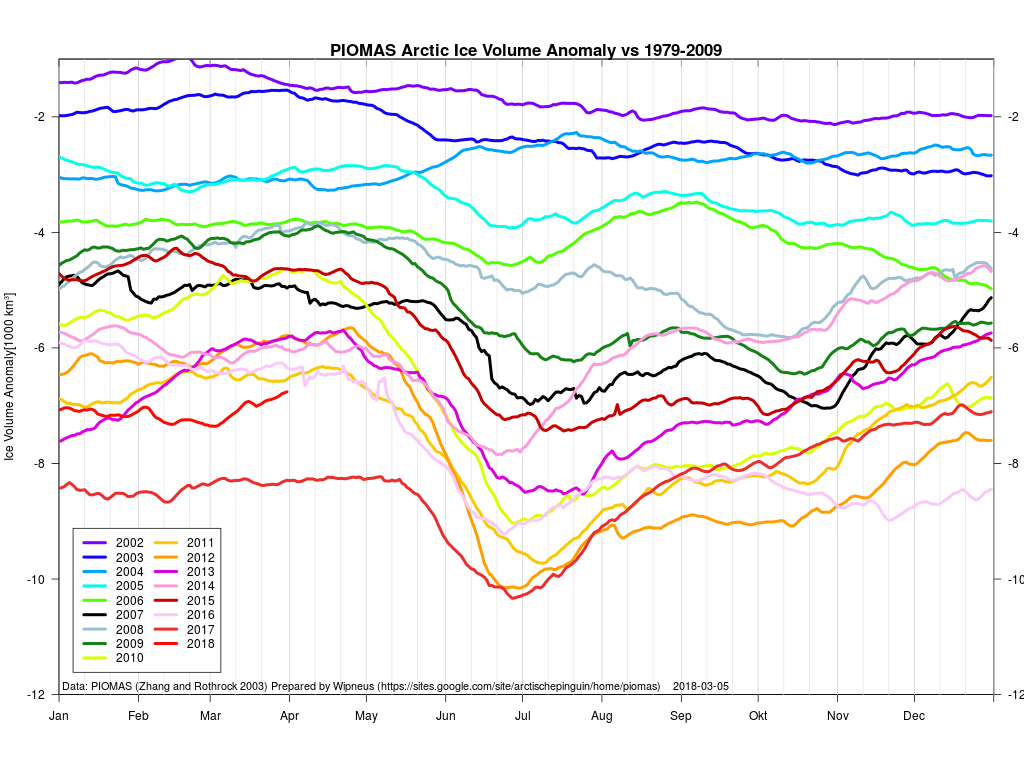
They show 2018 still in second lowest position, albeit much closer to third place than last year’s line, which is currently leading the pack by a considerable margin.
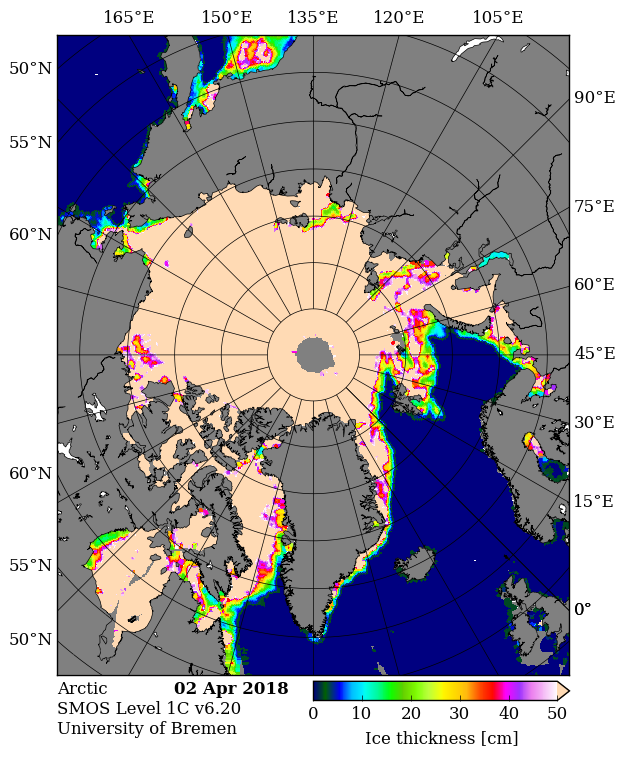
By way of comparison here are the current Arctic sea ice thickness maps from SMOS:
and CryoSat-2:
All eyes are still on the Bering and Chukchi Seas, where significant extent declines look likely over the coming days.
The official PIOMAS graph including March 2018 is now available:
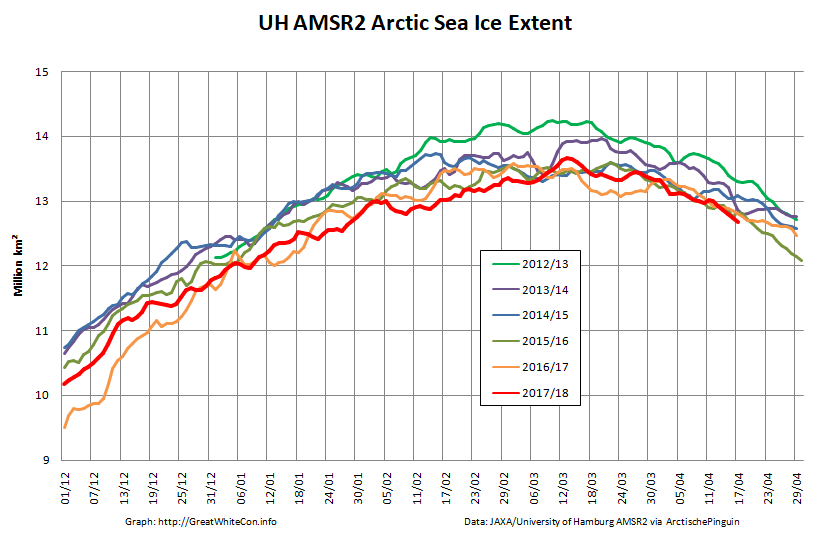
Meanwhile, according to NIPR/JAXA, Arctic sea ice extent is once again lowest for the date since their records began:
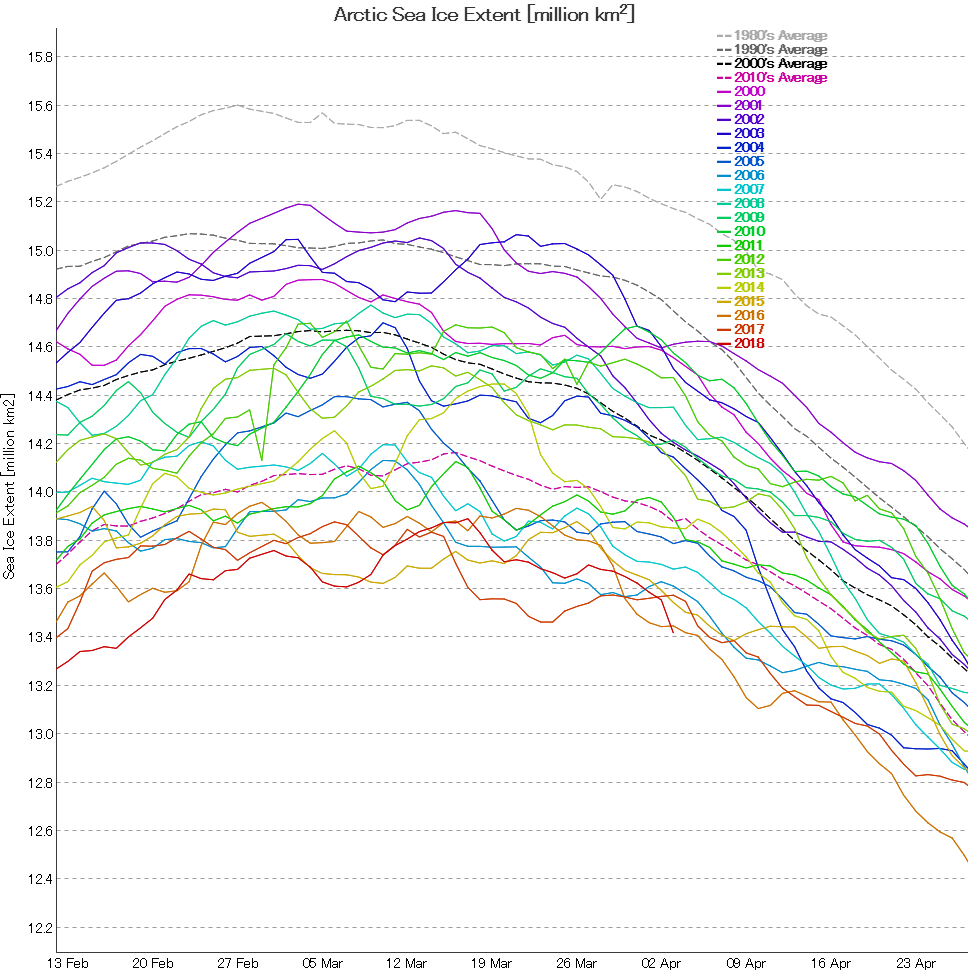
The NSIDC 5 day averaged extent is now in “lowest in our records” territory:

Meanwhile “JAXA” extent has just edged above 2016!
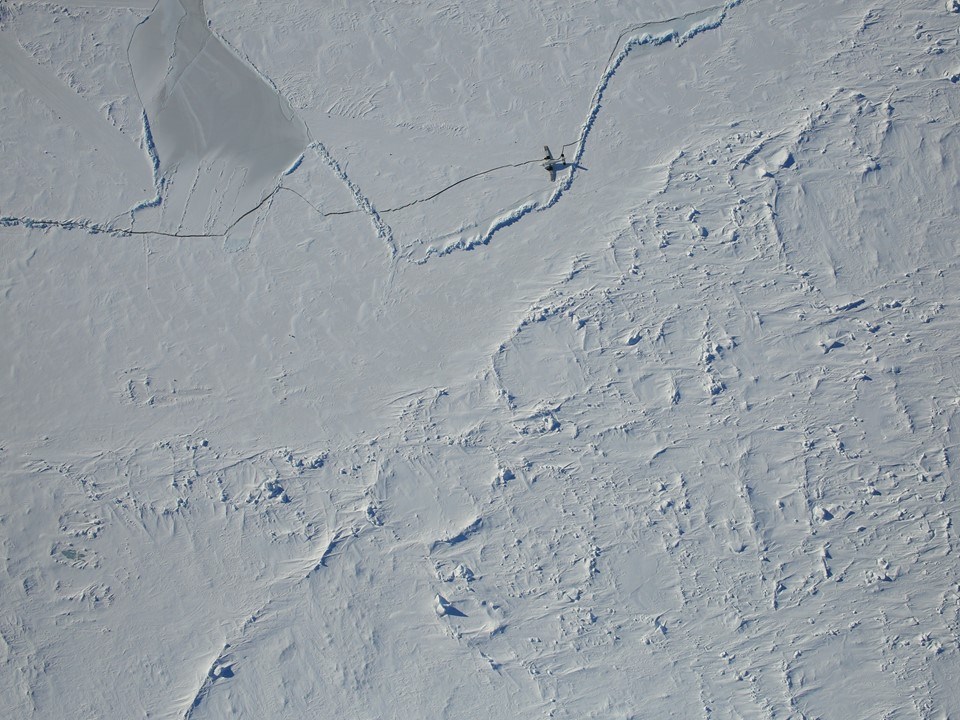
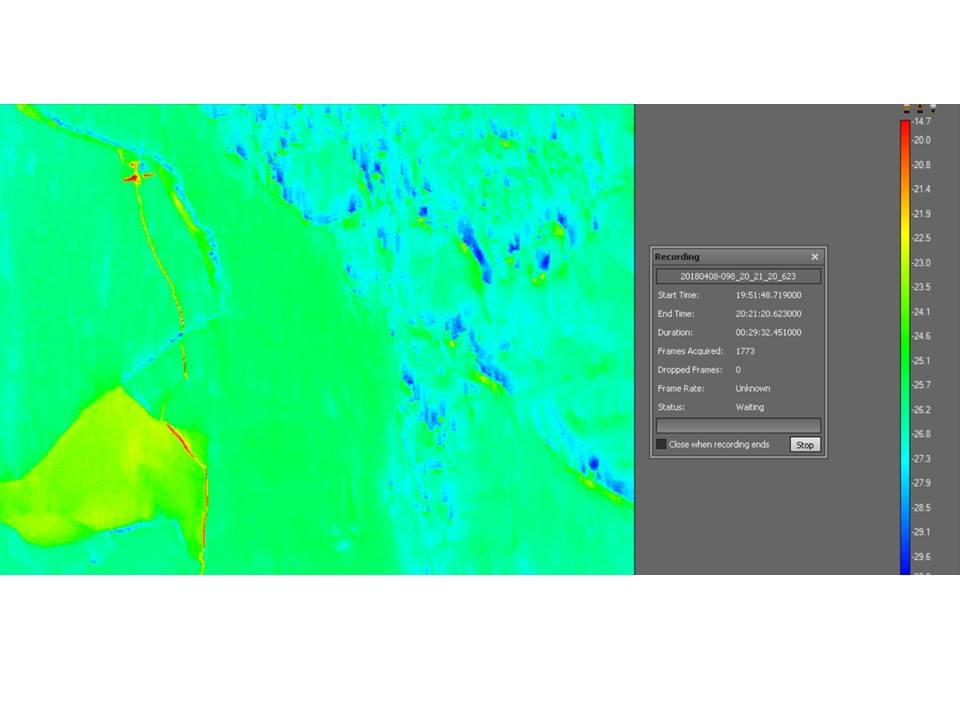
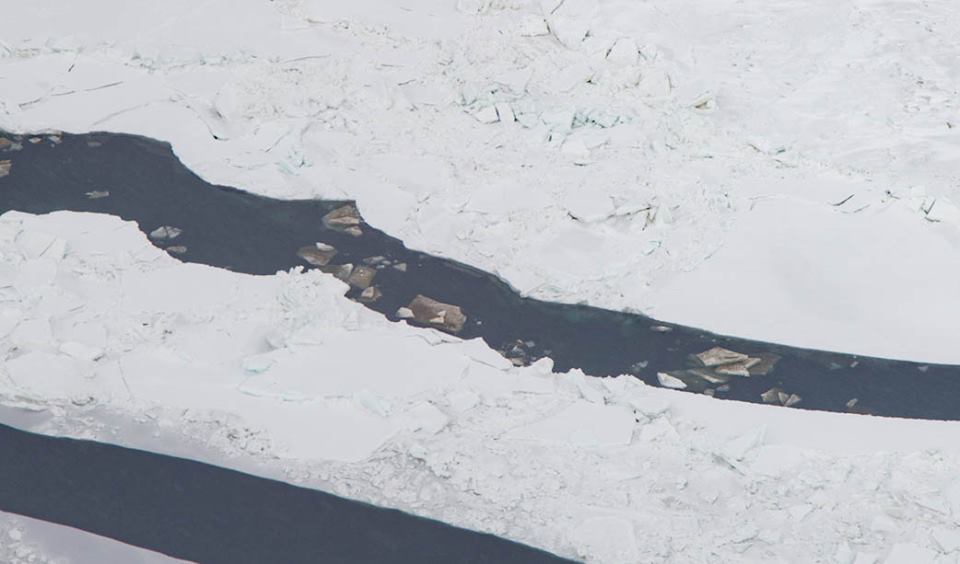
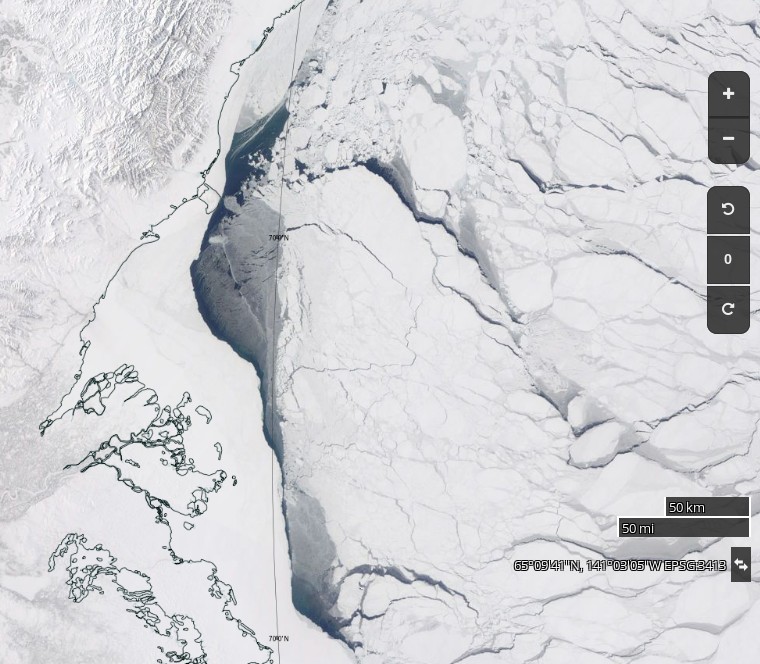
The focus has been on the Bering and Chukchi Seas until now. However there were clear skies over the Mackenzie Delta yesterday, revealing some open(ish) areas in the Beaufort Sea:
There’s only the merest hint of a blip on the area graph so far though:
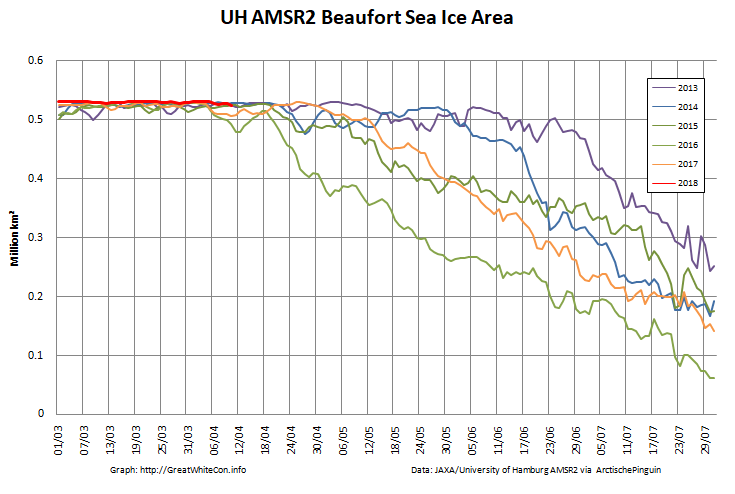
It will be interesting to see if the decline in Beaufort Sea area continues from here, or whether this year’s “flatline” resumes and continues for a while longer.
It’s not so apparent on the other extent metrics, but as the periphery melts the high resolution AMSR2 version looks to be heading into virgin territory on the downside: