Although positive feedbacks between sea ice and the Arctic circulation exist, we find that these are small during summer. Instead, circulation variations over the Arctic have been a significant factor in driving sea-ice variability since 1979, and have had a non-trivial contribution to the total surface temperature trend over Greenland and northeastern Canada39 . The potentially large contribution of internal variability to sea-ice loss over the next 40 years reinforces the importance of natural contributions to sea-ice trends over the past several decades. The similarity of high-latitude circulation variability associated with sea-ice loss to the teleconnections with the tropical Pacific suggests a contribution of sea-ice losses from SST trends across the tropical Pacific Ocean. Decadal trends in the hemispheric circulation are an important driver of Arctic climate change, and therefore a significant source of uncertainty in projections of sea ice. Better understanding of these teleconnections and their representation in global models under increasing greenhouse gases may help increase predictability on seasonal to decadal timescales.
As you may already be able to imagine, this paper (PDF as submitted) is already the source of considerable controversy! Firstly let’s take a look at an overview of the paper from the University of Washington, entitled “Rapid decline of Arctic sea ice a combination of climate change and natural variability”:
“The idea that natural or internal variability has contributed substantially to the Arctic sea ice loss is not entirely new,” said second author Axel Schweiger, a University of Washington polar scientist who tracks Arctic sea ice. “This study provides the mechanism, and uses a new approach to illuminate the processes that are responsible for these changes.”
[First author Qinghua] Ding designed a new sea ice model experiment that combines forcing due to climate change with observed weather in recent decades. The model shows that a shift in wind patterns is responsible for about 60 percent of sea ice loss in the Arctic Ocean since 1979. Some of this shift is related to climate change, but the study finds that 30-50 percent of the observed sea ice loss since 1979 is due to natural variations in this large-scale atmospheric pattern.
Now let’s take a look at another overview of the paper, this time from Roz Pidcock at Carbon Brief and entitled “Humans causing up to two-thirds of Arctic summer sea ice loss, study confirms”:
Rising greenhouse gas emissions are responsible for at least half, possibly up to two-thirds, of the drop in summer sea ice in the Arctic since the late 1970s, according to new research. The remaining contribution is the result of natural fluctuations, say the authors.
The paper, published today in Nature Climate Change, confirms previous studies which show how random variations in the climate have acted to enhance ice loss caused by rising CO2.
Importantly, the authors state clearly in the paper that their work does not absolve human activity as a driver of Arctic sea ice loss. A News and Views article that accompanies the paper, by Dr Neil Swart from Environment and Climate Change Canada, adds:
“The results of Ding et al. do not call into question whether human-induced warming has led to Arctic sea-ice decline — a wide range of evidence shows that it has.”
There has already been much debate about the paper on Twitter! Here’s the “scientific” edition:
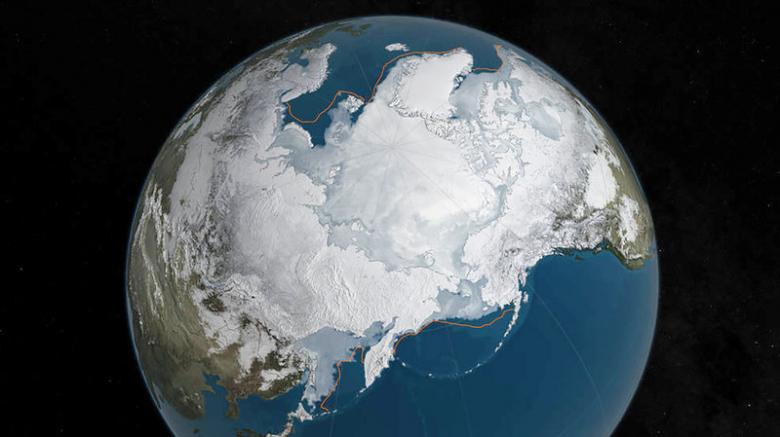
FILE PHOTO: An undated NASA illustration shows Arctic sea ice at a record low wintertime maximum extent for the second straight year, according to scientists at the NASA-supported National Snow and Ice Data Center (NSIDC) and NASA. NASA/Goddard’s Scientific Visualization Studio/C. Starr/Handout via Reuters/File Photo
Natural swings in the Arctic climate have caused up to half the precipitous losses of sea ice around the North Pole in recent decades, with the rest driven by man-made global warming, scientists said on Monday.
The study indicates that an ice-free Arctic Ocean, often feared to be just years away, in one of the starkest signs of man-made global warming, could be delayed if nature swings back to a cooler mode.
Natural variations in the Arctic climate “may be responsible for about 30–50 percent of the overall decline in September sea ice since 1979,” the U.S.-based team of scientists wrote in the journal Nature Climate Change.
David embellished his article with some “humorous” asides such as:
“This is the worst of the worst catastrophes in the world! Oh, it’s crashing … Oh, the humanity! Honest, I can hardly breathe. I’m going to step inside where I cannot see it.”
Please say it ain’t so!!!
“The melt of the Arctic is disrupting the livelihoods of indigenous peoples and damaging wildlife such as polar bears and seals while opening the region to more oil and gas and shipping.”
Eskimos, seals and polar bears!!! Oh My!!! And more oil and gas shipping!!! Aiiieeee!!!!
which some of us took exception to:
David – An Arctic indigenous person of my acquaintance asks me to tell you to “go f(r)@ck yourself”!
What should I reply on your behalf?
No answer has yet been received to that (im)pertinent question!
All this excitement in the Twittosphere and elsewhere leads one to wonder whether Ding, Schweiger et al. saw (or should have seen?) all this coming, and if so what might have been done differently? In any event this story is set to run and run and run and……
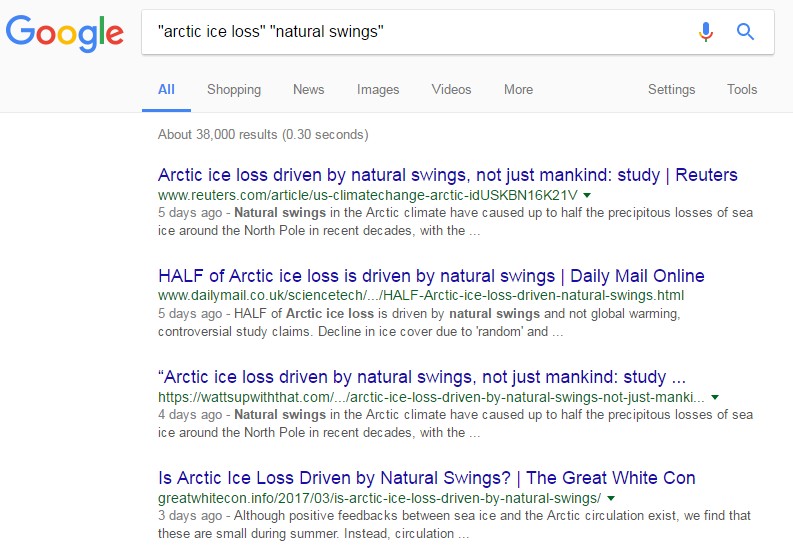
38,000 results. We’re number 4. If you repeat the exercise please feel free to experiment with the search phrase(s) you employ. Make sure to only click on the link that leads you back here!
Without being able to pick any obvious holes I feel somewhat uncomfortable with that; the idea that September ice depends just on JJA circulation doesn’t feel at all right. Having decided that, though, they then run a variety of model experiments, for example “nudging” the circulation back to re-analysis, with and without an ocean-ice model underneath. And the result seems to be that it is mostly the circulation forcing the sea ice, rather than the sea ice changes forcing the atmosphere. This kinda-fits the “information flow” meme from way back so I should be prepared to accept that mostly. Having done that they then convince themselves that most of the circulation changes that matter to the ice are not GW forced, and so must be natural variability; and hence the conclusion. If you took all of this at face value then they’d have solved one of the puzzles, that on the whole models show much less ice decline that reality. But of course if the decline is substantially a freak of variation, not forced, that would fit.
The flaw in this overall, without looking at the details, is that it’s hard to see a near-40-year trend and being so much natural variability. That seems to be asking for an awful lot of one-way variation.
Prof. Andrew Shepherd, Director of the Centre for Polar Observation and Modelling at the University of Leeds, said:
“According to this new research, the dramatic decline in Arctic sea ice that we have witnessed over recent decades is primarily due to anthropogenic (man-made) climate warming.
“Although this finding may not come as a surprise, being able to separate this from the effects of natural climate variability is an important step forwards, and paves the way for an improved understanding of what we should expect in future decades.”
Dr Ed Hawkins, Climate research scientist at the University of Reading, said:
“Recent summer Arctic sea ice extents have all been amongst the lowest on record but this is not necessarily all due to warming global temperatures – part of the sea ice decline is also because of changes in the atmospheric circulation.
“It is challenging to determine how much of the change in the circulation is itself due to warming temperatures, but this study suggests that a substantial fraction is due to natural fluctuations.
“Looking ahead, it is still a matter of when, rather than if, the Arctic will become ice-free in summer, but we expect to see periods where the ice melts rapidly and other times where it retreats less fast.”
The Arctic icecap is shrinking – but it’s not all our fault, a major study of the polar region has found. At least half of the disappearance is down to natural processes, and not the fault of man made warming.
Part of the decline in ice cover is due to ‘random’ and ‘chaotic’ natural changes in air currents, researchers said.
The rest has been driven by man-made global warming, scientists said.
The research means that although it is widely feared that the Arctic could soon be free of ice, this could be delayed if nature swings back to a cooler cycle.
Colin Fernandez’ Daily Mail article reproduced at Mark Morano’s “Climate Depot”
Study in journal Nature: HALF of Arctic ice loss driven by natural swings — not ‘global warming’
The five earliest years of data plot near +2 standard deviations. The five most recent full years of data plot near or just outside of -2 standard deviations. Ding et al., 2017 conclude that up to half of the difference is due to the NAO and other natural climate fluctuations.
Astonishingly though, the study makes no mention of the Atlantic Multidecadal Oscillation, which also has a significant effect on Arctic sea ice extent.
Since the late 1970s, the AMO has moved from the coldest point of its cycle to its highest, coinciding with a decline in Arctic sea ice coverage.
Considering that the climate models are already performing poorly as it is, the new finding means that they are actually faring even worse than has been generally realized. And accounting for this strengthens the case for a lukewarming future from greenhouse gas emissions.
Ring up another strike against the climate models, and another reason why basing government policy on their output is a bad idea.
23 thoughts on “Is Arctic Ice Loss Driven by Natural Swings?”
I was very disappointed when I discovered that a virgin, with a fresh bay leaf in her mouth, could tell a falsehood. I was even more disappointed when I discovered computer models were even more at the mercy of of their “priests”, than the virgins at the Temple of Delphi.
All models are wrong, some are useful, some will save your life. CMIP5 is like a virgin with a fine, large bay leaf in her mouth. She will speak nonsense if asked the wrong question.
Suggested Questions:
1)Has AGW changed global atmospheric circulation patterns?
2) Do AGW induced atmospheric circulation patterns allow more (latent) heat into the Arctic?
My favorite virgin is sitting under the bay tree muttering things that sound like, “AGW is very noisy.” In the best Delphi tradition, it does not answer either of the questions, and yet it answers the big question; Does increased forcing of a large feedback system with multiple feedback loops including significant “lags” and “stores” increase the noise? It does, and we have known this since “Industrial Dynamics” by Jay Forester.
With AGW, I would expect to see more intense storms, more intense decadal variations such as El Nino, and more intense multi-decadal oscillations. In short, higher levels of “natural variation” are indicative of higher levels of AGW.
What does this article in Nature say? I can’t access it.
From the abstract and what I read here, it seems to be saying ‘warming can come from the Pacific.”
yah?
The oceans are warming.
Tommy – See the new PDF link above. From the introduction:
In this paper, we examine the contribution of the atmospheric circulation to Arctic sea-ice variability by utilizing an atmospheric general circulation model (ECHAM5) coupled with a simple ocean–sea-ice model in which the atmospheric circulation field is nudged to observations. Specifically, we explore how the high-latitude summertime atmospheric circulation impacts the September Arctic sea-ice extent, and estimate to what extent changes in atmospheric circulation explain the observed sea-ice loss of the past few decades.
In a bit more detail:
To examine the physical linkages, we focus on the connection between September sea-ice extent and the preceding summer (June–July–August, JJA) atmospheric circulation. We choose this preceding 3-month window because sea-ice extent anomalies have a ∼3-month decorrelation timescale , and previous studies have shown a strong link between summer circulation and sea-ice variability. We focus on physical mechanisms, analysing temperature, humidity, and downward longwave radiation (DLR), all of which are affected by atmospheric circulation and, in turn, affect sea-ice concentration. A key player is the radiation balance, which dominates the surface energy balance controlling the growth and melt of Arctic sea ice.
I suppose one’s first question “of substance” might well be is “a simple ocean–sea-ice model” up to the task in hand?
Thanks Jim. I’ll look at this paper in more detail later, but at first glance, it seems to verify GW effect on Arctic. It’s a fascinating paper in so many ways though. I can’t see the interpretation the deniers are giving it, and I can’t see how the researchers can call those natural variations in the troposphere. Everything I ever read is that the poles are warming fastest. Probably because the heat of the overall atmosphere gets shunted there by planetary dynamics (eg. maybe the shape, the spin, the flatter poles), via the ‘atmospheric circulation’.
Also, the jet stream is said by many to be changing. That may be tied to El Nino, a natural variation, but many predict El Nino’s will change in frequency of occurrence due to GW.
…. and so on.
The Daily Fail was fairly quick off the mark Matthew. See the “Skeptical” slideshow above.
Whether their ace investigative fantasy fiction writer has anything to add over the weekend remains to be seen! In the meantime please also see our overview of the usual suspects:
Just got the time to review sea ice. I notice that Cryosphere Today is down and has been for ages. Do you remember what sea ice index we used for our bet, was it Cryosphere Today? I have a feeling it was 1 million kmsq for that index.
Do you anticipate spending more time back on the sea ice theme in the coming weeks? I note that the “Slow Transition” thread at the ASIF seems to have burst back into life recently, for example.
Hello Jim,
I’m very sorry for not getting back promptly. Work is hectic right now.
At present I am experiencing Critical Slowing in my laboratories and constantly fighting fire amidst a background of sharply increasing workload and poorly skilled graduates applying every time we advertise. The chances of my returning to sea ice this year are slim.
Anyway I have posted this comment with the email address I most commonly use now (which is on my phone and laptop).
I recall proposing an asymetric bet, if I lose I pay £1k if you lose you pay £1. Do you want to make it symmetric?
I’d prefer to use NSIDC since the probability of them going down is minimal. But whilst I can calculate are on a daily basis (which covers Wipneus stopping) I am hampered by what masks they are using, with area the effect is substantial.
What is your confidence on a <1 million for the month of September as per NSIDC Sea Ice index?
Lead author Qinghua Ding has signed on past papers with Willie (oilcan) Soon, $1+ million exxon PR propaganda recipient, for services rendered. Soon-directed Q.D. has been looking for “natural causes” for years… & AGW denier liar whiners found themselves “a new scientist” to tote the AGW denier liar whiner ball. Hope Soon is nicely retired, so exxon can give Q.D., $2 million…. gotta keep up with inflation, ya know.
However correlation doesn’t necessarily equal causation! According to a comment over at Stoat:
Sometimes we can take guilt-by-association suspicions a little too far. Qinghua and I recently were co-PIs on an NSF proposal and I have no reason to suspect that he is anything but the careful and imaginative large-scale dynamicist that he appears to be.
Surely you’re not suggesting that the likes of Axel Schweiger (of PIOMAS fame) and Eric Steig would somehow allow their strings to be pulled by Big Willie?
Very consequential high internal variation needs a very high climate sensitivity to forcings. Kinda the opposite of what we need. I don’t know why the deniers are cheering… talking about a dumb bunch..
Jim, since you asked (in William Connolley’s “stoat” thread to entertain a discussion about the issues with Ding et al 2017, here is my best summary of the problem with that paper :
I think it was Steven who correctly pointed out that there are TWO parts to Ding et al’s claims of influence of “internal variability” on Arctic sea ice :
(1) about 60% of the September Arctic sea-ice extent decline since 1979 is caused by trends in summertime atmospheric circulation.
(2) about 70% of those atmospheric circulation trends is caused by internal variability (and hence the remaining 30% is anthropogenic).
Now the problem I have with the paper are very clearly in point (1) :
It started with Ding et al claim in the abstract of that point :
Here, we present evidence that trends in summertime atmospheric circulation may have contributed as much as 60% to the September sea-ice extent decline since 1979.
In my previous post, I noted that Ding et al uses “GL-Z200” (geopotential height at 200 mb, over Greenland) as their metric for “atmospheric circulation” over the Arctic.
That immediately means that the conclusion should have read something like this :
Here, we present evidence that trends in summertime geopotential height may have contributed as much as 60% to the September sea-ice extent decline since 1979.
Now, this should raise some eyebrows here and there, since geopotential height is clearly directly correlated with temperature. If the temperature goes up, so does geopotential height.
In fact, the ideal gas law (PV=nRT) DICTATES that geopotential height goes up with temperature.
Which is sustained in the ERA data set, where Ding et al itself reports that there is a R=0.94 correlation between geopotential height and temperature.
So AGW, which is certainly a part (if not all) of the trend in temperature over the Arctic is certainly also a part (if not all) of the trend in geopotential height.
And thus Ding et al 2017 can no longer claim that the Z200 trend (which they call “atmospheric circulation trend”) is a source of “internal variability”.
But that’s not all.
The even bigger problem with the paper is in which they determined the influence of “atmospheric circulation” (oops, I mean geopotential height) on Arctic sea ice decline.
If you want to investigate that influence with a sea ice/climate model, you would run the model with the ERA climate parameters, and compare it with a run that has geopotential height adjusted (subtract the geopotential height anomalies from the ERA data).
But that is not what Ding et al did.
They adjusted ALL variables (geopotential height, temperature, moisture content, downwelling LW radiation etc), essentially making the ‘climate’ constant.
Specifically, this is described here in the paper :
Exp-6: Same as Exp-5 except that the atmospheric forcing is modified to excise the forcing associated with the trends in the Greenland circulation pattern. To remove the circulations trend from the observat ions, we first construct the thirty-six-year seasonal (JJA) averaged time series of the Z200 index over Greenland, Z200 GL (GL-Z200 in Fig. 1c). We then linearly regress a key variable B
against this time series to obtain spatial pattern β(x,y) of the variable associated with the Greenland circulation index. Specifically, for the variable B we have
B(x, y, t) = β(x, y) × Z200 GL (t) (1)
where B represents a forcing field (for example, 10 m zonal wind, DLR, temperature, and so on), x and y indicate the location, t indicates time (JJA), Z200 GL is the Greenland Z200 index (GL-Z200 in Fig. 1c), and β is the regression coefficient. In the second step, the seasonal mean anomalous value of each forcing field is subtracted from the observed daily (or 6-hourly) forcing data during the summer—rendering a modified forcing that does not include variability or trends in variables that are asso ciated with Z200 GL. In the nine non-summer months, the forcing is exactly the same as that used in the Exp-5 control experiment. Given a strong correlation between circulation and surface winds, temperature, specific humidity, sea-level pressure, and downwelling long wave radiation in the Arctic, variability and trends in these six variables that are associated with Z200 GL are processed and removed from the forcing. The initial states of ocean, sea ice and atmosphere in Exp-5 and Exp-6 are exactly the same.
I highlighted in bold the section that describes that indeed they adjusted ALL variables to the extent that they linearly associate with Z200 GL. And because the correlation between all these variables and Z200 is very high (see figure 1c in the paper), they effectively eliminated ALL trends in ALL variables from their Exp-6 run, which means they effectively made the climate constant in that run.
Since the climate did not change in that run, they obtained a much lower ice melt rate.
Essentially the conclusion should thus have been :
Here, we present evidence that trends in summertime climate change may have contributed as much as 60% to the September sea-ice extent decline since 1979.
Which means that (this experiment 5 versus 6 suggests that) :
60% of Arctic sea ice reduction is caused by summer-time climate change, while 40% is caused by climate change over the remaining 9 months.
Which is an interesting conclusion, but as you can see it has NOTHING to do with ANY sort of “natural variability”, so Ding et al cannot use it in their variability conclusion either.
You can still choose not to believe that this paper is seriously flawed, but you can no longer claim that you did not know.
Jim,
The choice of models in Ding et al 2017 is not that important.
First of all, they are not trying to predict sea ice extent absolutely.
They are running ‘difference’ experiments (such as the important Exp-5 – Exp-6 difference). A bit of uncertainty is not a big deal.
Secondly, the attribution of “natural variability” they report is 30-50%, which already is pretty wide. Using better models may tighten that a bit but that’s all.
Finally : the REAL problem with Ding et al 2017 is not in the models. It’s in the “method” they use, and the (implicit) assumptions they are making about how much of the geopotential height anomalies (and their trend) is “natural” and how much is “anthropogenic”.
Rob – Sea ice modelling is of course a hobby horse of mine!
It seems to me that even the latest and greatest sea ice models fail to keep up with the rate at which the ice is thinning and fragmenting and hence becoming more mobile. The latest research suggests mixing with deeper, warmer water is occurring too.
How do those sort of “feedbacks” feed into the “natural” versus “anthropogenic” debate?
Jim, if you look at the details, Ding et al 2017 does not distinguish between “natural” versus “anthropogenic” climate change trends. Here is my post on William Connolley’s “stoat” site, in a reply to Eric Steig (one of the authors of Ding et al 2017) :
William mentioned that “The point of the trend in z200 is “natural variability” is indeed the point that RD is questioning” and that is certainly a point of concern. After all, we KNOW that at least a part of the atmospheric temperature increase is due to AGW, which MUST have put an imprint on geopotential height over the Arctic. Jennifer Francis theory of wavy jetstreams due to reduced geopotential height difference between the tropics and the Arctic is based on that. Are you now saying that that theory is wrong ?
If not, then at least a part of trend in geopotential height increase (Z200) since 1979 must be anthropogenic.
But in fact the core of my argument goes one step further :
I claim that your “regression coefficient” in Experiment 6 eliminates ALL trends, natural or anthropogenic. And thus, that you essentially kept the climate constant in Experiment 6.
To see that, check the regression formula you use for Exp-6 :
B(x, y, t) = β(x, y) × Z200 GL (t) (1)
Here, β(x, y) is the regression coefficient between Z200-GL and the variable under consideration, and B(z,y,t) is the “forcing” that you later subtract from the ERA data during summer.
Now, the regression coefficient is very good in finding trends.
So even if the correlation of Z200-GL and the variable (say “temperature”) is not very good (like further away from Greenland) the regression coefficient will still find a ‘trend’, and thus the “forcing” you subtract for Exp-6 will still be pretty darn close to the linear relation we expect to see from the ideal gas law.
Qinghua has all the data available, so could you please ask him to reproduce the “adjusted forcing” for Exp-6 for, say the temperature variable north of 70deg, and check if it still has a trend since 1979 ? I claim it doesn’t, since the regression method eliminated it.
And that means that all you have calculated (between Exp-5 and Exp-6) is the influence of climate change over the JJA period (60%) which means the remaining 40% was caused by climate change over the other 9 months.
Which is an interesting conclusion, but positively doesn’t have anything to do with “natural” or “anthropogenic” causes of the trend in Z200-GL.
Thanks to ‘Steven’ at the ASIF, I realized that I don’t need to do a full ERA data download and a gridded regression analysis to test how much of the trend in summertime temperature and LW is taken out by Z200 changes if we apply the Ding et al 2017 regression method.
We can get a pretty good estimate by using the data from fig1c and run the numbers. I did that today, and indeed it shows (just like Qinghua already told me) a 35% residual trend for LW. Temperature shows a similar (35%) residual trend.
So, even though I find it difficult to accept that 65% of the trend in summertime Arctic temperatures would be caused by ‘atmospheric circulation’ (natural variability), leaving only 35% for AGW, I do understand the mistake I make and I (humbly) apologize to Qinghua and Eric for my arrogant stand in the issue.
Many thanks for all your interesting/burning/critical/constructive comments and questions on our paper and my thoughts.
The first thing I want to say is that no one should expect that our short paper could fully address the most challenging question we are facing now in the polar community.
I am 100% sure that the mechanism of that “polar heat wave idea” is correct, since this is the only way ( in my personal view) to explain everything ( “everything” here means changes in sea ice, winds, temperature, vertical velocity and radiation fields) that we have observed in the Arctic since 1979. If we only considered CO2 forcing, it always puzzled me that some observed features in the Arctic cannot be well supported by either model results or dynamics of the Co2 greenhouse effect. But I have to say that we didn’t consider aerosol in our work.
That 40% contribution from natural forcing is what we concluded based on the facts of our modeling experiments and a IPCC/NCAR model evaluation task.
In the paper, we used three steps of experiment/evaluation to reach to this number.
A. the first set of experiments
model: ECHAM5 with a simple ocean/sea ice:
purpose:
to determine the direction of causality of observed connections between the circulation and all other variables.
conclusion:
1. the experiments qualitatively prove that the observed circulation change is important to regulate all other variables
2. and these atmospheric changes in JJA cannot be explained by sea ice melting if we only put Arctic sea ice decline in the model
B. IPCC/NCAR models evaluation
purpose: to consider whether forced responses of models to CO2 forcing can explain some observed features and understand how much the observed circulation change is still forced by CO2 forcing
Conclusion: we found that CO2 forcing cannot reproduce some features in the observation and only a part of the circulation change in the arctic is due to CO2 .
C. the third set of experiments:
model: a more sophisticated sea ice and ocean model ( a part of CESM) without atmosphere.
purpose: quantify how much of sea ice melting is due to the circulation change
conclusion: circulation related forcing at the interface between sea ice and atmosphere can substantially melt sea ice
This is our strategy to tackle the problem. I think this is not the perfect one but the best one we could come up with by using available in-house tools. As I know, our study is the first one to use a numerical model to tease the influence of the circulation on sea ice apart from other influences. So I think it is an important step forward to open up a new direction to understand arctic sea ice.
In the paper ( the first paragraph in the conclusion part), we acknowledged this limitation.
“Our conclusions are based on experiments involving several models rather than one integrated model. POP2-CICE4 simulations are used to allow for a realistic simulation of sea-ice variability, while ECHAM5 simulations allow for realistic simulations of the linkage between circulation and thermodynamic drivers of sea-ice loss, while permitting nudging to observed wind fields. The close agreement of patterns of thermodynamic forcing on sea ice between the ECHAM5 and POP2-CICE4 provides confidence in combining these two tools.”
another part in the paper to discuss a possible way to improve our understanding
“Therefore, a substantial contribution of tropical Pacific variability on sea ice loss via this teleconnection is to be expected. A further examination of this
question will require a modelling framework that reproduces the tropics high latitude linkage faithfully and efficiently.”
In my current work, I am working on a new project to repeat the experiments using a fully coupled model. That means combining sets A and C together into one integrated experiment to understand how the recent wind changes influence sea ice. I am sure with this better approach, we will move closer to the real contribution of natural forcing on sea ice melting but I still wouldn’t say that I am 100% sure that the new number is correct because we never know whether another model would give the same number.
All of which goes some way towards answering my first “technical” question!
This website uses cookies to improve your experience. We'll assume you're ok with this, but you can opt-out if you wish. Cookie settingsACCEPT
Privacy & Cookies Policy
Privacy Overview
This website uses cookies to improve your experience while you navigate through the website. Out of these, the cookies that are categorized as necessary are stored on your browser as they are essential for the working of basic functionalities of the website. We also use third-party cookies that help us analyze and understand how you use this website. These cookies will be stored in your browser only with your consent. You also have the option to opt-out of these cookies. But opting out of some of these cookies may affect your browsing experience.
Necessary cookies are absolutely essential for the website to function properly. This category only includes cookies that ensures basic functionalities and security features of the website. These cookies do not store any personal information.
Any cookies that may not be particularly necessary for the website to function and is used specifically to collect user personal data via analytics, ads, other embedded contents are termed as non-necessary cookies. It is mandatory to procure user consent prior to running these cookies on your website.

I was very disappointed when I discovered that a virgin, with a fresh bay leaf in her mouth, could tell a falsehood. I was even more disappointed when I discovered computer models were even more at the mercy of of their “priests”, than the virgins at the Temple of Delphi.
All models are wrong, some are useful, some will save your life. CMIP5 is like a virgin with a fine, large bay leaf in her mouth. She will speak nonsense if asked the wrong question.
Suggested Questions:
1)Has AGW changed global atmospheric circulation patterns?
2) Do AGW induced atmospheric circulation patterns allow more (latent) heat into the Arctic?
My favorite virgin is sitting under the bay tree muttering things that sound like, “AGW is very noisy.” In the best Delphi tradition, it does not answer either of the questions, and yet it answers the big question; Does increased forcing of a large feedback system with multiple feedback loops including significant “lags” and “stores” increase the noise? It does, and we have known this since “Industrial Dynamics” by Jay Forester.
With AGW, I would expect to see more intense storms, more intense decadal variations such as El Nino, and more intense multi-decadal oscillations. In short, higher levels of “natural variation” are indicative of higher levels of AGW.
What does this article in Nature say? I can’t access it.
From the abstract and what I read here, it seems to be saying ‘warming can come from the Pacific.”
yah?
The oceans are warming.
Tommy – See the new PDF link above. From the introduction:
In a bit more detail:
I suppose one’s first question “of substance” might well be is “a simple ocean–sea-ice model” up to the task in hand?
Thanks Jim. I’ll look at this paper in more detail later, but at first glance, it seems to verify GW effect on Arctic. It’s a fascinating paper in so many ways though. I can’t see the interpretation the deniers are giving it, and I can’t see how the researchers can call those natural variations in the troposphere. Everything I ever read is that the poles are warming fastest. Probably because the heat of the overall atmosphere gets shunted there by planetary dynamics (eg. maybe the shape, the spin, the flatter poles), via the ‘atmospheric circulation’.
Also, the jet stream is said by many to be changing. That may be tied to El Nino, a natural variation, but many predict El Nino’s will change in frequency of occurrence due to GW.
…. and so on.
Climategate 3 !!! Wrote in ASIF earlier that I reckoned the greatwhitecon would be disturbed from its lair by trollish noises in cyberspace.
The Daily Fail was fairly quick off the mark Matthew. See the “Skeptical” slideshow above.
Whether their ace investigative fantasy fiction writer has anything to add over the weekend remains to be seen! In the meantime please also see our overview of the usual suspects:
https://greatWhiteCon.info/2017/03/is-arctic-ice-loss-driven-by-natural-swings/#AltDenialist
Jim,
Just got the time to review sea ice. I notice that Cryosphere Today is down and has been for ages. Do you remember what sea ice index we used for our bet, was it Cryosphere Today? I have a feeling it was 1 million kmsq for that index.
Chris
Welcome Chris,
Long time no hear, speak or see! How’s things in your neck of the woods?
This is the relevant link I think:
https://greatWhiteCon.info/2015/05/the-new-normal-in-the-arctic/#comment-209391
Our wager does indeed seem to have been “that CT Area will drop to below 1M km^2 on any day before 2022.”
I did discuss the possibility of CT disappearing before 2022 in the context of my parallel bet with “Chilly”:
https://greatWhiteCon.info/2015/05/the-new-normal-in-the-arctic/#comment-209109
Do you anticipate spending more time back on the sea ice theme in the coming weeks? I note that the “Slow Transition” thread at the ASIF seems to have burst back into life recently, for example.
Hello Jim,
I’m very sorry for not getting back promptly. Work is hectic right now.
At present I am experiencing Critical Slowing in my laboratories and constantly fighting fire amidst a background of sharply increasing workload and poorly skilled graduates applying every time we advertise. The chances of my returning to sea ice this year are slim.
Anyway I have posted this comment with the email address I most commonly use now (which is on my phone and laptop).
I recall proposing an asymetric bet, if I lose I pay £1k if you lose you pay £1. Do you want to make it symmetric?
I’d prefer to use NSIDC since the probability of them going down is minimal. But whilst I can calculate are on a daily basis (which covers Wipneus stopping) I am hampered by what masks they are using, with area the effect is substantial.
What is your confidence on a <1 million for the month of September as per NSIDC Sea Ice index?
Or would you accept Extent?
Daily extent is available for Sea Ice Index
ftp://sidads.colorado.edu/DATASETS/NOAA/G02135/north/daily/data/
Area is only available as monthly
ftp://sidads.colorado.edu/DATASETS/NOAA/G02135/north/monthly/data/
I have moved the link to this page to the top so I don't get too busy and forget this time. (and ticked to notify comments by email)
Lead author Qinghua Ding has signed on past papers with Willie (oilcan) Soon, $1+ million exxon PR propaganda recipient, for services rendered. Soon-directed Q.D. has been looking for “natural causes” for years… & AGW denier liar whiners found themselves “a new scientist” to tote the AGW denier liar whiner ball. Hope Soon is nicely retired, so exxon can give Q.D., $2 million…. gotta keep up with inflation, ya know.
Qinghua Ding has indeed been listed at the top of the same paper as Willie Soon:
http://journals.ametsoc.org/doi/abs/10.1175/2008JCLI2353.1
However correlation doesn’t necessarily equal causation! According to a comment over at Stoat:
As I pointed out over there:
I ran a relevant Google search this morning. The results of my research are displayed above.
If you repeat the exercise please make sure to only click on the link that leads you back here!
Very consequential high internal variation needs a very high climate sensitivity to forcings. Kinda the opposite of what we need. I don’t know why the deniers are cheering… talking about a dumb bunch..
They’re dumberer than dumb Doc.
IMVHO of course!
Jim,
Apart from the fact that denialists misrepresent scientific papers all the time, in this case (Ding et al 2017) the paper itself is flawed.
There is no evidence (from the paper) that ANY part of Arctic sea ice decline is caused by “natural variability”.
The only conclusion we can draw from the paper’s findings is this :
60% of Arctic sea ice reduction is caused by summer-time climate change, while 40% is caused by climate change over the remaining 9 months.
Which is a very interesting conclusion by itself.
Please see my argument here :
http://scienceblogs.com/stoat/2017/03/15/influence-of-high-latitude-atmospheric-circulation-changes-on-summertime-arctic-sea-ice/#comment-58495
Jim, since you asked (in William Connolley’s “stoat” thread to entertain a discussion about the issues with Ding et al 2017, here is my best summary of the problem with that paper :
I think it was Steven who correctly pointed out that there are TWO parts to Ding et al’s claims of influence of “internal variability” on Arctic sea ice :
(1) about 60% of the September Arctic sea-ice extent decline since 1979 is caused by trends in summertime atmospheric circulation.
(2) about 70% of those atmospheric circulation trends is caused by internal variability (and hence the remaining 30% is anthropogenic).
Now the problem I have with the paper are very clearly in point (1) :
It started with Ding et al claim in the abstract of that point :
Here, we present evidence that trends in summertime atmospheric circulation may have contributed as much as 60% to the September sea-ice extent decline since 1979.
In my previous post, I noted that Ding et al uses “GL-Z200” (geopotential height at 200 mb, over Greenland) as their metric for “atmospheric circulation” over the Arctic.
That immediately means that the conclusion should have read something like this :
Here, we present evidence that trends in summertime geopotential height may have contributed as much as 60% to the September sea-ice extent decline since 1979.
Now, this should raise some eyebrows here and there, since geopotential height is clearly directly correlated with temperature. If the temperature goes up, so does geopotential height.
In fact, the ideal gas law (PV=nRT) DICTATES that geopotential height goes up with temperature.
Which is sustained in the ERA data set, where Ding et al itself reports that there is a R=0.94 correlation between geopotential height and temperature.
So AGW, which is certainly a part (if not all) of the trend in temperature over the Arctic is certainly also a part (if not all) of the trend in geopotential height.
And thus Ding et al 2017 can no longer claim that the Z200 trend (which they call “atmospheric circulation trend”) is a source of “internal variability”.
But that’s not all.
The even bigger problem with the paper is in which they determined the influence of “atmospheric circulation” (oops, I mean geopotential height) on Arctic sea ice decline.
If you want to investigate that influence with a sea ice/climate model, you would run the model with the ERA climate parameters, and compare it with a run that has geopotential height adjusted (subtract the geopotential height anomalies from the ERA data).
But that is not what Ding et al did.
They adjusted ALL variables (geopotential height, temperature, moisture content, downwelling LW radiation etc), essentially making the ‘climate’ constant.
Specifically, this is described here in the paper :
Exp-6: Same as Exp-5 except that the atmospheric forcing is modified to excise the forcing associated with the trends in the Greenland circulation pattern. To remove the circulations trend from the observat ions, we first construct the thirty-six-year seasonal (JJA) averaged time series of the Z200 index over Greenland, Z200 GL (GL-Z200 in Fig. 1c). We then linearly regress a key variable B
against this time series to obtain spatial pattern β(x,y) of the variable associated with the Greenland circulation index. Specifically, for the variable B we have
B(x, y, t) = β(x, y) × Z200 GL (t) (1)
where B represents a forcing field (for example, 10 m zonal wind, DLR, temperature, and so on), x and y indicate the location, t indicates time (JJA), Z200 GL is the Greenland Z200 index (GL-Z200 in Fig. 1c), and β is the regression coefficient. In the second step, the seasonal mean anomalous value of each forcing field is subtracted from the observed daily (or 6-hourly) forcing data during the summer—rendering a modified forcing that does not include variability or trends in variables that are asso ciated with Z200 GL. In the nine non-summer months, the forcing is exactly the same as that used in the Exp-5 control experiment. Given a strong correlation between circulation and surface winds, temperature, specific humidity, sea-level pressure, and downwelling long wave radiation in the Arctic, variability and trends in these six variables that are associated with Z200 GL are processed and removed from the forcing. The initial states of ocean, sea ice and atmosphere in Exp-5 and Exp-6 are exactly the same.
I highlighted in bold the section that describes that indeed they adjusted ALL variables to the extent that they linearly associate with Z200 GL. And because the correlation between all these variables and Z200 is very high (see figure 1c in the paper), they effectively eliminated ALL trends in ALL variables from their Exp-6 run, which means they effectively made the climate constant in that run.
Since the climate did not change in that run, they obtained a much lower ice melt rate.
Essentially the conclusion should thus have been :
Here, we present evidence that trends in summertime climate change may have contributed as much as 60% to the September sea-ice extent decline since 1979.
Which means that (this experiment 5 versus 6 suggests that) :
60% of Arctic sea ice reduction is caused by summer-time climate change, while 40% is caused by climate change over the remaining 9 months.
Which is an interesting conclusion, but as you can see it has NOTHING to do with ANY sort of “natural variability”, so Ding et al cannot use it in their variability conclusion either.
You can still choose not to believe that this paper is seriously flawed, but you can no longer claim that you did not know.
I have emailed the authors Qinghua Ding, Eric Steig and Axel Schweiger for an opinion on my criticism of their paper.
Thanks for expanding on your analysis here Rob.
Nobody has responded to my own much more succinct query yet either:
Perhaps I should have emailed the authors too, rather than merely “tweeting” in their direction?!
Jim,
The choice of models in Ding et al 2017 is not that important.
First of all, they are not trying to predict sea ice extent absolutely.
They are running ‘difference’ experiments (such as the important Exp-5 – Exp-6 difference). A bit of uncertainty is not a big deal.
Secondly, the attribution of “natural variability” they report is 30-50%, which already is pretty wide. Using better models may tighten that a bit but that’s all.
Finally : the REAL problem with Ding et al 2017 is not in the models. It’s in the “method” they use, and the (implicit) assumptions they are making about how much of the geopotential height anomalies (and their trend) is “natural” and how much is “anthropogenic”.
Rob – Sea ice modelling is of course a hobby horse of mine!
It seems to me that even the latest and greatest sea ice models fail to keep up with the rate at which the ice is thinning and fragmenting and hence becoming more mobile. The latest research suggests mixing with deeper, warmer water is occurring too.
How do those sort of “feedbacks” feed into the “natural” versus “anthropogenic” debate?
Jim, if you look at the details, Ding et al 2017 does not distinguish between “natural” versus “anthropogenic” climate change trends. Here is my post on William Connolley’s “stoat” site, in a reply to Eric Steig (one of the authors of Ding et al 2017) :
William mentioned that “The point of the trend in z200 is “natural variability” is indeed the point that RD is questioning” and that is certainly a point of concern. After all, we KNOW that at least a part of the atmospheric temperature increase is due to AGW, which MUST have put an imprint on geopotential height over the Arctic. Jennifer Francis theory of wavy jetstreams due to reduced geopotential height difference between the tropics and the Arctic is based on that. Are you now saying that that theory is wrong ?
If not, then at least a part of trend in geopotential height increase (Z200) since 1979 must be anthropogenic.
But in fact the core of my argument goes one step further :
I claim that your “regression coefficient” in Experiment 6 eliminates ALL trends, natural or anthropogenic. And thus, that you essentially kept the climate constant in Experiment 6.
To see that, check the regression formula you use for Exp-6 :
B(x, y, t) = β(x, y) × Z200 GL (t) (1)
Here, β(x, y) is the regression coefficient between Z200-GL and the variable under consideration, and B(z,y,t) is the “forcing” that you later subtract from the ERA data during summer.
Now, the regression coefficient is very good in finding trends.
So even if the correlation of Z200-GL and the variable (say “temperature”) is not very good (like further away from Greenland) the regression coefficient will still find a ‘trend’, and thus the “forcing” you subtract for Exp-6 will still be pretty darn close to the linear relation we expect to see from the ideal gas law.
Qinghua has all the data available, so could you please ask him to reproduce the “adjusted forcing” for Exp-6 for, say the temperature variable north of 70deg, and check if it still has a trend since 1979 ? I claim it doesn’t, since the regression method eliminated it.
And that means that all you have calculated (between Exp-5 and Exp-6) is the influence of climate change over the JJA period (60%) which means the remaining 40% was caused by climate change over the other 9 months.
Which is an interesting conclusion, but positively doesn’t have anything to do with “natural” or “anthropogenic” causes of the trend in Z200-GL.
I reproduce here a comment by Rob Dekker over at Stoat:
I also reproduce a comment by Qinghua Ding on the Arctic Sea Ice Forum:
All of which goes some way towards answering my first “technical” question!