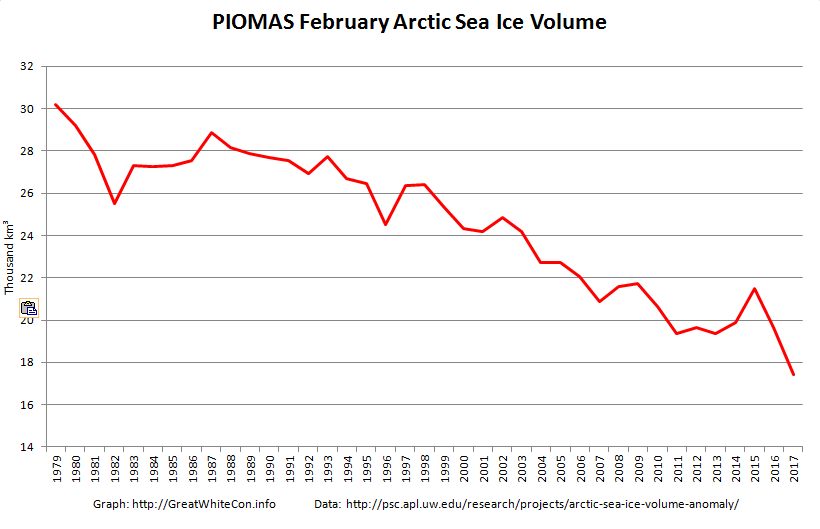
The February 2017 PIOMAS Arctic sea ice volume numbers are out. It’s no longer surprising to report that they are the lowest ever for the month of February in records going back to 1979:
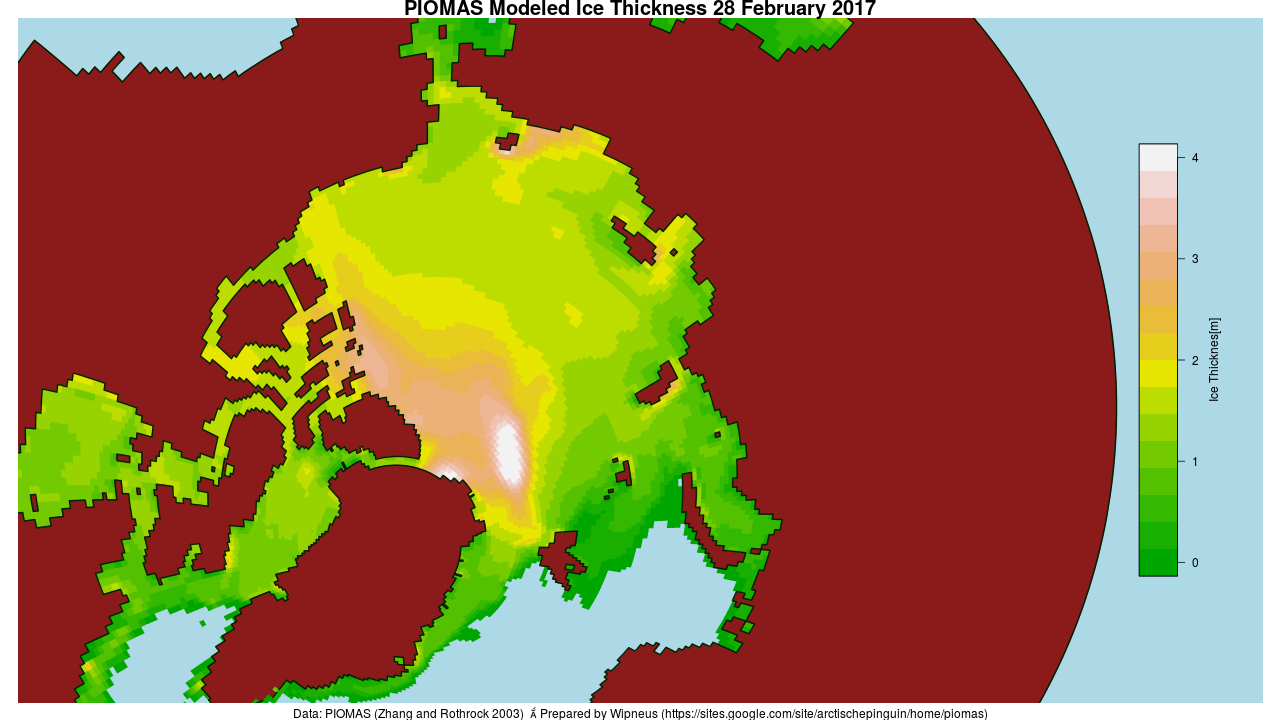
Here’s the PIOMAS gridded thickness map for February 28th:
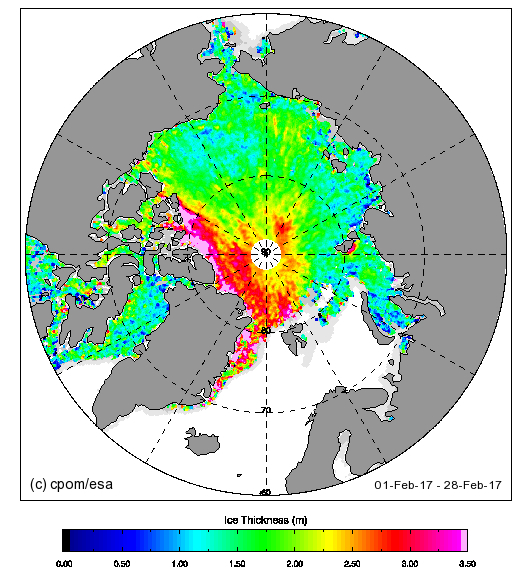
whilst here’s the latest CryoSat-2 thickness map:
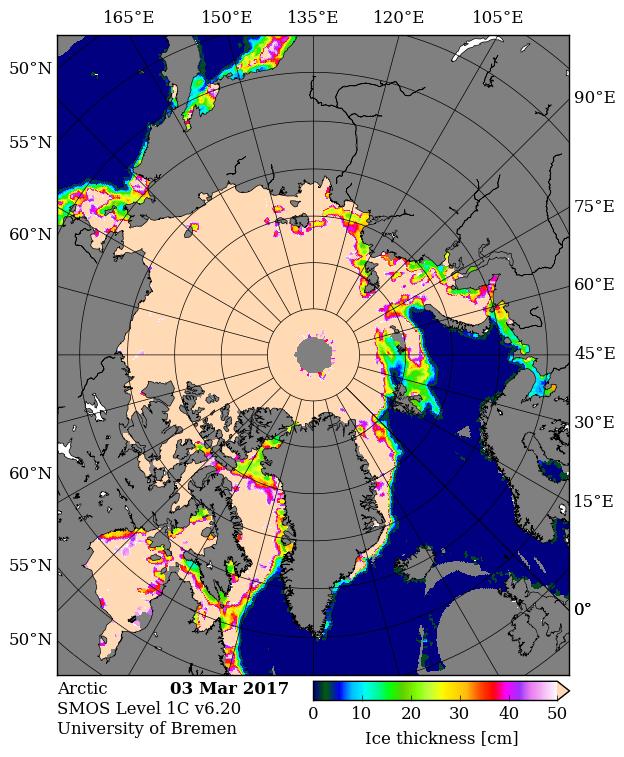
and here’s the latest SMOS thickness map from the University of Bremen:
Lars Kaleschke suggests via Twitter this revealing SMOS thickness animation:
@GreatWhiteCon If you want to quantify the recent dramatic #Arctic sea ice decay with SMOS, better use this data pic.twitter.com/UTgDzYWEV7
— Lars Kaleschke (@seaice_de) March 4, 2017
There does seem to be a small patch of slightly thicker ice in the East Siberian Sea off Chaunskaya Bay, but there’s still a much larger area of sub 0.5 meter thick ice in the Laptev and Kara Seas.
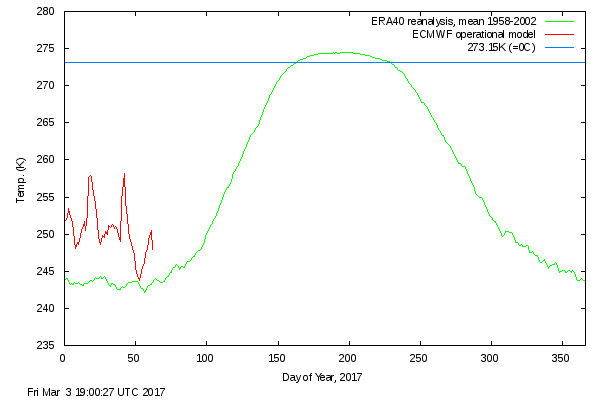
The Danish Meteorological Institute’s temperatures for the “Arctic area north of the 80th northern parallel” graph shows somewhat more “normal” readings in February 2017, but still without falling below the ERA40 climatology this year or in 2016:
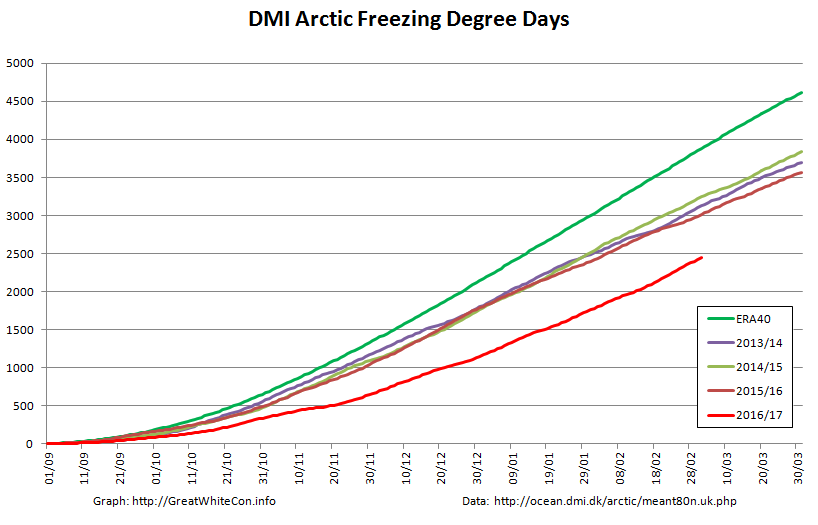
The graph of cumulative Freezing Degree Days (FDD for short) is still far below all previous years in DMI’s records going back to 1958:
Finally, for the moment at least, here’s the high resolution AMSR2 Arctic sea ice area and extent:
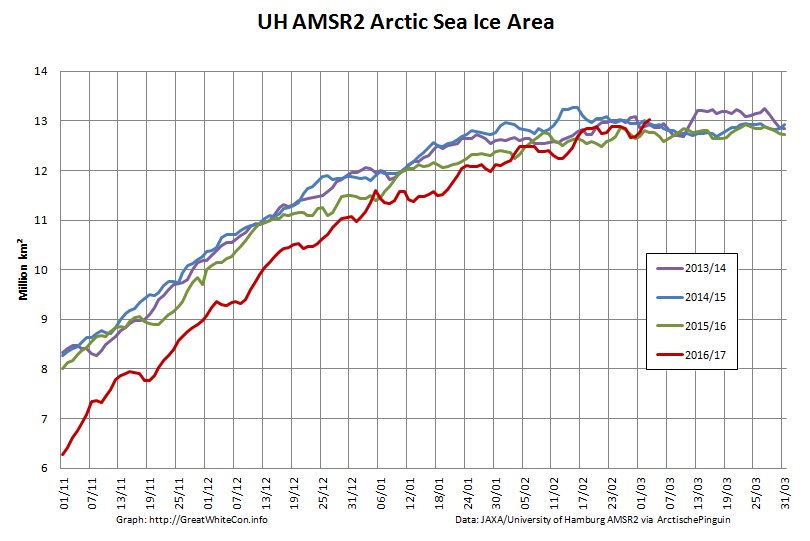
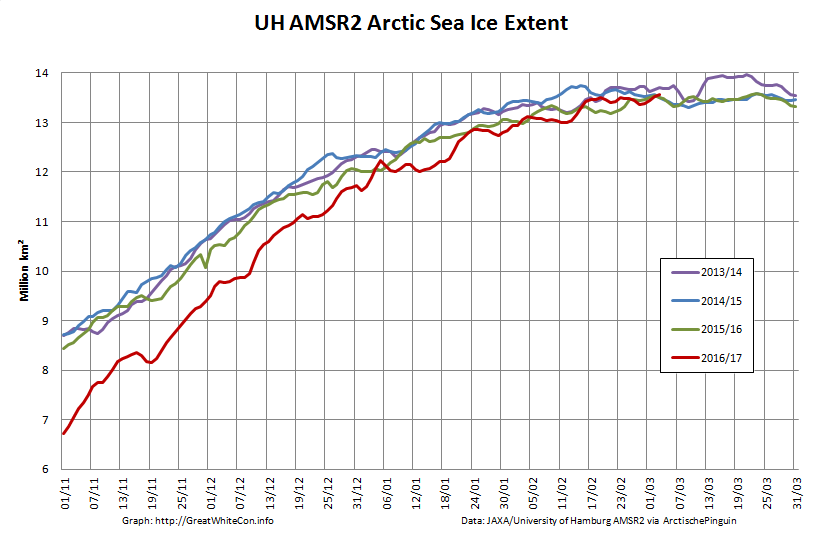
I’m going to have to eat some humble pie, or crow pie as I gather it’s usually referred to across the Atlantic, following my tentative “2017 maximum prediction” a couple of weeks ago. Both area and extent posted new highs for the year yesterday, with area creeping above 13 million square kilometers for the first time this year.
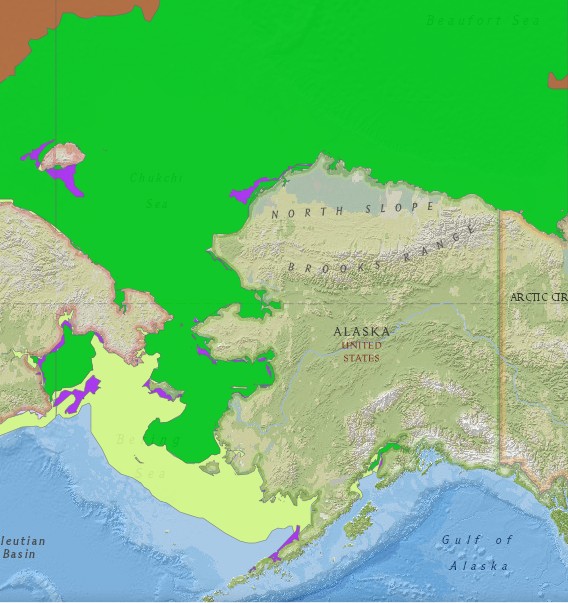
Commenter Michael Olsen suggests that “thicker ice being pushed into the Alaskan and Russian parts of the Arctic Ocean”. Here’s some evidence:
The United States’ National Weather Service current sea ice stage of development map for Alaskan waters:
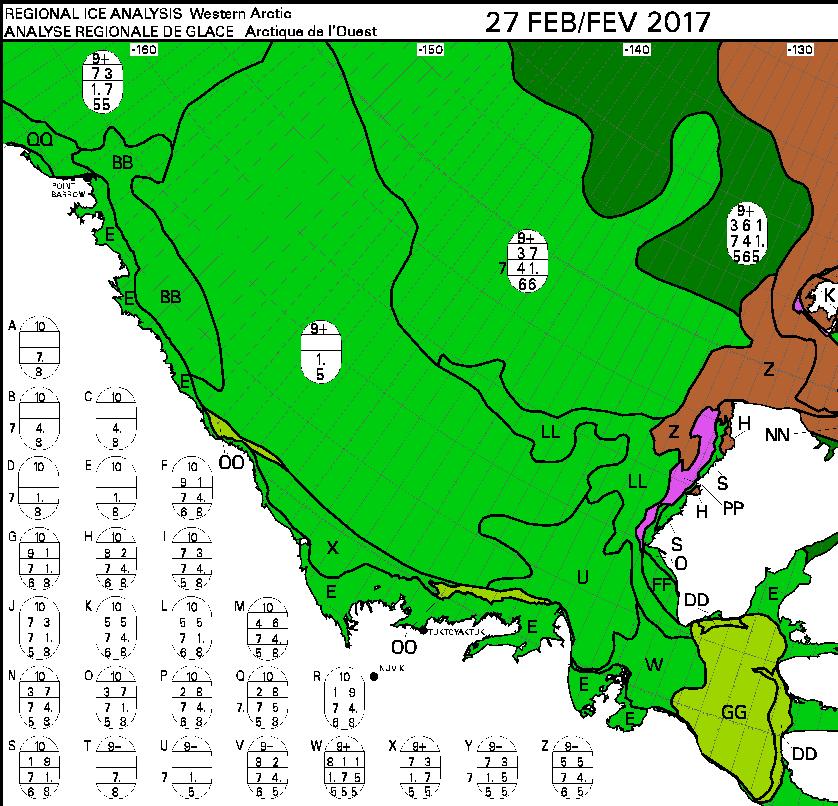
This week’s Canadian Ice Service sea ice stage of development map is expected later today, so for now here’s last week’s:
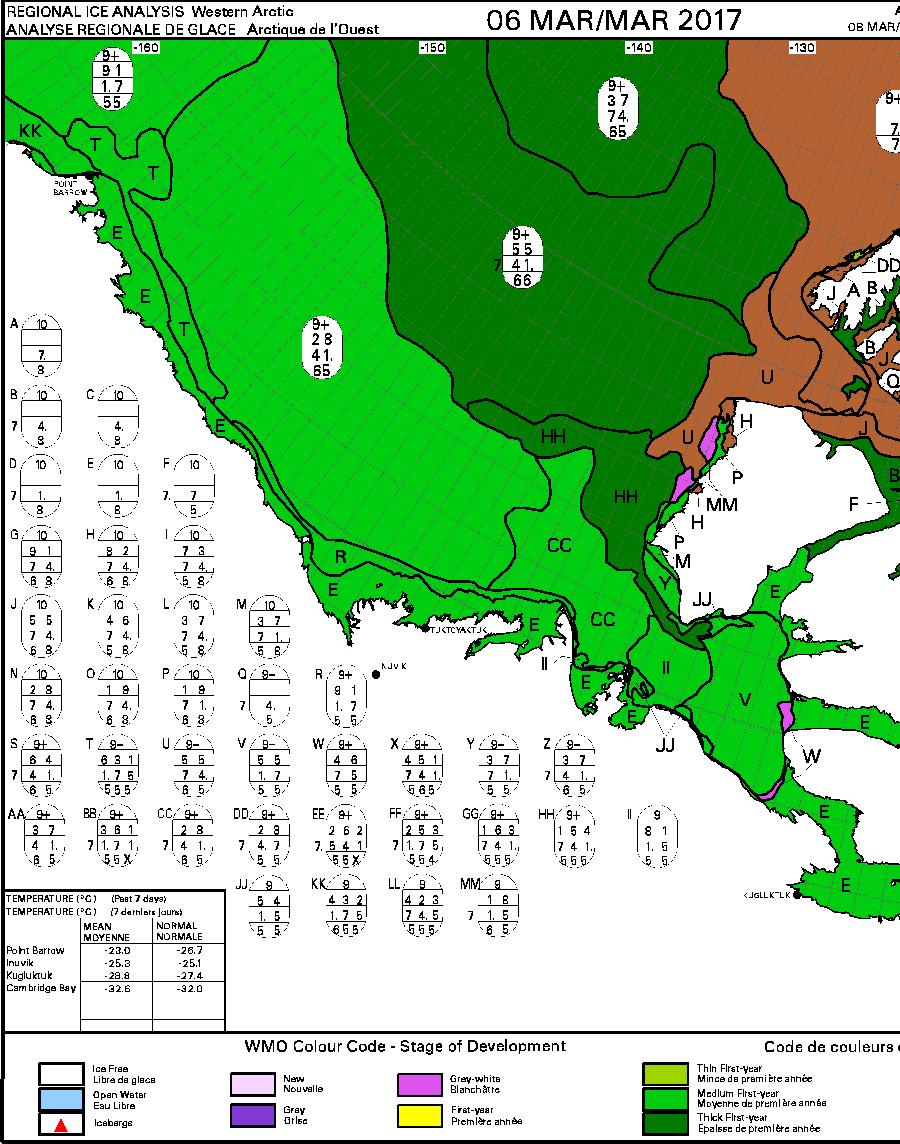
and here’s the latest version:
Similarly this week’s Russian Arctic and Antarctic Research Institute ice chart is expected soon has been published:
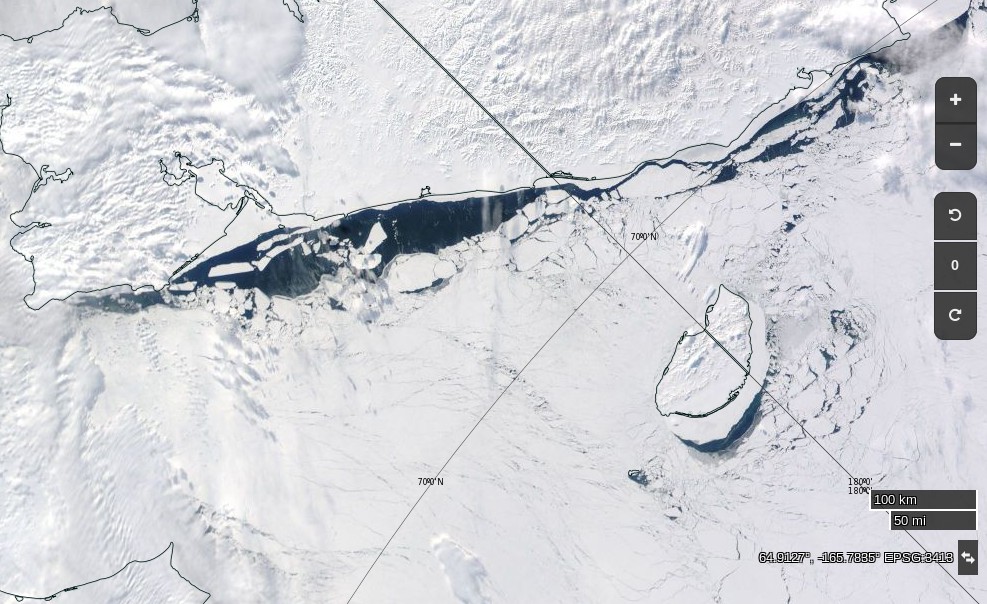
Especially for Michael, a visual image of all the “thicker ice [that’s been] pushed into the Russian parts of the Arctic Ocean” courtesy of the nice folks at NASA:
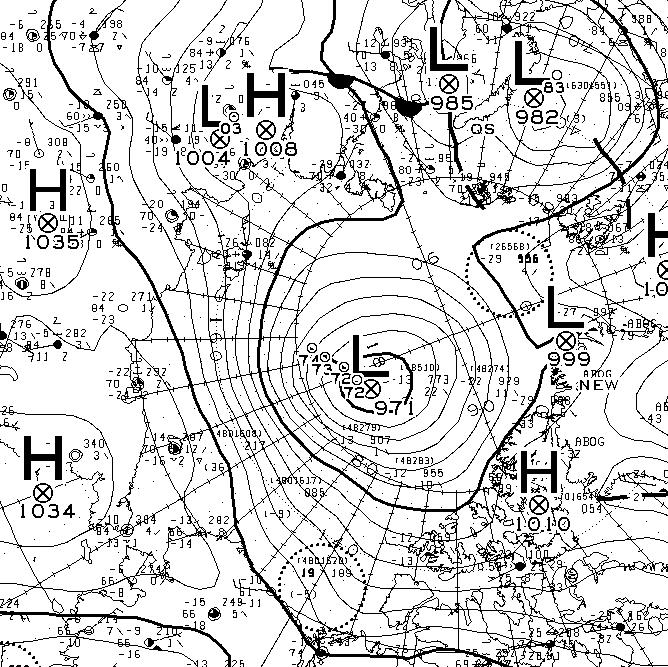
Yet another strong Arctic cyclone has been battering the sea ice in the Arctic Basin. According to Environment Canada this one bottomed out at 971 hPa at 06:00 UTC today.