This is the Great White Con version as opposed to the NOAA version published during the Fall AGU conference earlier this week, although there is some overlap.
Hot off the presses, here’s how Arctic sea ice age has progressed over the last year and a bit:
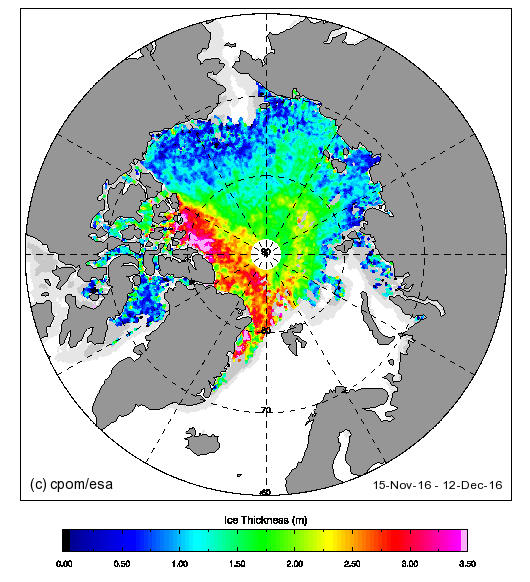
The 4 and 5 year old ice looks to be edging away from the area north of the Canadian Arctic Archipelago towards the Fram Strait. Here’s the current CryoSat-2 Arctic sea ice thickness map:
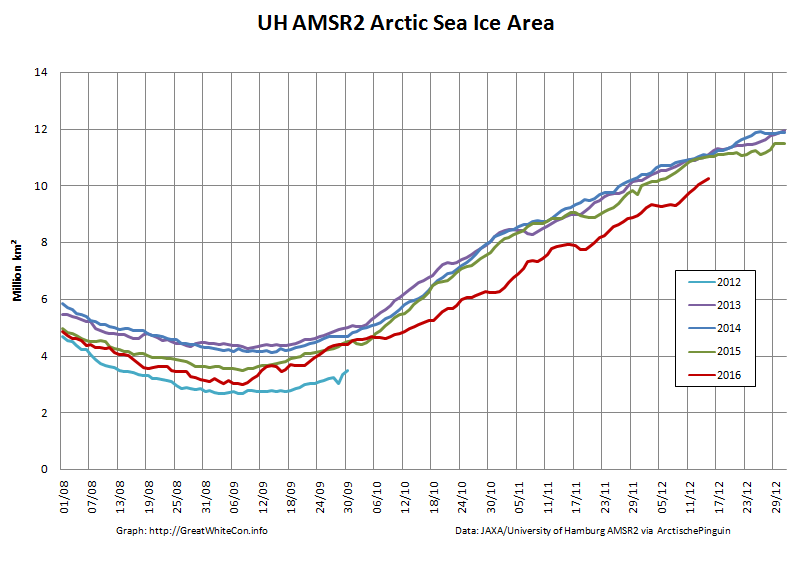
Almost no ice over 2 meters thick to be found in the Beaufort sector or anywhere on the Siberian side of the Arctic. Here’s the current AMSR2 Arctic sea ice area graph:
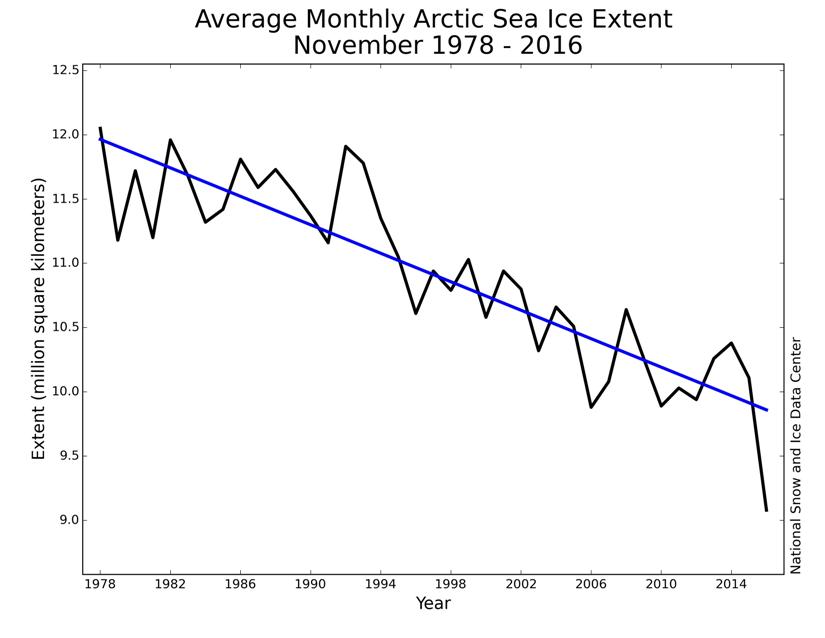
Lowest for the date in the satellite record. Here’s the NSIDC’s long term trend in November sea ice extent:
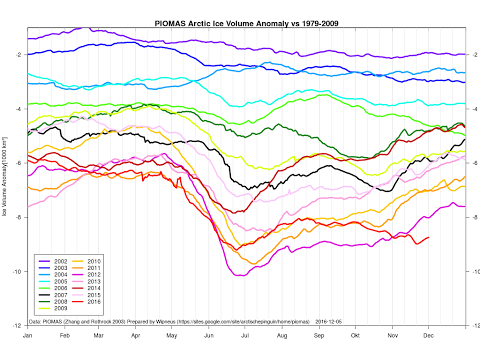
Act 1 of a 3 act play according to Don Perovich at AGU. Here’s the current PIOMAS Arctic sea ice volume anomaly graph:
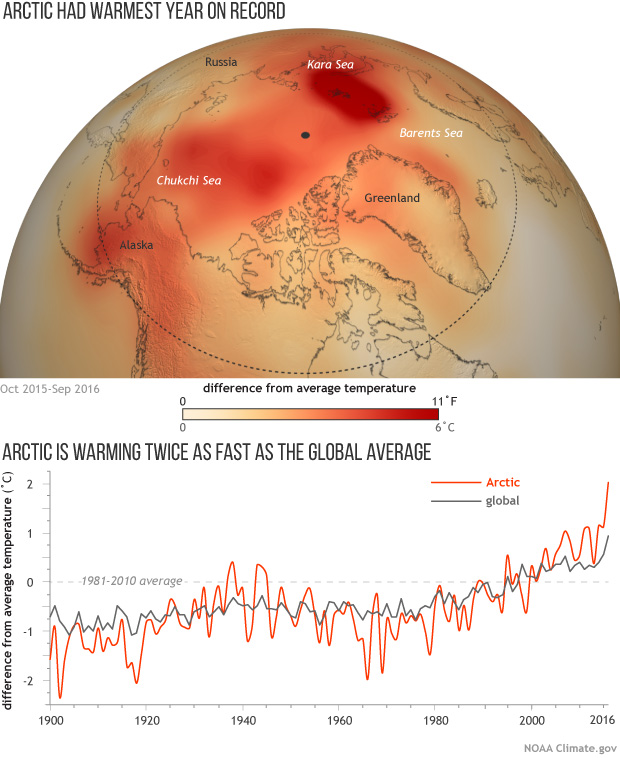
Lowest for the date in the satellite record. Here’s NOAA’s Arctic and global surface temperature graph:
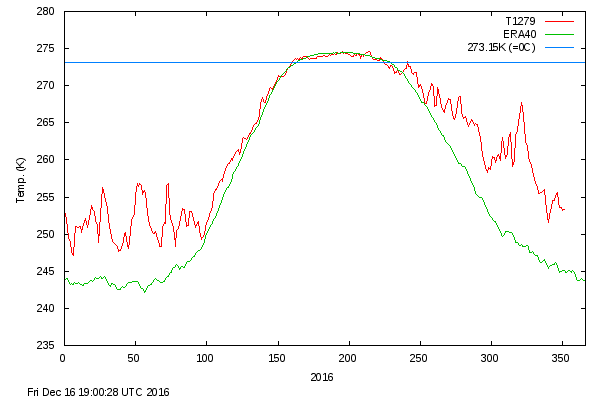
Warmest in a record going back to 1900. Here’s the current DMI >80N surface temperature graph:
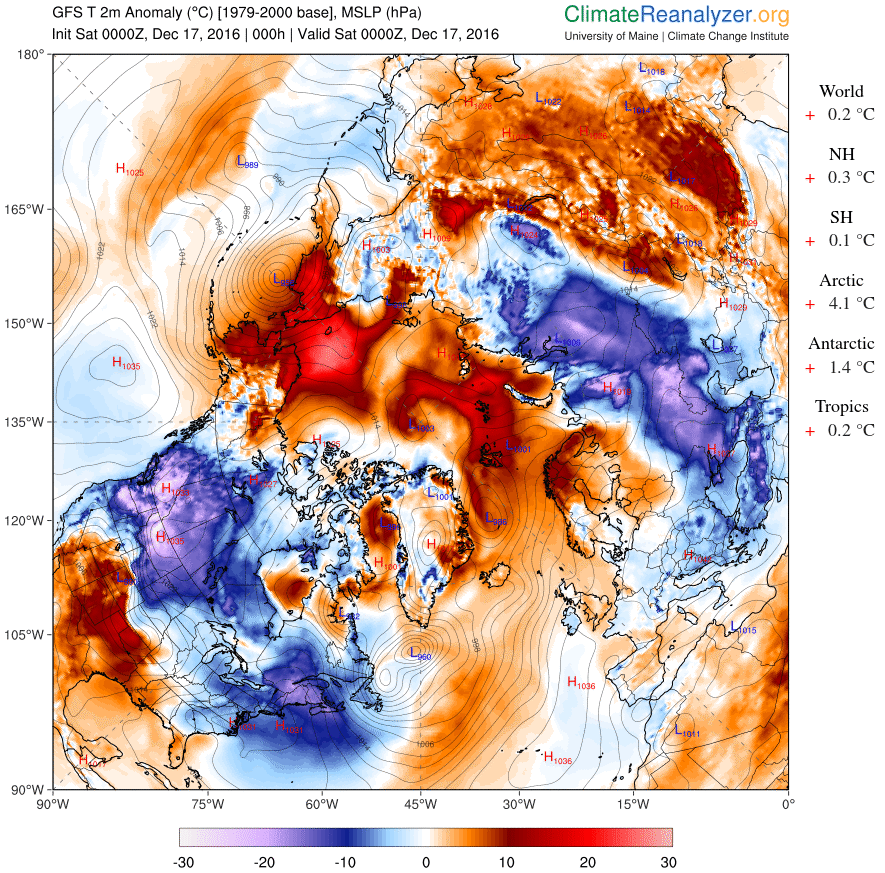
and here’s the current Arctic surface temperature anomaly map:
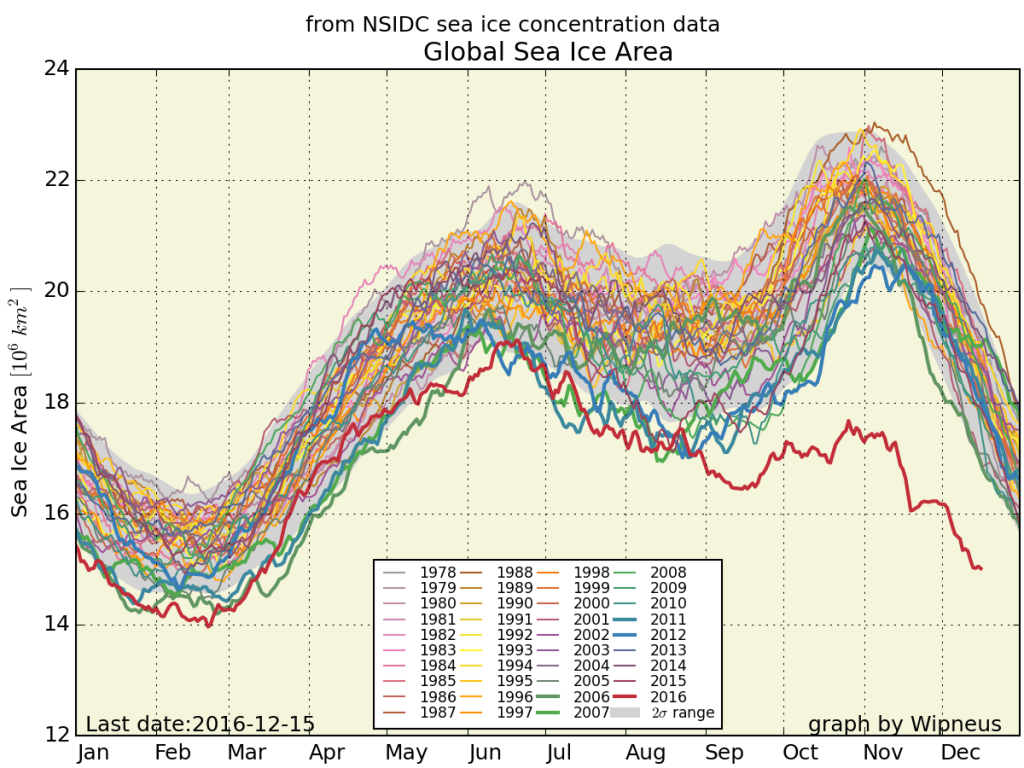
Finally, for the moment at least, here’s global sea ice area just for good measure:
Need I say more? How about this:
Ice has no agenda. It just melts.
Out of the labs and into the streets?
good work Jim, I have been following Neven for 3 years and visiting your site often as I can, although much of your interesting graphics are appreciated to be found at ASIB. I recall, if not mistaken, when you announced your blog opening on ASIB. I have followed the science to learn, be informed and up to date. All are accomplished by Great White Con and ASIB. Thank you for your clarity with documentation. Truth is becoming a reduced commodity, to the extend off purposely broadcasting fake news as real. Your work and Neven’s keeps our train in the proper direction on the correct track. Cheers! AlanE
Thanks very much for your kind words Alan.
Rest assured that we will continue to “clarify” the “post-truth” of “the forces of darkness”!
See in particular our latest article.
Umm… in your AMSR2 Arctic sea ice area graph, why does 2012 truncate C30/09?
Because the University of Hamburg still haven’t converted the raw data from the AMSR2 instrument into gridded concentration format for the end of 2012.
It’s not as though I didn’t ask them nicely!
https://forum.arctic-sea-ice.net/index.php/topic,1611.msg90943.html#msg90943
Your arctic/global temperature curve shows clearly that the Arctic amplifies global trend both cooler and warmer conditions and that the top round 1940 mimics recent warming although at a bit higher temperature. Shouldn’t we wait a few years to see what happens? Snow is pling on the Greenlands higher glaciers because of wetter conditions. What will that implicate later on?
I’m sure Jim will answer your question himself, but here is something to be going on with.
In July 2016, an article in Geophysical Research Letters examined the Mass Balance progression on the Greenland Ice Sheet. It may go some way to answering your question…
http://onlinelibrary.wiley.com/doi/10.1002/2016GL069666/full
Additionally, the Executive Summary from the 2016 NOAA Arctic Report Card stated that…
“Ice on land, as represented by the Greenland Ice Sheet, saw a continuation of the overall increasing melting trend in 2016, with enhanced melt occurring in the southwest and northeast regions. The onset of surface melt ranked 2nd (after only 2012) over the 37-year period of satellite record (1979 – 2016). The duration of the melt season lasted 30-40 days longer than usual in the northeast and 15-20 days longer along the west coast, compared to the 1981-2010 average. Consistent with the spatial distribution of melt anomalies, the largest area of relatively low albedo (a measure of surface reflectivity) was located along the southwest coast, reaching down to ~20% below the 2000-2009 average.”
The Executive Summary can be found here…
http://www.arctic.noaa.gov/Report-Card/Report-Card-2016/ArtMID/5022/ArticleID/270/Executive-Summary
What Bill said, plus recent Arctic temperatures are higher than “around 1940”
In addition Greenland surface mass balance isn’t at all the same thing as ice mass. See this graphic from the Arctic Report Card:
Temperatures in the Arctic are rising yet again:
Here’s why:
Due in large part to a deep low pressure system off eastern Greenland warm are is being transported all the way from the Gulf of Mexico to the North Pole!
As a consequence the sea ice area on the Atlantic periphery reduced enough to cause Arctic wide sea ice area to fall yesterday:
Air temperature at buoy 300234064010010 near the North Pole has now reached zero degrees Celsius:
The NSIDC’s 5 day averaged Arctic sea ice extent is now showing a one day decline:
as has DMI >80N surface temperature:
Having documented in detail the periodic appearance of Santa’s secret summer swimming pool, we cannot help but wonder if Santa is currently cooling off after last night’s exertions in a hastily constructed secret (winter!) solstice swimming pool:
Here’s a close up view courtesy of Sentinel SAR via Polarview:
Over the last few days the sea ice edge has retreated a considerable distance north of Franz Josef Land and Severnaya Zemlya:
Here’s the associated change in sea ice area in the Central Arctic Basin:
According to the Norway Ice Service the Svalbard sea ice area is currently the lowest for the date in their records going back to 1967:
On the last day of 2016 Arctic sea ice extent is still lowest for the date in the satellite era, according to JAXA at least:
Here’s an animation of sea ice concentration on the Atlantic side of the Arctic for the refreeze thus far:
Note in particular the effect of the sequence of storms that have attacked the ice edge over the last few months. This SMOS thickness map reveals how thin the recently refrozen sea ice on the Atlantic side still is: