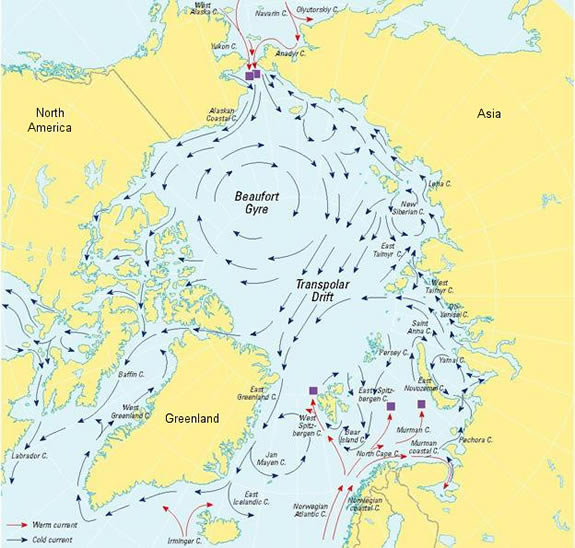
According to the US National Snow and Ice Data Center, the Beaufort Gyre is:
A clockwise circulation (looking from above the North Pole) in the Beaufort Sea, north of Alaska. This circulation results from an average high-pressure system that spawns winds over the region.
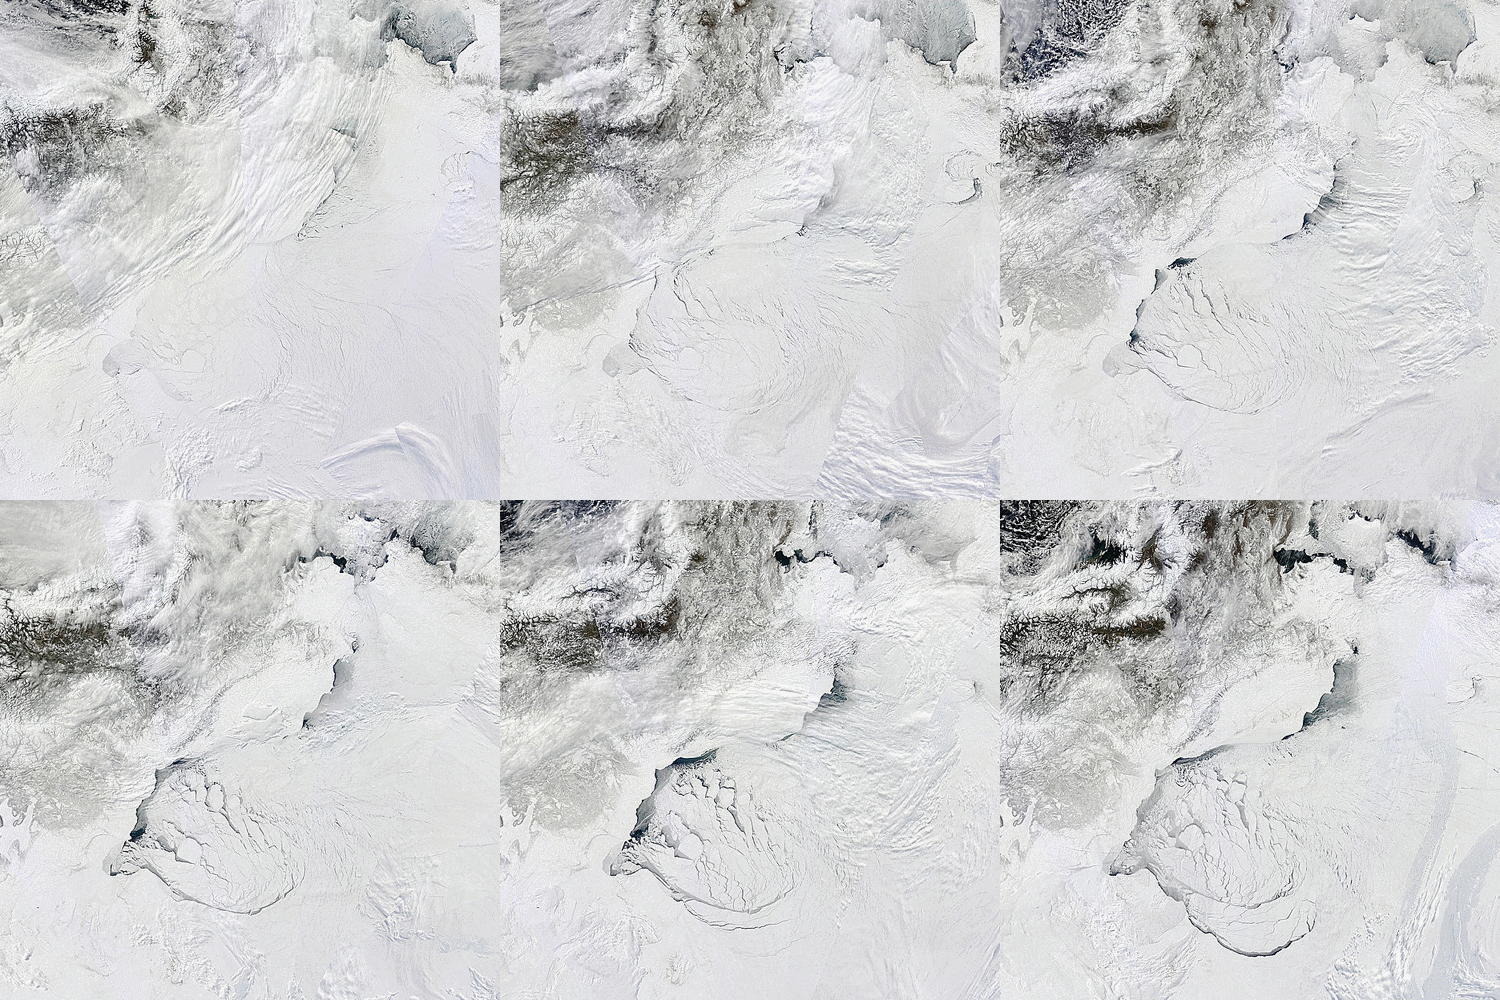
Such a high pressure system has been in place over the Arctic Ocean for a few days now, and the effect of the clockwise circulation on the sea ice in the Beaufort Sea is already evident in these recent satellite images:
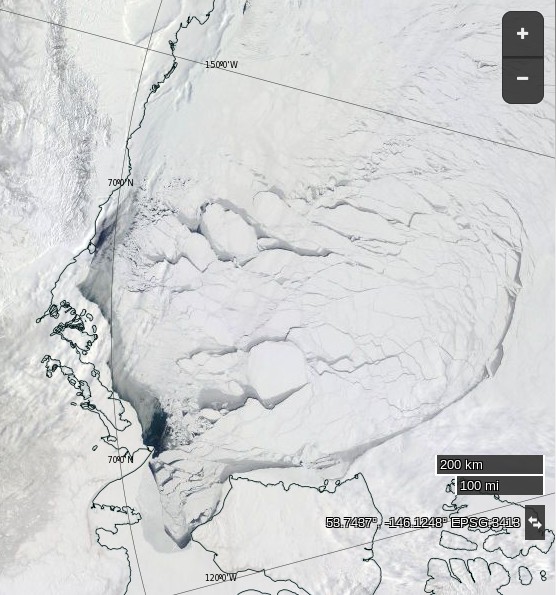
as well as in this animation of sea ice movement since February:
The high pressure is forecast to continue for several more days. Here’s the GFS forecast for April 20th, courtesy of MeteoCiel:
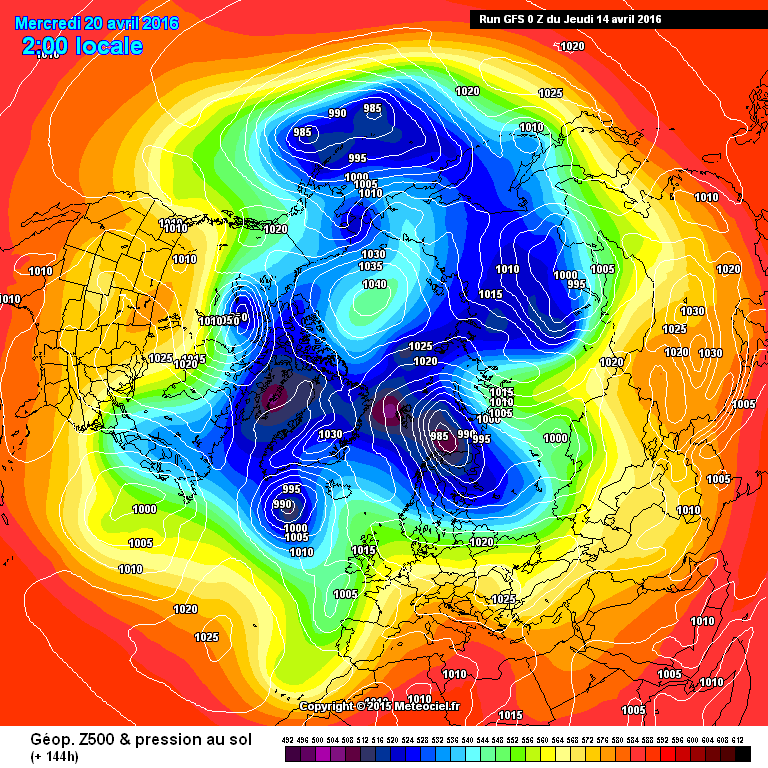
which shows a large system with a central pressure of 1040 hPa still sitting over the Northern Beaufort Sea. Next here’s an animation from the US Navy which forecasts ice thickness until April 19th:
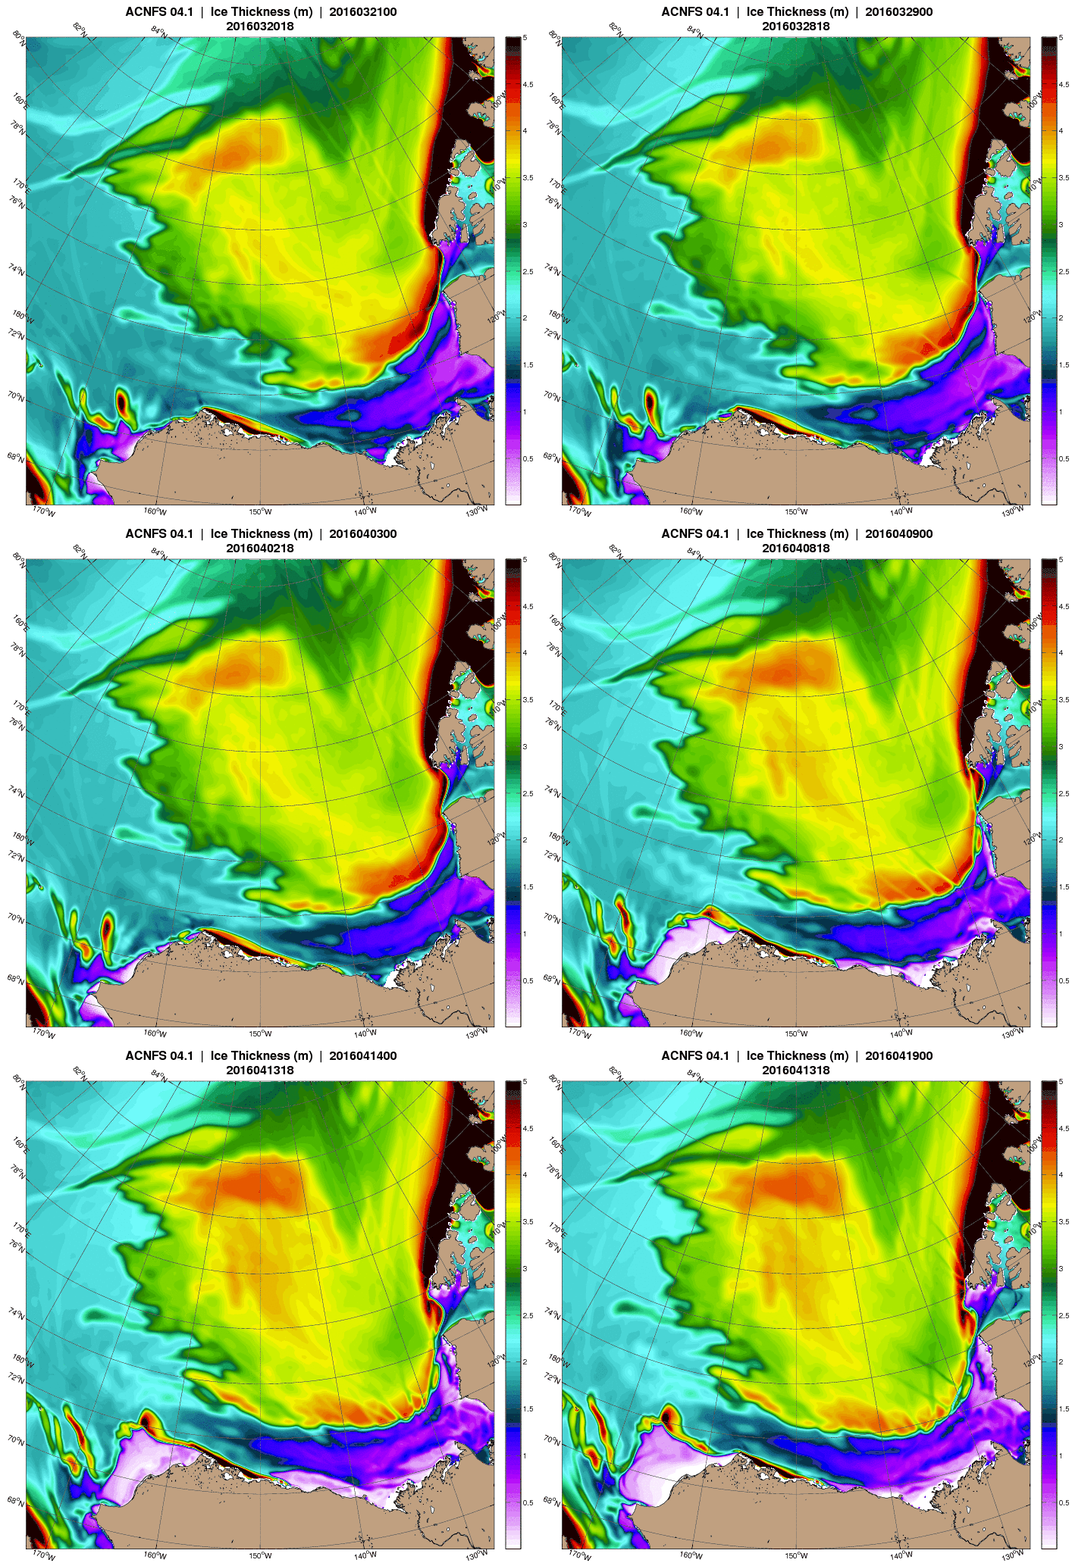
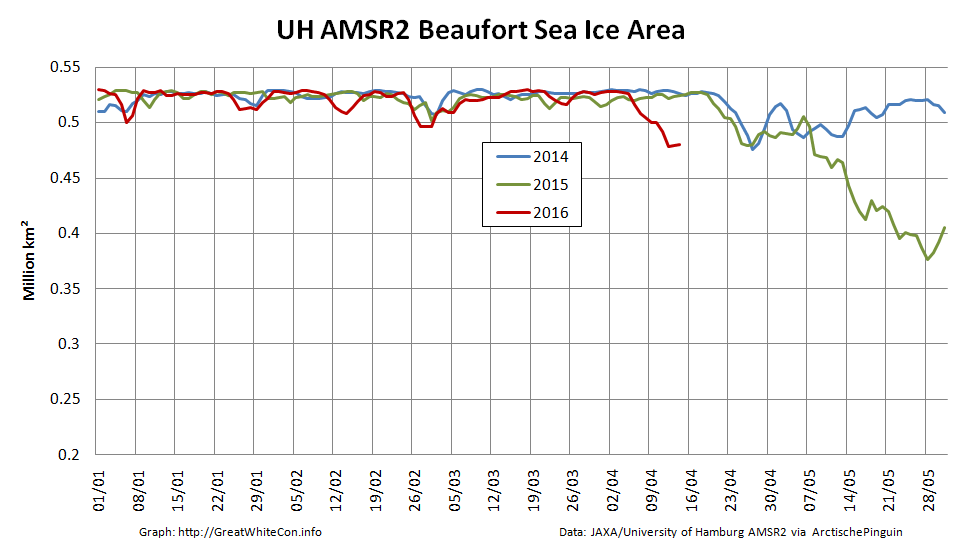
Note in particular the large area of open water forecast to be produced in the Chukchi sea off Barrow, Alaska by the end of the period. The continuing clockwise winds have already started reducing the area of sea ice in the Beaufort Sea at an unusually early date:
Amongst other things we’ll be keeping a close eye on the ice area in the Chukchi Sea over the next few days. The sun is already starting to bathe that area of our planet with its rays, and open ocean soaks up that heat much more readily than bright white ice.
Here’s an animation of the effect on sea ice of the Beaufort Gyre in overdrive from Neven at the Arctic Sea Ice Blog:
Notice how towards the end of the animation another huge part of the ice pack, north of the Canadian Arctic Archipelago is pulled into the Gyre. This is mostly multi-year ice.
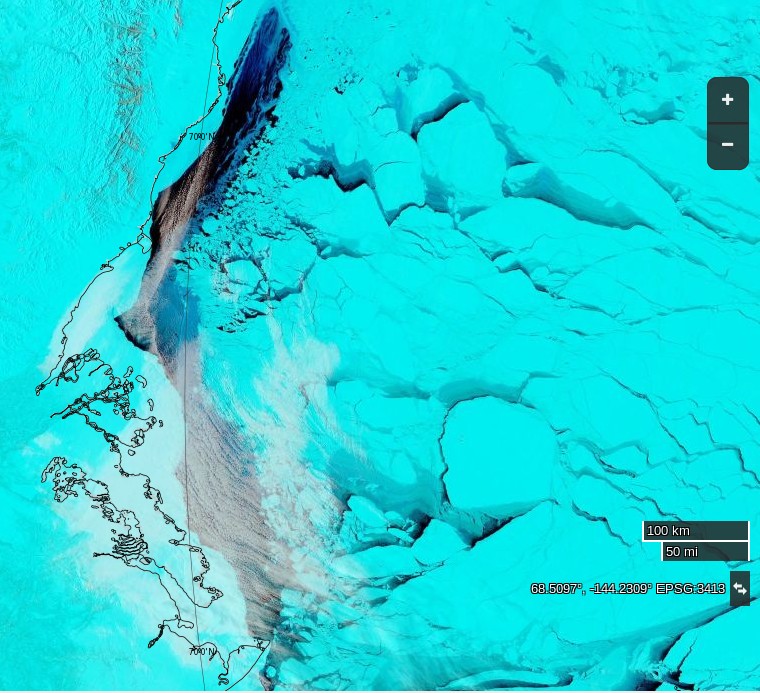
Here also is a MODIS image of the Beaufort Sea processed by A-Team at the Arctic Sea Ice Forum to highlight the areas of new ice:
The Navy’s forecast seems to be panning out so far. Sea ice area in the Beaufort Sea has increased somewhat over the last 2 days, whereas in the Chukchi Sea:
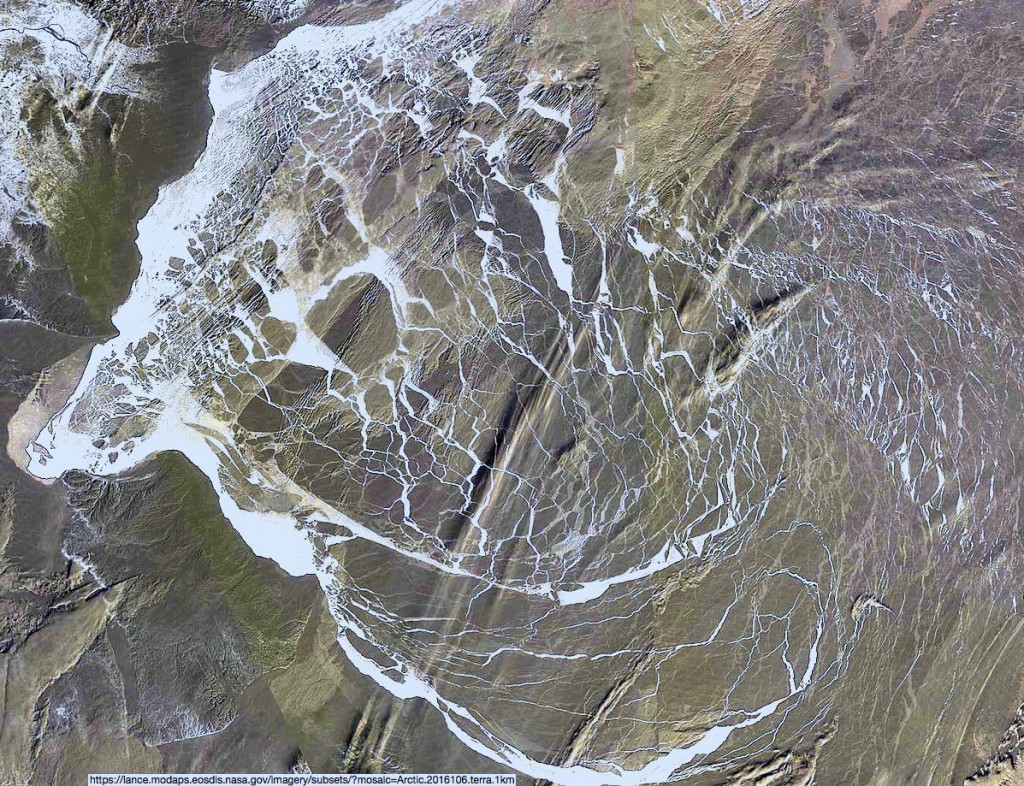
A different view of the Beaufort Sea today, this time showing brightness temperature using the 89V channel of the AMSR2 instrument on the Japanese Shizuku satellite:
Although fresh ice has been forming in the gaps in the sea ice created by the current high pressure system, this image reveals how thin that ice still is in many places.
April 19th has now been and gone, and the high pressure over the Beaufort Sea remains. According to ECMWF it will finally start to drift off over the Canadian Arctic Archipelago by April 26th:
Here’s the US Navy’s current prognosis for Beaufort Sea ice thickness on April 24th:
Note the entrance to the main route through the Northwest Passage via McClure Strait opening up, together with renewed movement away from the eastern Beaufort Sea coast just as the flow of (comparatively!) warm water from the Mackenzie River starts to increase:
Here’s an updated video of the effects of the Great Arctic Anticyclone of 2016:
Here’s the latest Beaufort Sea ice area update:
It looks as though, unlike earlier in April, the large polynya created by the winds from the continuing high pressure system is no longer refreezing. Next here’s the US Navy’s latest ice drift forecast for April 29th, after which the relentless pressure on the ice dies away quite quickly:
Finally for today, here’s the GFS surface temperature forecast for the start of May:
As the winds leave the Beaufort Sea above zero temperatures arrive.
Further to the east, Pangnirtung Nunavut on Baffin Island hits 10 C and smashes April heat record.
http://www.cbc.ca/news/canada/north/pangnirtung-heat-record-1.3553971
There’s still no evidence of refreezing from AMSR2, so I’ve rescaled the graph this morning: