Monthly Archives: August 2015

Barrow Battered By Big Waves

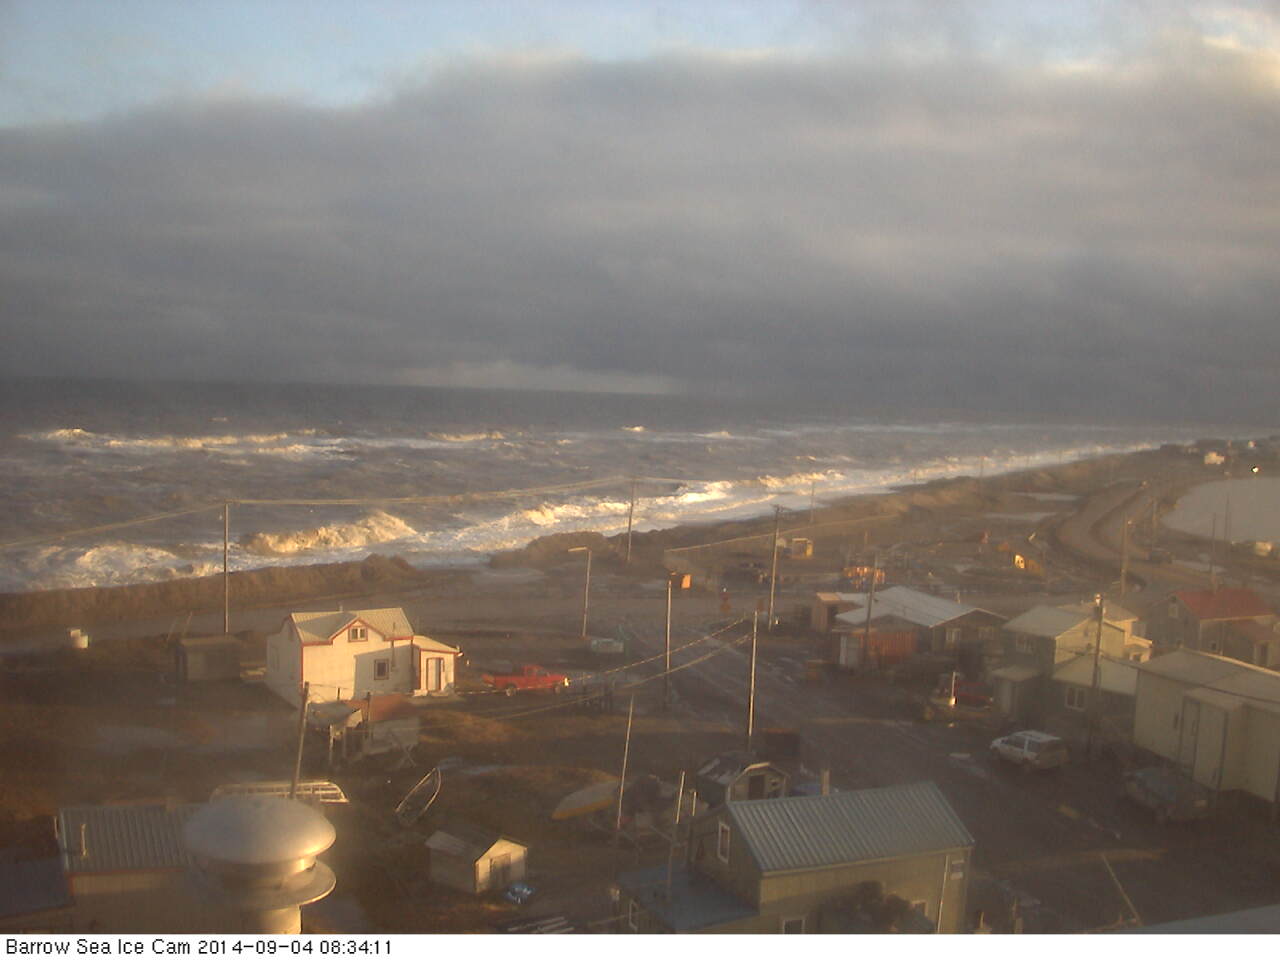
The first big waves of 2015 have been battering the town of Barrow, Alaska today and they’ve already broken through the coastal defences. Firstly take a look at the view from the Barrow webcam during a less damaging storm on September 4th last year:

BarrowCam_20140904_0834

Now take a look at the view from the same camera earlier today, and play “spot the difference” with me:

BarrowCam_20150827_1749

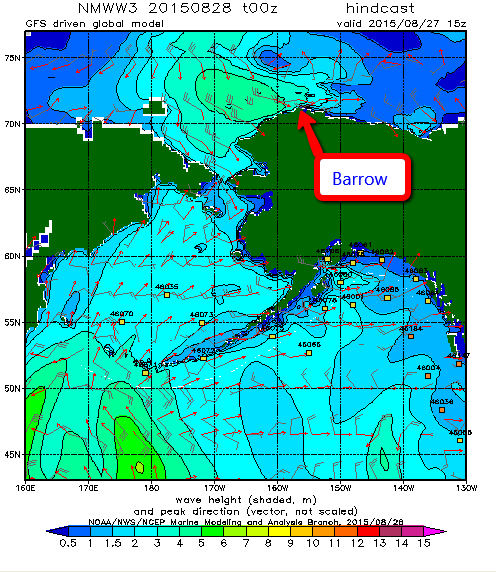
The cause of the flooding that is all too visible is a cyclone that’s been whirling around in the Chukchi Sea for a while, and here is a WaveWatch III “hindcast” of what the resultant winds have created in the way of waves. Firstly the “significant wave height”:

alaska_height_20150827_015h

and now the “peak period”:

alaska_period_20150827_015h

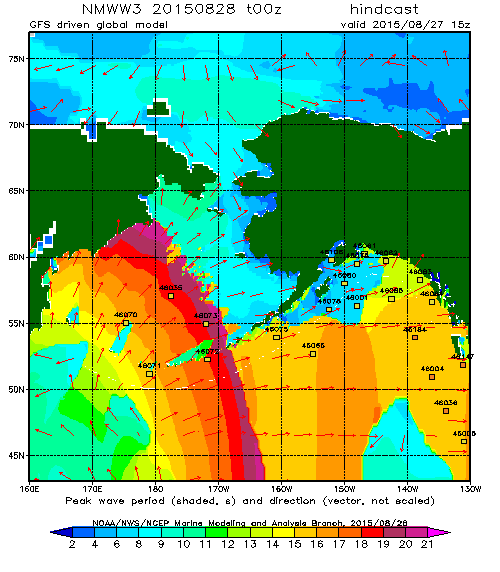
which reveal a swell 4 to 5 metres high with a period of 10 seconds heading directly towards Barrow Beach. According to the Alaska Dispatch News:

Huge, wind-whipped waves crashed onto the shore at Barrow on Thursday, forcing the closure of a nearby road. Westerly winds were gusting up to 50 miles an hour, pushing waves up to the top of the beach and causing some erosion, the National Weather Service said.

The service has issued a coastal flood warning for Barrow until Friday morning, along with a high surf advisory for the western part of the North Slope and a gale warning for much of the Beaufort and Chukchi Seas.

The big surf and flooding, which has covered a road that runs between the ocean and Barrow’s lagoon, is “not terribly unusual” at this time of the year, said Ryan Metzger, a National Weather Service meteorologist in Fairbanks. Fall is a stormy season, and the timing — right around the annual minimum sea ice extent — allows the surf to build and reach shore.

Photograph by Brittni Driver via Alaska Dispatch News

Just in case it’s not obvious from all the pictures, the respective advisory messages point out that:

A COASTAL FLOOD WARNING MEANS THAT RISING SEA WATER THAT CAUSES FLOODING IS EXPECTED. COASTAL RESIDENTS IN THE WARNED AREA SHOULD BE ALERT FOR RISING WATER…AND TAKE ACTIONS TO PROTECT LIFE AND PROPERTY.

A HIGH SURF ADVISORY MEANS THAT LOCALIZED BEACH EROSION IS EXPECTED. PRECAUTIONS SHOULD BE TAKEN TO PROTECT PROPERTY.

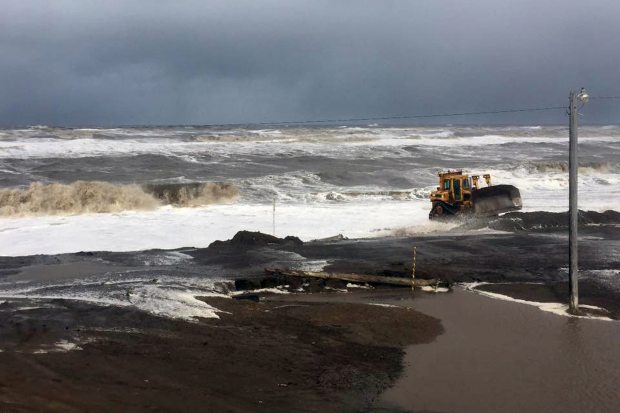
If you’re now wondering what might happen to other areas of the north coast of Alaska in similar circumstances, but with no bulldozer in attendance, here’s an example from Cape Halkett:

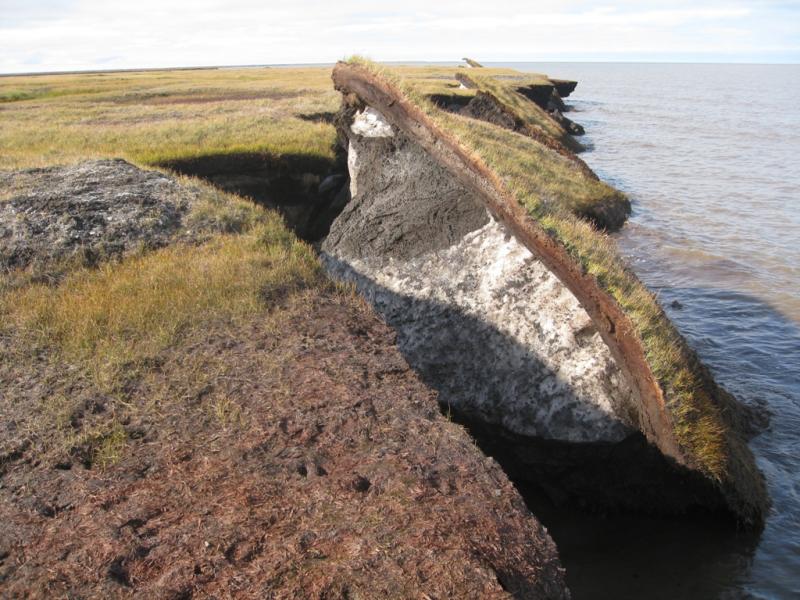
According to to the United States’ Climate Resilience Toolkit:

Thawing permafrost causes coastline collapse on Alaska’s North Slope, which is no longer kept frozen and protected from fall storms by sea ice—the ice now forms later in the season.

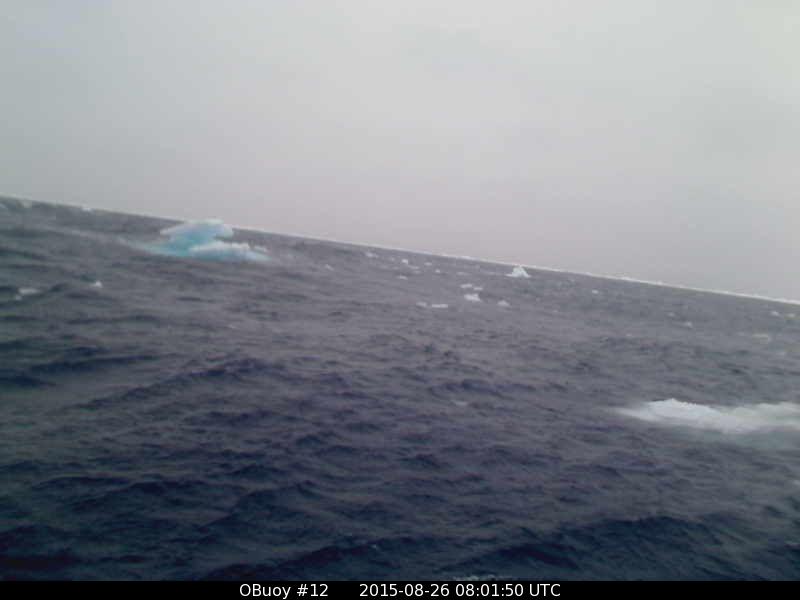
Away from the coast swell from the same cyclone has also been affecting the sea ice north of Barrow, and here’s what a webcam bobbing about on a buoy north of the Chukchi Sea showed as the winds started to build yesterday:

O-Buoy 12 image from August 26th 2015

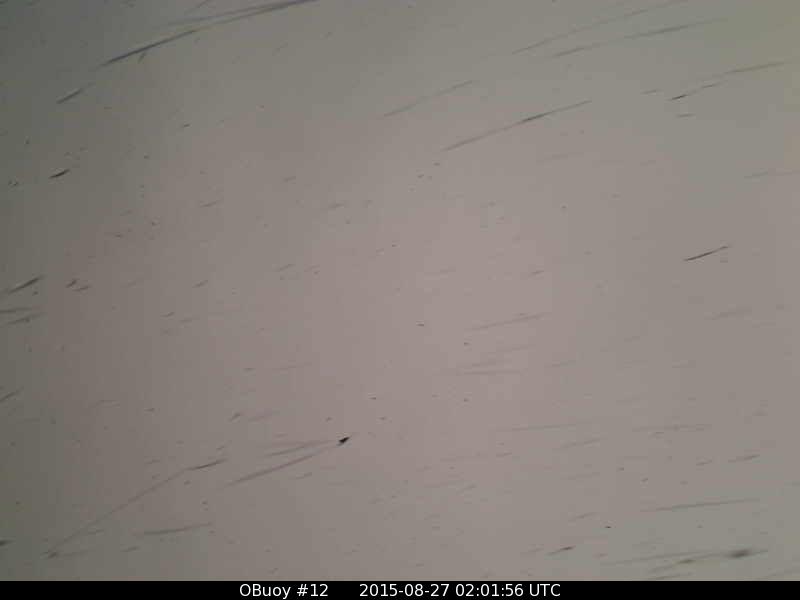
O-Buoy 12 has now tipped over and then ceased transmitting. This is the last picture received, in the early hours of August 27th when the wind speed had reached 13 m/s and the buoy had been moving at over 5 m/s:

OBuoy12-20150827-1

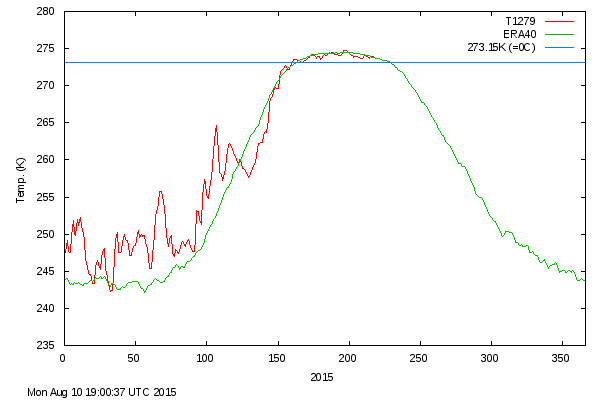
Once upon a time O-Buoy 12 was sat on the same ice floe as ice mass balance buoy 2014G, which has also been free floating for a while. Here’s what it reveals about the temperature of the sea water on August 26th 2015 at 77.56 N, 163.86 W:

2015-08-26_2014G

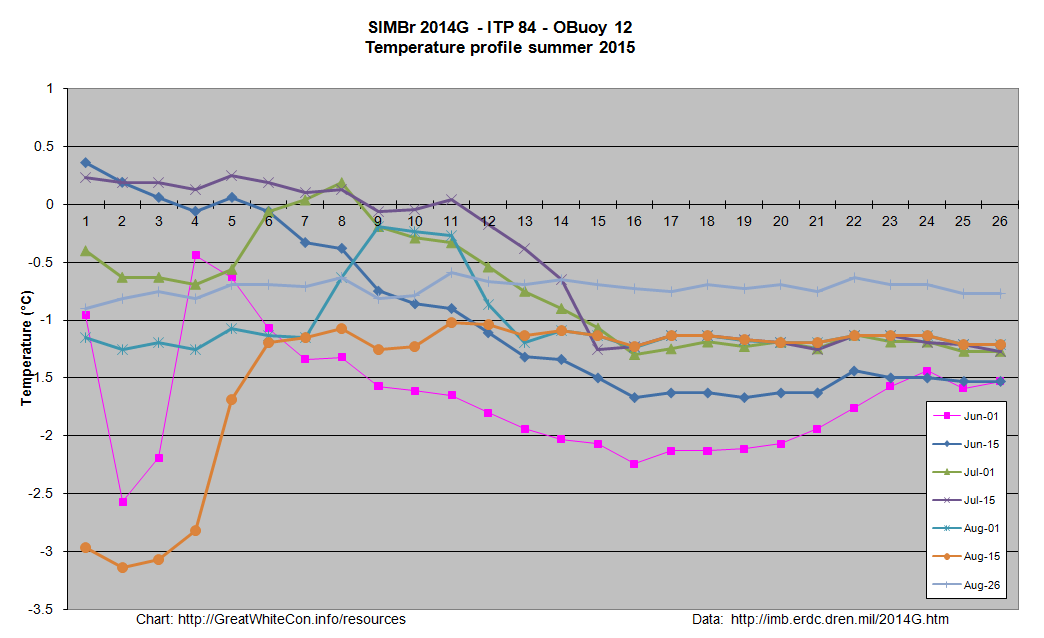
Somewhere in the vicinity of -0.7 °C.

[Edit on 30/08/2015]

O-Buoy 12 has made no further transmissions, and therefore seems to have succumbed to the storm. In addition IMB buoys 2014F and 2013F stopped transmitting on the 26th and 27th of August respectively. Ice mass balance buoy 2014G has survived however, and reports two successive record daily distances travelled:

2015-08-29-2014G-Map

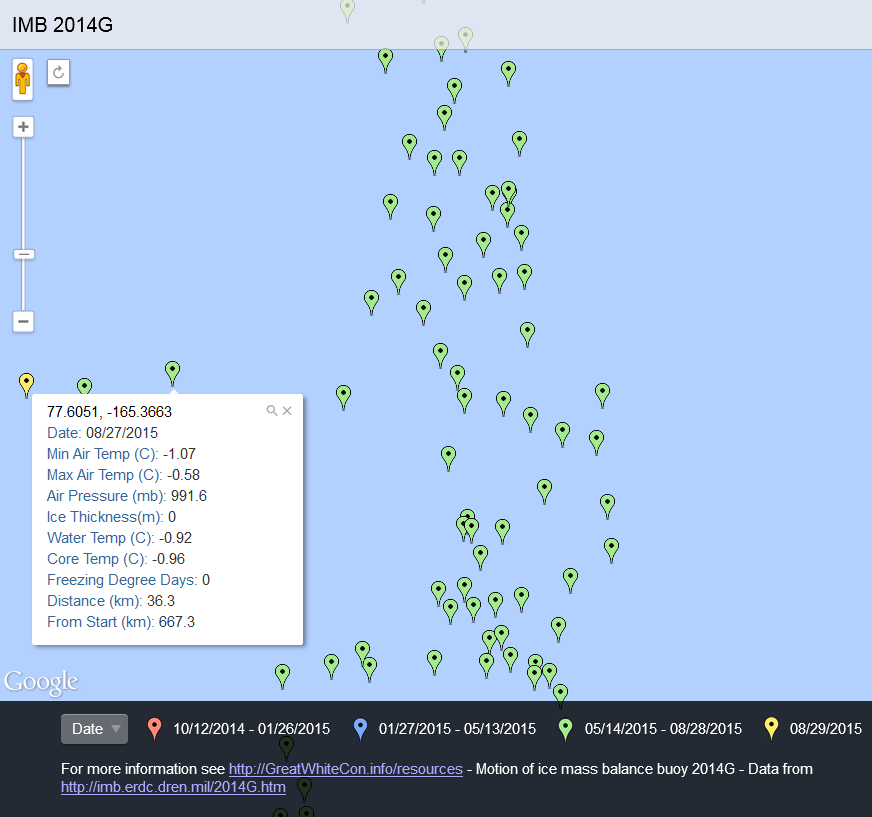
25.6 km on August 26th, followed by 36.3 km on the 27th. After a brief dip during the cyclone water temperature is still around -0.7 °C.

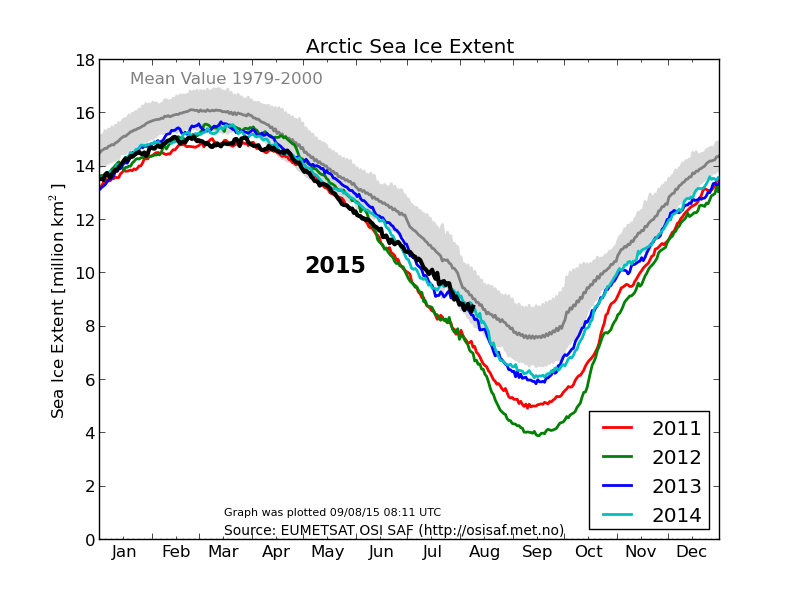
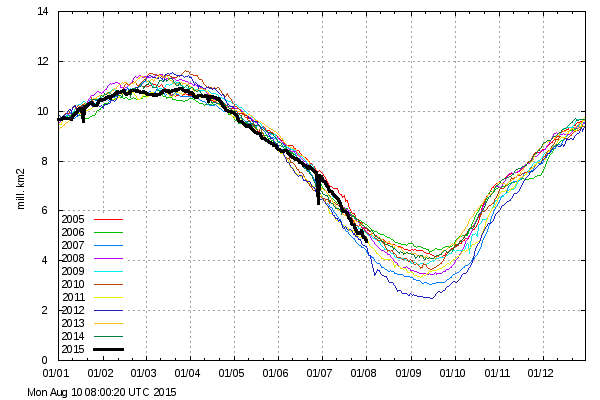
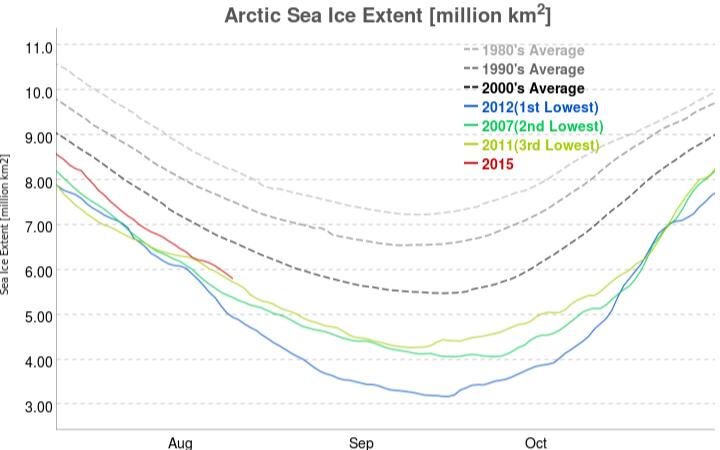
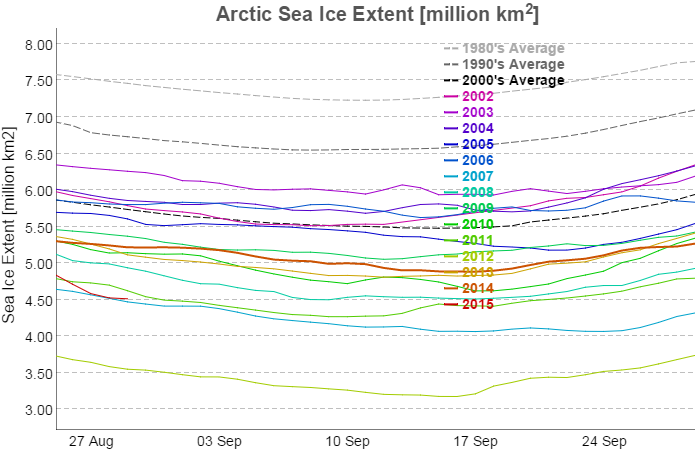
Presumably as a result of the cyclone JAXA Arctic sea ice extent has taken a tumble over the last few days. It has stabilised this morning slightly above 2007 levels:

JAXA-aug29

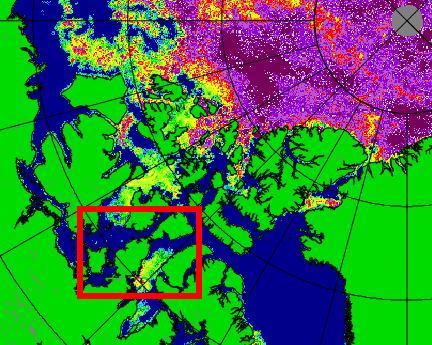
Here is the current AMSR2 Arctic sea ice concentration map from the University of Hamburg, revealing a large potential fetch across the East Siberian, Chukchi and Beaufort Seas should any further cyclones occur in the area over the next few weeks:

AMSR2 Arctic sea ice concentration on August 29th from the University of Hamburg

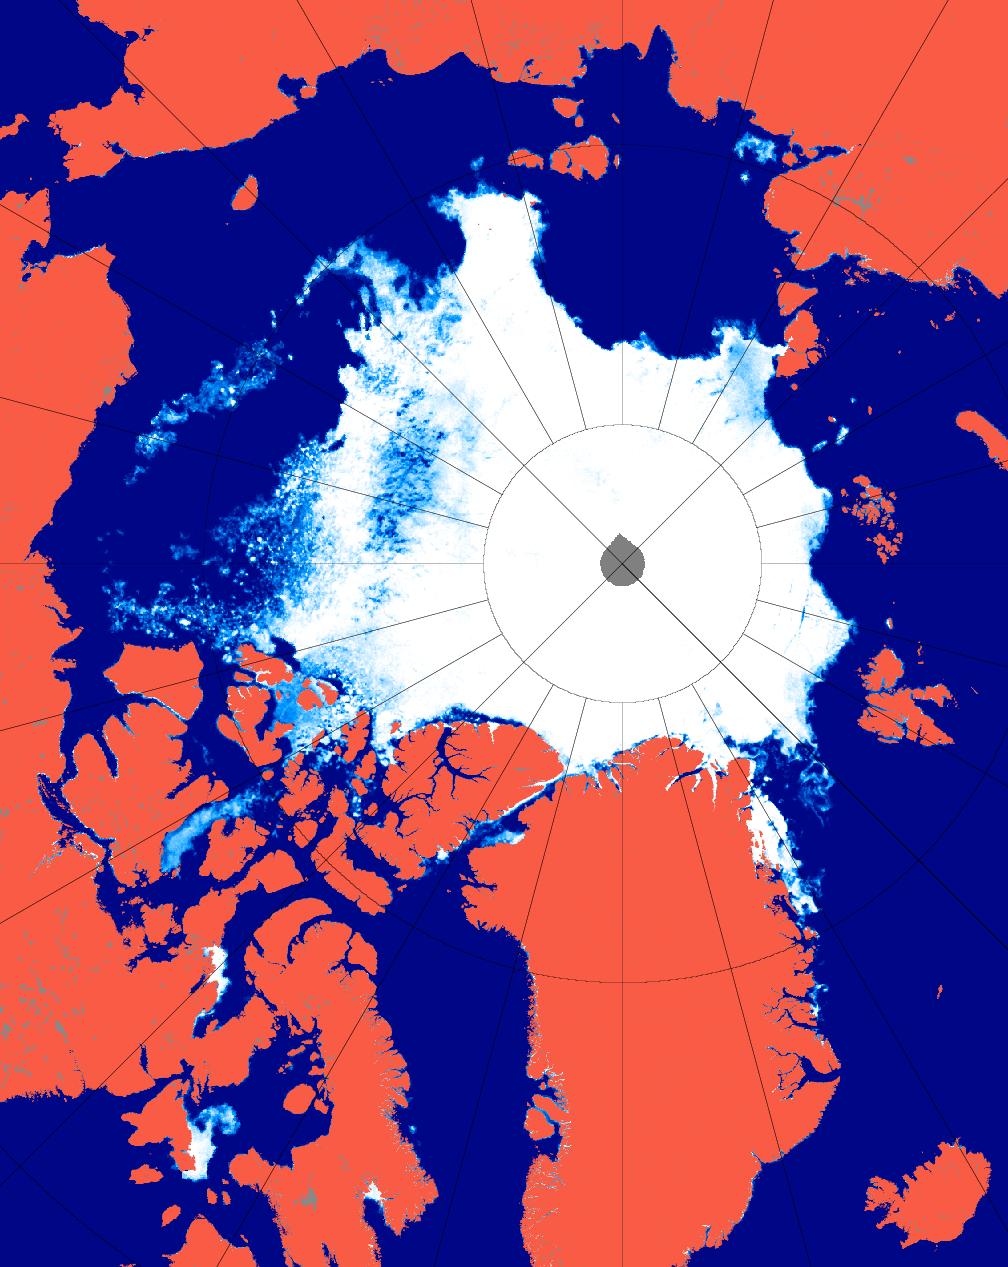
Hence the conditions now exist for an even more damaging swell to be generated before the 2015 minimum Arctic sea ice extent is reached.

Is the Northwest Passage Open Yet?

People keep on posing that question just at the moment. Here’s a typical example from the Arctic Sea Ice Blog this morning:

Albeit not ‘officially’ declared as such, the daily Uni-Bremen chart shows Amundsen’s route is cleared and free now.

Here’s an extract from the “Daily Uni-Bremen chart” referred to, with an apparently “ice free” section of the southern route through the Northwest Passage highlighted:

asi-AMSR2-n6250-20150813-hilite

As we’ve been discussing here recently, the automated passive microwave based satellite Arctic sea ice concentration products can miss ice that’s visible to the naked human eye. Here’s some pictures from the Great White Con Northwest Passage page:

NASA Worldview “false-color” image of the Northwest Passage on August 13th 2015, derived from bands 7, 2 and 1 of the MODIS sensor on the Terra satellite

The Canadian Ice Service sea ice concentration chart for the Queen Maud Gulf on August 13th 2015

Here’s an extract from the NSIDC’s Multisensor Analyzed Sea Ice Extent (MASIE) product (currently for August 12th 2015):

masie_all_r00_v01_2015224_crop

and here’s an extract from an answer I gave to a similar question on the Arctic Sea Ice Forum earlier this morning:

The Canadian Ice Service still have 4-6/10 ice within a whisker of the coast. Would you fancy your chances in amongst that and a bit of a breeze?

The CIS definition of “navigable” is “a criteria of less than 60% ice cover over all sections of the Northwest Passage”. See:

http://ec.gc.ca/glaces-ice/default.asp?lang=En&n=765F63E4-1

and the inset map at:

CIS-NWP-MinConc-2014

The answer to the question posed in the title to this article is therefore currently NO, the Northwest Passage is not open yet, both officially from the CIS and unofficially from any mariner with a sense of self preservation in charge of any vessel that isn’t “ice hardened”. In all the circumstances that answer might change quite quickly though!

[Edit 18/09/15]

The Canadian Ice Service have finally published a close up map of the Parry Channel that doesn’t say “No Analysis”. Here it is:

CIS_Parry_20150917-Crop

There’s still a (narrow!) green path into McClure Strait, so I reckon we can at long last confidently declare the main Northwest Passage to be OPEN!

Arctic Sea Ice Approaching Normal?

According to “Steve Goddard” it is! Hot off the presses over at “Real Science” we are told that:

DMI hasn’t updated their 30% concentration map for 10 days, but their 15% concentration map is just about at the 1979-2000 mean.

DMI-15-icecover_20150809

Ocean and Ice Services | Danmarks Meteorologiske Institut

The melt season has essentially stopped, with very cold air across the Beaufort Sea

[Image redacted – It shows Canada and one corner of the Beaufort Sea]

The usual criminals in the press (Guardian, New York Times, etc.) and government agencies will of course not mention this, because reality and science wrecks their agenda.

unRealScience-Gore-20150810

Gore: Polar ice cap may disappear by summer 2014

I have to admit Steve’s confusing language confused me briefly. The Arctic sea ice concentration and ice type maps from the OSISAF on which the Danish Meteorological Institute base their extent graphs have been updating normally, but I eventually discovered what “Steve”/Tony was on about. On close inspection although the date at the bottom has been updating the 2015 curve on DMI’s 30% threshold Arctic sea ice extent graph currently seems to be stuck on August 2nd:

DMI-30-icecover_20150810

I’ve informed DMI of the problem, but when it might be fixed remains to be seen, since as the DMI web site puts it:

The old plot can still be viewed here for a while.

and as I was just informed they don’t have any resources allocated to keep the “deprecated” 30% service running.

Meanwhile back in real world in the Arctic, DMI temperatures north of 80 degrees are above “normal”:

DMI-meanT_20150810

GFS temperature anomalies look like this:

CCI-T2-Anomaly-20150811

and JAXA 15% threshold Arctic sea ice extent has been dropping at nearly 100,000 km² per day for the last few days:

vishop_extent_20150810