Once again our title for today is inspired by the indefatigable “Steven Goddard”. His latest Arctic themed article on his so called “Real Science” blog is entitled “Trouble Looming For Arctic Alarmists“, and he’s following his usual formula of showing an image or two interspersed with unrelated text. Here’s Tony’s textual take on things, interspersed with our graphic retorts:
Arctic sea ice coverage is nearly identical to 20 years ago:
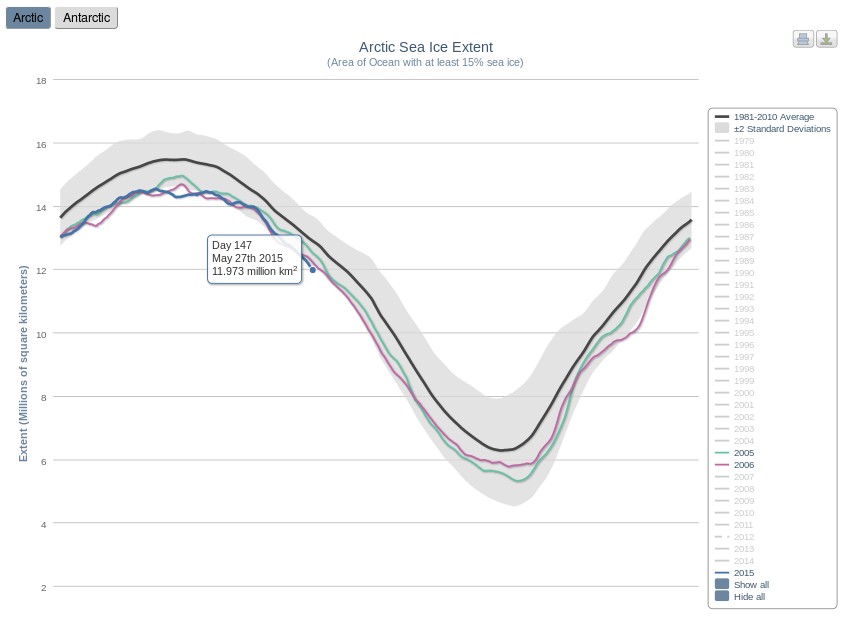
Arctic sea ice is following almost the exact trajectory of 2006, which had the highest summer minimum of the last decade.
The Beaufort Sea is full of very thick ice.
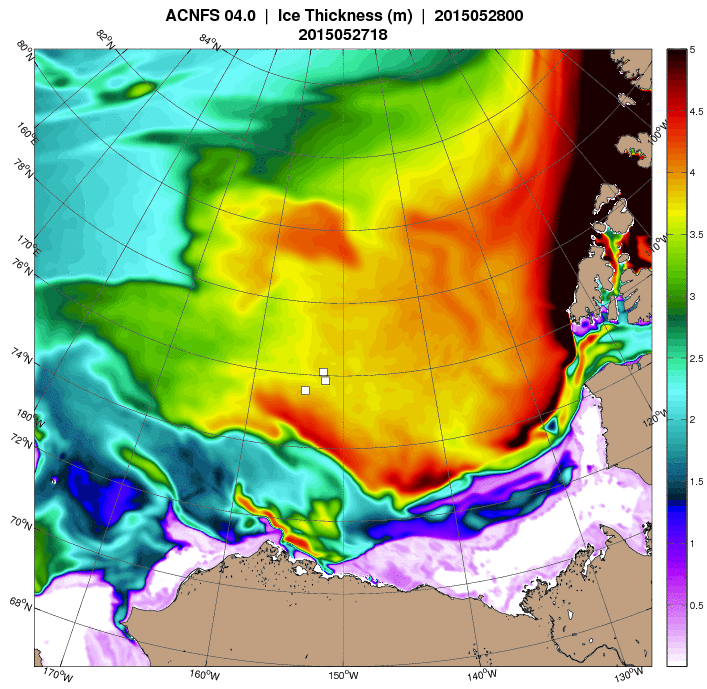
Arctic sea ice is the thickest it has been in a decade.
As we summarised matters for “Steve”/Tony’s loyal readership:
The Gish Gallop continues! Just for the record:
- Arctic sea ice coverage is currently NOT nearly identical to 20 years ago
- Arctic sea ice is currently NOT following almost the exact trajectory of 2006
- Arctic sea ice is currently NOT the thickest it has been in a decade in Ron’s beloved Beaufort/Chukchi/East Siberian Seas (BCE for short)
- Renowned Arctic sea ice expert “Steve Goddard” predicted last year that.”The minimum this summer will likely be close to the 2006 minimum, which was the highest minimum of the past decade”. That’s not how things eventually turned out!
So what is the most meaningful trend; volume or extent? are there cycles in artic and antartic ice profiles? Do we have enough long term data to really determine trend to any degree of significance? Crypsphere Today does not show anything frightening for this date!!
Hi Alf,
Extent is easiest to measure, and is most relevant if you’re attempting to navigate a ship near the ice. Volume gives you a better idea of the “amount” of ice, but is the hardest to measure. Area is in between those two difficulty wise, and is most relevant if you’re trying to work out albedo.
We’ve now got a bit over 30 years of satellite data, which is usually considered just about enough to determine a “climate” trend.
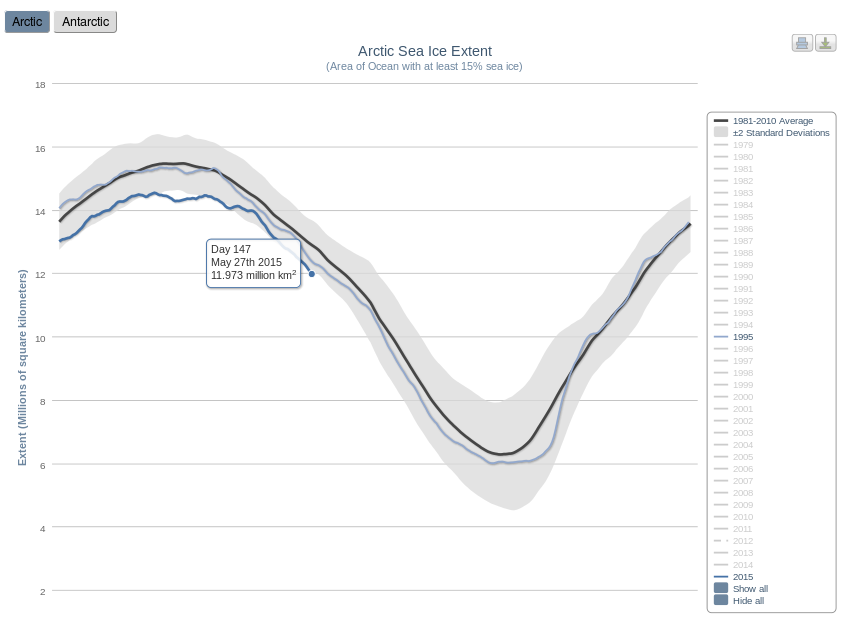
Since you mention it, CT area looks like this at the moment, comparing 2015 to Tony Heller’s current cherry picks of 1995 and 2006:
You would not use a thirty year trend to predict an I imminent ice age unless that trend was very ominous. The trend would have to be so uncharacteristic of trends that we were familiar with that that deviation from the “normal” would lend weight to your prediction. But to carte blanche give a thirty year trend significance seems meaning less. alf
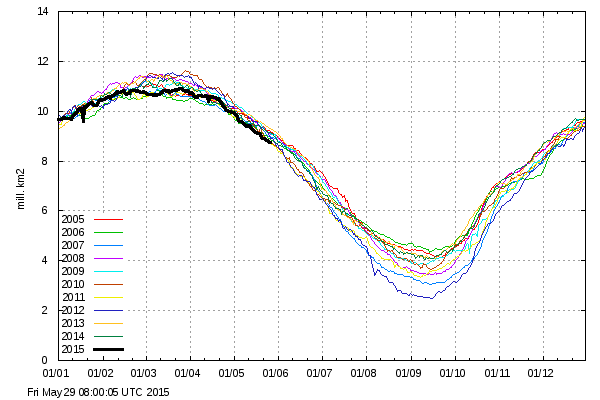
Hot on the heels of the NSIDC 5 day average Arctic sea ice extent falling below 12 million km² in May for the first time since their records began, JAXA extent has now dropped below 11 M km² in May for the first time:
Alf,
Unfortunately we only have one planet to experiment on (plus a variety of models!) and it doesn’t look as though we have thousands of years to play with:
Well; the precautionary principle maybe should be used with precaution. Is there a chance that it (might) should be “self reflecting”?
[Your comment was placed in the GWC spam folder by Akismet – Jim]
Have you read Nassim Nicholas Taleb? On the precautionary principle?
http://www.fooledbyrandomness.com/
It’s now May 30th, and the Gish Gallop continues over at (un)Real Science.
According to “Steve”/Tony “Arctic Sea Ice Continues To Track 2006”
In actual fact, using his cherry picked metric of choice, it currently looks much more like it’s tracking 2011:
Using JAXA 15% threshold extent on the other hand:
rah, in a comment over at “Steve’s” place, suggests taking onboard Big Joe Bastardi’s current Arctic sea ice forecast. Here it is, recorded for posterity, and apparently based on the current CFSv2 prediction:
If I’ve understood him correctly, Joe reckons the Arctic sea ice extent anomaly in August will be round about zero. As Joe himself succinctly puts it:
Ha??? Randomness as in “events” (What about the perception of events, as in cause and effect or events as phenomenon resulting from focusing our observations on some specific time and place) without a cause, selfacualizing. Or randomness as in a statistical analysis of a coin toss were one could assume that should all the forces that effect the outcome of the coin toss be known the ” head or tails”would be predictable. Precaution, in part I understand; I drive dispite the risks; I paraglide (an intimate experience with weather an experience all climatologist and meteorologist could benefit from) were risk assessment is absolutely crucial and ongoing before and during flight. Yet in itself risk assesment does not appear to be totally dependant on math or mathimatical models. Rather personal experience collective knowledge and yes “faith”determine the choices I make. As for being an “experiment” seems to me the whole universe is one grand experiment and I am sur the universe is indifferent to the outcome. Are humans actually significant enough to alter the course of the universes??y
The question for us is, are humans actually significant enough to alter the course of our little piece of the universe? And we are, oh yes we are.
Needless to say the latest snippet of Arctic information from the Danish Meteorological Institute has yet to be reported over at the so called “Real Science” blog. Here it is:
“Caleb” over at (un)Real Science has a most intriguing view about this recent data:
I have a comment there – dunno if it will get through moderation. Look at the ablation stakes in the two pictures Caleb posted. He’s correct that there’s more exposed ice and less open water in the second picture, but that’s not due to re-freeze, it’s because the melt pond is draining.
I can’t see your comment over there as yet Peter. Moderation at “Real Science” can take an infinite amount of time in some circumstances, if my own experience is anything to go by!
In the meantime the list of ad homs flung in my direction gets ever longer. Nothing to trouble the leaders in the GWC 2015 “New Einstein” contest yet though 🙁
Still no sign of it Peter. Let’s see if this gets us anywhere:
Guess what Peter?
Your comment has emerged from Real Scientific moderation at long last!
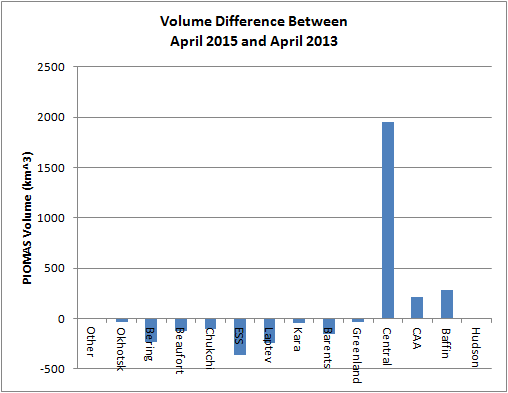
PIOMAS gridded data for May 2015 is now available. Chris Reynolds has performed his monthly regional analysis, and here’s a couple of different ways of looking at the numbers. Firstly an Arctic wide overview:
and also the regional volume differences from May 2013, i.e. immediately following the record melt in the summer of 2012:
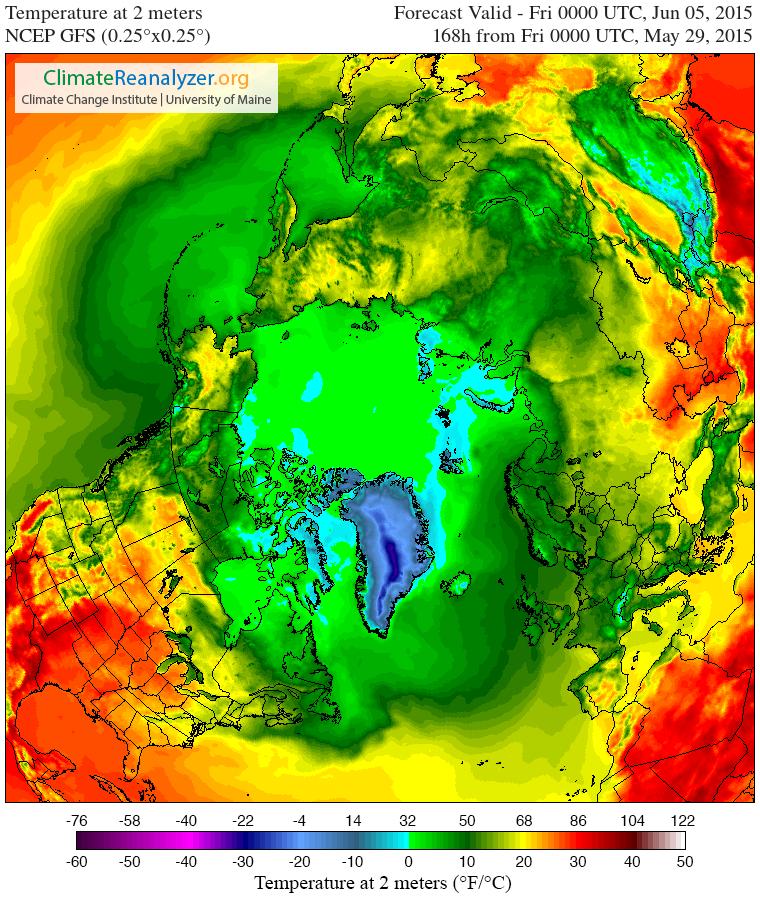
Jim, with the shift East in the Jet Stream.. one would expect various geographic locations within the Arctic Circle, Alaska, Greenland, Russia, etc. to have varying degrees of decreasing AND increasing Ice Extent compared to a “normal” year…
Funny, your own graphic posted as: “Temperature at 2 Meters” shows virtually the entire Arctic zone at Zero Degrees… in other words .. Freezing!! Where’s all the Melt Jim?? Beaufort only?? Right where the Jet Stream shifted Eastward?? Yea, no kidding, Beaufort gets warmer weather, Alaska too.. while Greenland gets a deep Freeze.. a stat conveniently left out of your piece ripping Goddard’s fine work here.
Over the years there’s been debate back and forth about Arctic Ice Thickness as well as Extent… Goddard claims the 2-5 Year Arctic Ice has built up.. while you seem to cherrypick and focus on Beaufort… one small area…
So WHY Cherrypick one small area of the Arctic JIm??
And what say you on Greenland… the TOPIC here??
In this Climate Debate some things never change… Lies, deceit, cherry picking, hoaxing… in the Arctic.. not much has changed since 1995… SEE FOR YOURSELF:
http://igloo.atmos.uiuc.edu/cgi-bin/test/print.sh?fm=06&fd=09&fy=1995&sm=06&sd=09&sy=2015
Phillipe – See for yourself. Here’s current NSIDC Arctic sea ice extent versus 2006 and 1995:
and here’s some melt ponds starting to form around O-Buoy 11 at 76.89 degrees North in the Arctic Ocean, where the air temperature is currently 1.71 °C:
Since you mention it, here’s Jason Box on the current state of play in Greenland on his MeltFactor blog:
Thanks Jim, I have seen for myself.. Beaufort is a Cherrypick…
Since 2006 .. despite all these predictions of an “Ice Free” … going back 100 years, an Ice Free Arctic has never happened in recorded Western History. The Arctic has GAINED Ice… Greenland is gaining Ice as well… thus the warming trend (partially or entirely a Natural Cycle) seems to have halted in favor of a Cooling Trend the past few years..
My prediction over the next 2-5 years going out 15-20 years plus is that the Arctic will continue to GAIN Ice. What’s your prediction Jim?
https://stevengoddard.wordpress.com/2015/06/07/june-temperatures-in-greenland-have-plummeted-to-record-low-levels/
These pictures comparing 1995 to Today AREA worth a 1000 words..
http://igloo.atmos.uiuc.edu/cgi-bin/test/print.sh?fm=06&fd=09&fy=1995&sm=06&sd=09&sy=2015
Phil(lipe) – Who’s “cherrypicking the Beaufort”? The NSIDC graph says “Arctic sea ice extent” at the top.
Why do you keep posting a link to the same 1995/2015 comparison? There is no comparison!
Does this look like a “cooling trend” to you?
Does this look like “gaining ice” to you?
Here’s the CFSv2 Arctic sea ice extent anomaly forecast in early August 2015:
It looks like Big Joe Bastardi’s prediction at the end of May missed by the proverbial mile.
Meanwhile here’s what “Steve Goddard’s” favourite DMI 30% threshold Arctic sea ice extent graph looks like today:
It still looks like it’s tracking 2011 to me!