The self proclaimed “world’s most viewed site on global warming and climate change”, otherwise known as the “Watts Up With That?” blog, recently published an article entitled “Arctic Sea Ice Appears to Have Reached Maximum And Other Ice Observations”. Since I’ve been speculating about the date of the 2014 maximum Arctic sea ice extent myself I avidly read the article but found myself ultimately somewhat perplexed. There were lots of graphs and charts displayed, but there was no sight or mention of what seems to me the most relevant one of all. The long term trend. Here is an expurgated version of my attempts to bring this oversight to the attention of the Watts Up With Thatters:
Us:

Them:
Re: Michael Jennings says:
March 26, 2014 at 7:07 am[snip . . this is dull. Put some content into your contributions or you are just trolling . . mod]
Us:
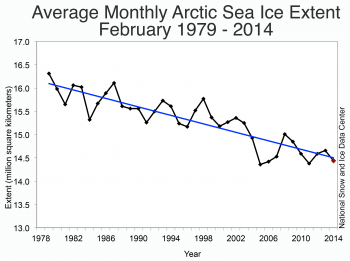
At the risk of repeating myself, here’s the latest dull content out of NSIDC:
Do you see the blue line heading for the bottom right?
[snip.. lots of dull references to Antarctic sea ice and “Real Science” removed.. mod]
Them:
Snow White needs to get up to speed on the Scientific Method: skeptics have nothing to prove.
Rather, the onus is on the alarmist crowd to provide scientific evidence showing that their CO2/cAGW conjecture is true. They have failed miserably.
But there is no scientific evidence supporting their belief in manmade global warming. None at all. Every last climate model has failed. They were all wrong.
The alarmist crowd is fixated on Arctic ice, instead of on global ice cover. Why? Because that is their last forlorn hope; every other climate scare has been debunked. Well, it’s time to debunk the ‘disappearing Arctic ice’ scare, too:
Global sea ice is at it’s 30-year average [the red graph – click in chart to embiggen]. We already know about the polar see-saw, in which the NH and SH poles balance each other out. That effect can be clearly seen in the global ice chart above.
There is nothing either unusual or unprecedented happening. What we observe now has happened before, repeatedly, and to a much greater degree. Rational folks understand that. It is called the climate Null Hypothesis, and it has never been falsified. The Null Hypothesis is a corollary of the Scientific Method. So is the fact that the onus is on those who produce the catastrophic CO2/AGW conjecture, to suport their belief with scientific evidence.
But there is no evidence proving that Arctic ice is in unprecedented decline. None at all. There is no evidence to prove that the current Arctic ice fluctuation is anything other than natural climate variability. Occam’s Razor says that natural variability is by far the most likely explanation.
The Arctic ice scare is just the same as all the other climate scares. It is promoted by religious True Believers, who expect everyone to share in their Chicken Little panic.
But that only works on those who are ruled by emotion, and fright is an emotion. Scientific skeptics, OTOH, are logical, and therefore they are unaffected by the silly ‘Arctic ice’ scare.
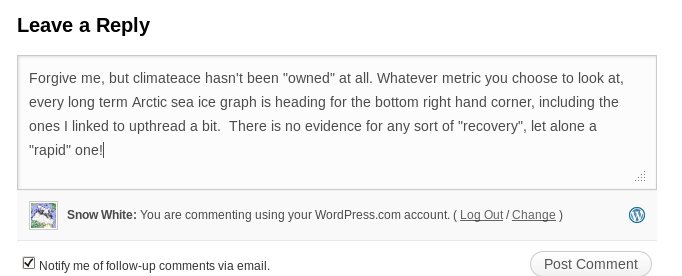
So to summarise, you cannot muster a single chart to refute my assertion about Arctic sea ice decline, let alone “hundreds”.
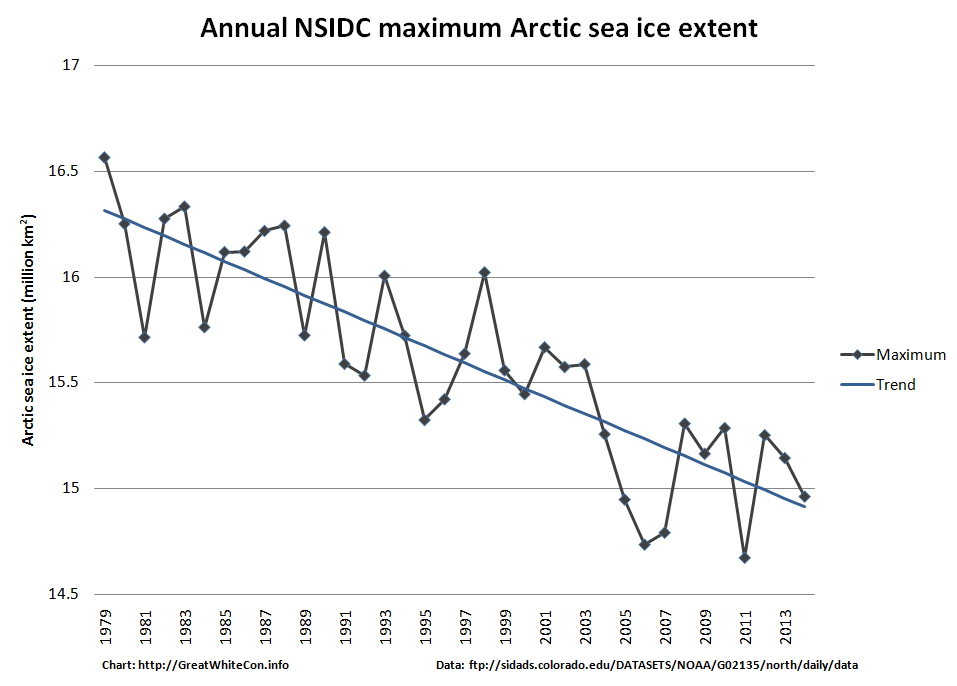
For your edification, and for that of the writer of the original article who for some strange reason neglected to include a graph showing the long term trend in Arctic sea ice maximum extent, here is one I prepared earlier:

From a comment on a different thread on WUWT, on April 10, 2014 at 3:33 am (WUWT time)
I’m sorry Snow White (or Mr Hunt, if you prefer), but I think that a little courtesy would be in order. I’ve read every word on the link you’ve provided, and the central theme of your original post was that “there was no sight or mention of what seems to me the most relevant one of all. The long term trend [of Arctic sea ice]“. You described more than one attempt to bring this deficit to the attention of WUWT.
Given that Michael D posted on your page at April 9, 2014 at 4:01 pm, politely pointing out that the WUWT sea ice page has just such data presented, it would seem a basic courtesy to either acknowledge his assistance (in this blog or yours) and either thank him, or explain why graph does not answer your criticisms.
I acknowledge that your arguments seem to have moved on to volume now, but they have been addressed by others, and better than I could have done. As an aside, I suppose I could run a blog with limited data about Antarctic sea ice coverage and volumes. I’m sure that I would be criticised, with comments explaining that I was looking at the mural through a microscope, and that the Antarctic buildup cannot be considered in isolation. I think that such criticism would be valid – your thoughts?
Us:
As you can see from the historical record, I asked on more than one occasion for someone to supply a link to “A long term (let’s say 30 years or more) graph for any measure of Arctic sea ice “quantity” showing anything other than a trend in the direction of the bottom right hand corner.” Nobody did. Nobody suggested looking at the WUWT sea ice page either, presumably because no graphs fitting my description can be found on there.
Q.E.D. ?
Them:
We’ll keep you posted!

I am an interested layman and I read Watt’s blog regularly. I too am interested in Arctic ice; more precisely I am interested in Global ice. The Sea Ice page at WUWT is full of data a graphs (including ones very similar to the one that you object to being left out of the blog post). http://wattsupwiththat.com/reference-pages/sea-ice-page/
Blog posts are just that. They are not all inclusive, comprehensive treaties on a subject. A blog post stating “we appear to have reached maximum” is a comment on the current state of arctic ice.
Arctic is in decline. Antarctic ice is increasing. Global sea ice is stable. These three facts interest me greatly. I would love to see an active discussion somewhere as to how these three facts could be explained.
Your blog seems devoted to only arctic ice. I agree with you that arctic ice is in decline. I have no argument with the graph that you show that illustrates this. For me, the greater question is “why?”. Increased CO2 does not seem to fit. A change in the atmosphere would/should affect ice at both poles in the same way.
Again, I’m not a scientist, but I don’t see how:
1. CO2 causes warming, causing Arctic ice to melt
and, at the same time
2. CO2 causes warming/cooling, causing Antartic ice to grow
If someone has a paper out on this subject I would love to read it. I would love to discuss it. I would love to see a blog post on the paper and sift through the comments and criticism of people more educated than myself. Is your blog where I am likely to find this sort of conversation?
Hi Diane,
As you say, this blog is devoted to Arctic sea ice, and in particular to the inaccurate reporting in a variety of media of the “facts” about Arctic sea ice. As I’ve just been endeavouring to explain to a certain “Monckton of Brenchley” over on WUWT:
It seems Anthony has taken my comments on board, since he now assures me that:
Perhaps we could discuss the total amount of sea ice on the planet further once Anthony has got those volume plots up and running? In the meantime here’s an explanation on the Skeptical Science web site that may help explain the difference between the North and South Poles?
https://www.skepticalscience.com/antarctica-gaining-ice.htm
there was no sight or mention of what seems to me the most relevant one of all. The long term trend.
Sorry you missed it! Go back to WUWT, click on the menu for: Reference Pages / Sea Ice Page. The you will see the exact graph that is reproduced here, plus many more. No one at WUWT seems to be disputing that Arctic sea ice has been retreating even during the warming “pause,” and there has been much interest in it. If you want to make that point more strongly, I suggest that you graph the annual minimum rather than the annual maximum. Oddly, the total global ice, after dipping around 2008, has been well above the long-term “normal” for a couple of years now.
Hi Michael,
Perhaps my response to Diane has already answered most of your queries?
Here’s our initial article on the mass media misrepresentation of last years annual minimum, including a graph of the type you describe:
https://greatWhiteCon.info/2013/09/a-million-square-miles/
Jim Hunt,
The methods that we currently have for measuring sea ice are not precise. Estimated thickness of sea is just that…an estimate. I’m sure that we will get better at taking good measurement and getting better data. But, for now we have to muddle through with what we’ve got.
I tend to look at what the satellites measure best. That is sea ice extent. That is the graphic that you provide above: NSIDC annual maximum Arctic sea ice extent graph for 1979 – 2014. This clearly shows a decline. A similar graph of Antarctic sea ice clearly shows gains: http://earthobservatory.nasa.gov/IOTD/view.php?id=82160
Again, this is sea ice…not land ice. I think that I am being consistent in comparing apples to apples.
The Skeptical science article you link to proposes that one possible reason for the expanding ice is Ozone levels over Antarctica have dropped causing stratospheric cooling. The SS article has not been updated to show that this theory has been contradicted by Sigmond, M., and J. C. Fyfe 2010. Geophys. Res. Lett., 37, L18502, doi:10.1029/2010GL044301.
A quote from the abstract:
“In this study we consider the impact of stratospheric ozone depletion on Antarctic sea ice extent using a climate model forced with observed stratospheric ozone depletion from 1979 to 2005. Contrary to expectations, our model simulates a year-round decrease in Antarctic sea ice due to stratospheric ozone depletion. The largest percentage sea ice decrease in our model occurs in the austral summer near the coast of Antarctica, due to a mechanism involving offshore Ekman sea ice transport. The largest absolute decrease is simulated in the austral winter away from the coast of Antarctica, in response to an ocean warming that is consistent with a poleward shift of the large-scale pattern of sea surface temperature. Our model results strongly suggest that processes not linked to stratospheric ozone depletion must be invoked to explain the observed increase in Antarctic sea ice extent.”
The second reason is that “Southern Ocean is freshening because of increased rain and snowfall as well as an increase in meltwater”. Arctic water is also freashing for the same reasons. http://www.apl.washington.edu/project/project.php?id=arctic_freshwater_pathways
Quote from the above link: “Freshening has been attributed to increased sea ice melting”
See the contradiction? Freshening at the South pole = more ice, Freshening at the North pole = ice.
I’m looking for a unifying theory of climate. I do appreciate the link you provided, but it gets me no closer to finding a solution to my conundrum. What is causing arctic sea ice to decline, antarctic sea ice to increase and global ice to be stable?
Land ice is melting, that is not shocking, it has been doing so for thousands of years, since that last great ice age. See: http://commons.wikimedia.org/wiki/File:Post-Glacial_Sea_Level.png
That would be land ice melt, measured by sea level rise. Rising “quickly” at the end of the last Ice Age. Rising slowly for the last 8 millennia.
Bugger…I address my comments to the wrong person. My apologies, I was speaking to Jim Hunt.
I’ve taken the liberty of correcting your inadvertent error. I hope that’s OK with you?
Hi Diane,
This site is concerned with “Putting the Arctic sea ice record straight” just like it says at the top. You’re not going to find a unifying theory of climate here. Perhaps you could pose your questions on that topic over at SkS?
Sticking with our mission of clearing up the many mass media misrepresentations of the Arctic sea ice story, would you mind letting me know what you think of our shiny new Arctic sea ice graphs page?
https://greatWhiteCon.info/resources/arctic-sea-ice-graphs/
Difficult though it may well be, we have done our very best to reveal the intricacies of Arctic sea ice thickness and volume.
Jim,
Thank you for correcting my error.
SkS thinks that they have covered the Arctic and Antarctic sea ice question with the post you linked to. I have found them reluctant to reconsider the subject. Asking questions got me labeled a “climate heretic”. My comments were deleted.
So, since the sole focus of this blog is “Putting the Arctic sea ice record straight”. I wish you well and will continue my search.
I’ve book marked this page and I’ll check back in from time to time. I hope that someone might read my comments and point me to an answer.
Hi Diane,
You may also wish to take a look at this comment on another thread, where a question similar to yours was posed:
https://greatWhiteCon.info/2014/04/the-arctic-sea-ice-recovery-vanishes-even-more/#comment-16553
Do you have any evidence for your “comments were deleted” assertion? I suffer from that sort of problem myself from time to time, and I have a penchant for publicising such things!
Hi, I’m not a scientist but I think I see some problems with this Tony Heller graph. I can’t find the original blog where he posted it, but I’m pretty sure it’s a Heller work of art. I wonder if you could comment and see if you come up with some of the same observations about how the chart is constructed. I read your article and the comments, so understand all those reasons why this is terrible.
[I embedded your image for you – Mod]
Happy New Year Lyon,
You may wish to peruse this comment about the “laughable attempt by Tony Heller to graft on satellite Sea Ice Extent data onto Vinnikov et al (1980) Figure 5” over at Skeptical Science?
https://www.skepticalscience.com/global-warming-natural-cycle.htm#124536
Here’s the NSIDC’s view of pre 1979 Arctic sea ice extent: