Our title today is an allusion to Bill Bruford’s “Five Percent For Nothing”, from the 1971 album “Fragile” by Yes. Here’s what the cover looks like:

Them:
A chilly Arctic summer has left nearly a million more square miles of ocean covered with ice than at the same time last year – an increase of 60 per cent.
Us:
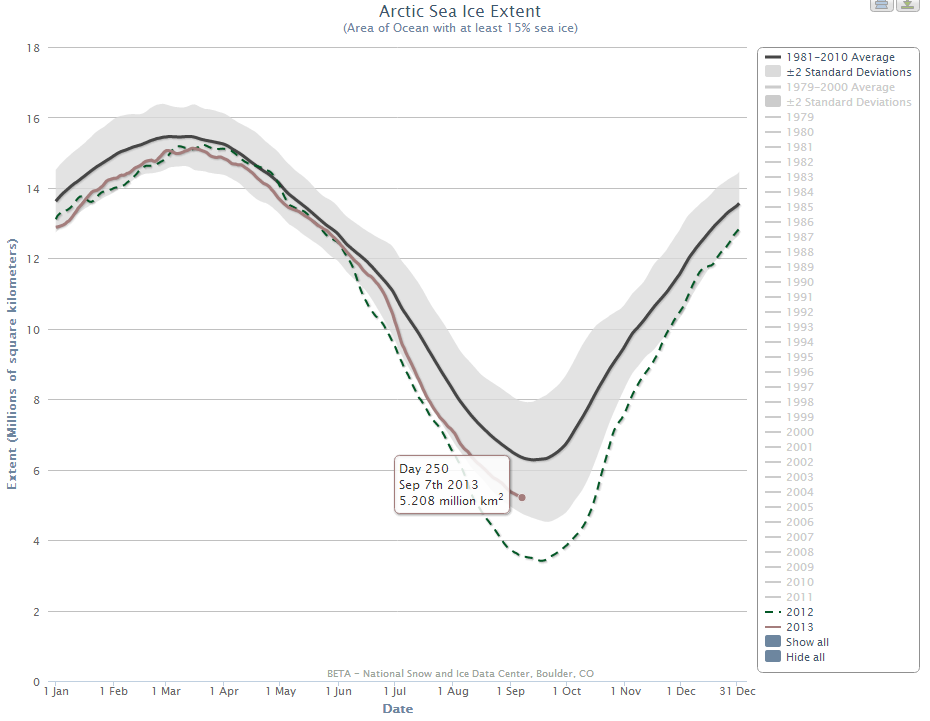
According to the NSIDC once again the numbers look like this:

The sums are obviously rather tricky, so we’ve enlisted the aid of a spreadsheet. Here’s what it reveals to us:
| Metric | Date | 2012 | 2013 | Increase |
| NSIDC Daily Extent (million km²) | Day 249 | 3.558 | 5.236 | 47.2% |
| NSIDC Daily Extent (million km²) | Sep 8th | 3.523 | 5.179 | 47.0% |
| NSIDC Daily Extent (million km²) | Aug 27th | 3.94 | 5.632 | 42.9% |
| NSIDC Daily Extent (million km²) | Aug 15th | 4.845 | 6.159 | 27.1% |
| NSIDC Monthly Extent (million km²) | August | 4.71 | 6.09 | 29.3% |
Verdict:
Whichever way you look at things, on a “same time last year” basis at least, the magic number of 60% seems to be out of reach. Whatever the arithmetic David Rose actually performed, whether mentally or on his pocket calculator, it would appear not to involve comparing like with like. We have asked David and the Mail on a number of occasions what numbers he started from and what calculations he performed. We have received no answers as yet.
Getting back to our title, when you start to look at Arctic sea ice volume instead of extent, 160% of almost nothing is still almost nothing:
Video courtesy of Andy Lee Robinson
Small print: We have yet to double check all the numbers in our simple spreadsheet. The NSIDC web site is still down today.
I work in IT system migrations. One of the biggest issues I have to get over to our customers, when we are doing pilots, is the size of a small change in a small sample group.
For instance if we do two people an one fails, then it is a 50% failure rate. If we do 10 people and one fails, then the same failure hits 10%. Equally 1% for 100.
This works conversely in the arctic. 2012 was a massive loss year, taking the ice down to a very low level. It is very easy to see a very large swing in size in the year after, with almost no change in the status quo of ice loss.
But it does make for very brash headlines.
What will they say when we reach 1m km^2 and we see a 100% uptick in any one year??? Or 0.5m km^2 going up to 1.5??? I can just see the headlines, “300% INCREASE IN ARCTIC SEA ICE, CLIMATE CHANGE IS REVERSED”.
In the land of the blind…….
The inability of David Rose to do simple arithmetic does make identifying where he came unstuck a little difficult. He does leave one clue. If his 60% increase is actually 920.000 sq miles then he has in mind a 2013 value roughly something like 6.3 m sq km and a 2012 value of something near 3.9 m sq km. If this is so, he then likely got the 2013 value correct, either the mid-August SIE or monthly average. So where did the 920,000 sq miles come from? Did he screw up converting sq km into sq miles? Is it ‘fat finger’ syndrome? Did he take August 2013 SIA for August 2012 SIE?
The one telling point in my mind is that there is no correction for this patently erroneous headline figure that Rose has perpetrated. Nor, it appears, is there likely to be one offered. If you deal in lies, making gross errors unintentionally isn’t crossing any red line and so it needs no correction. It is not beyond the line because that red line has already been crossed.