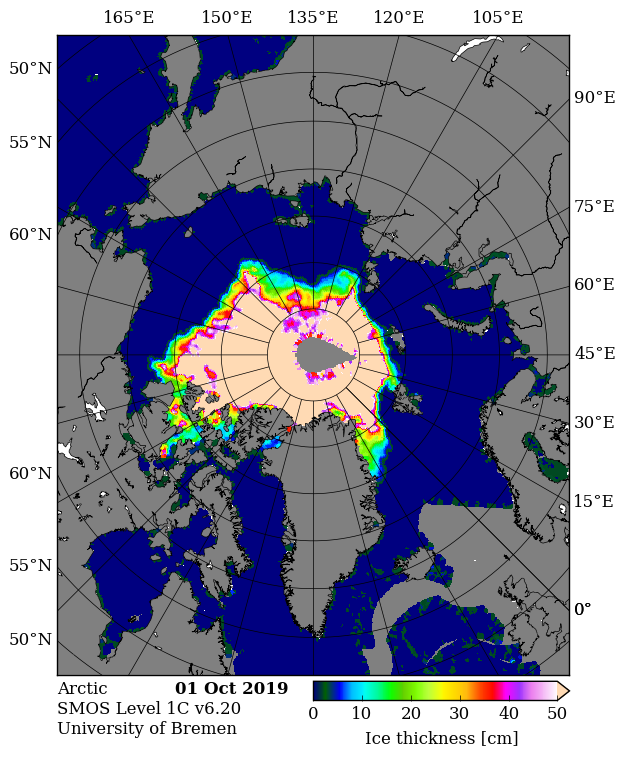
Whilst we await the PIOMAS volume numbers which generally arrive around the 5th of each month, and before we look at graphs of extent, with the refreeze well under way some “measured” thickness maps are coming back! Here’s the first SMOS map this autumn:
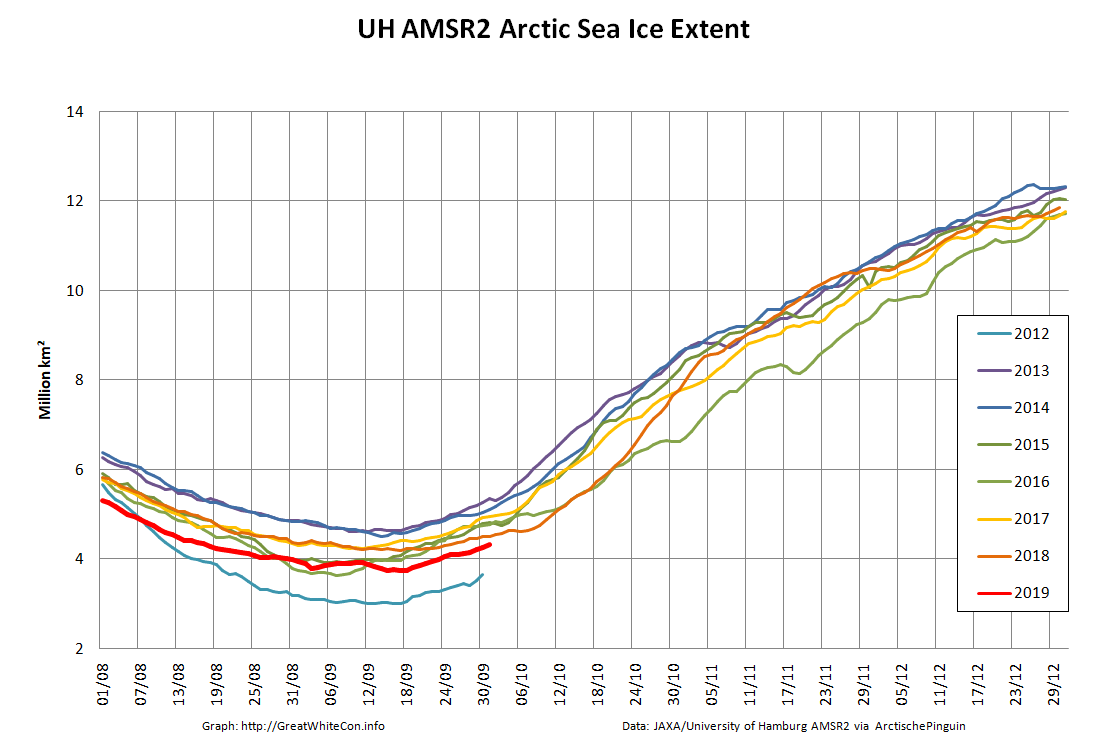
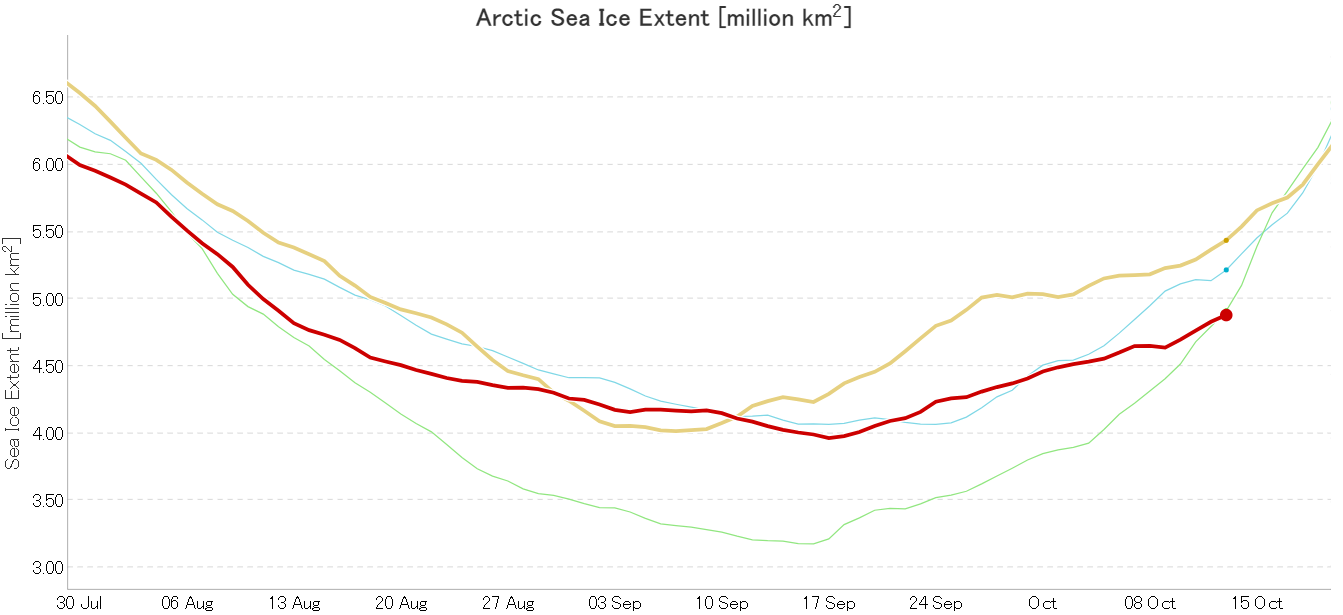
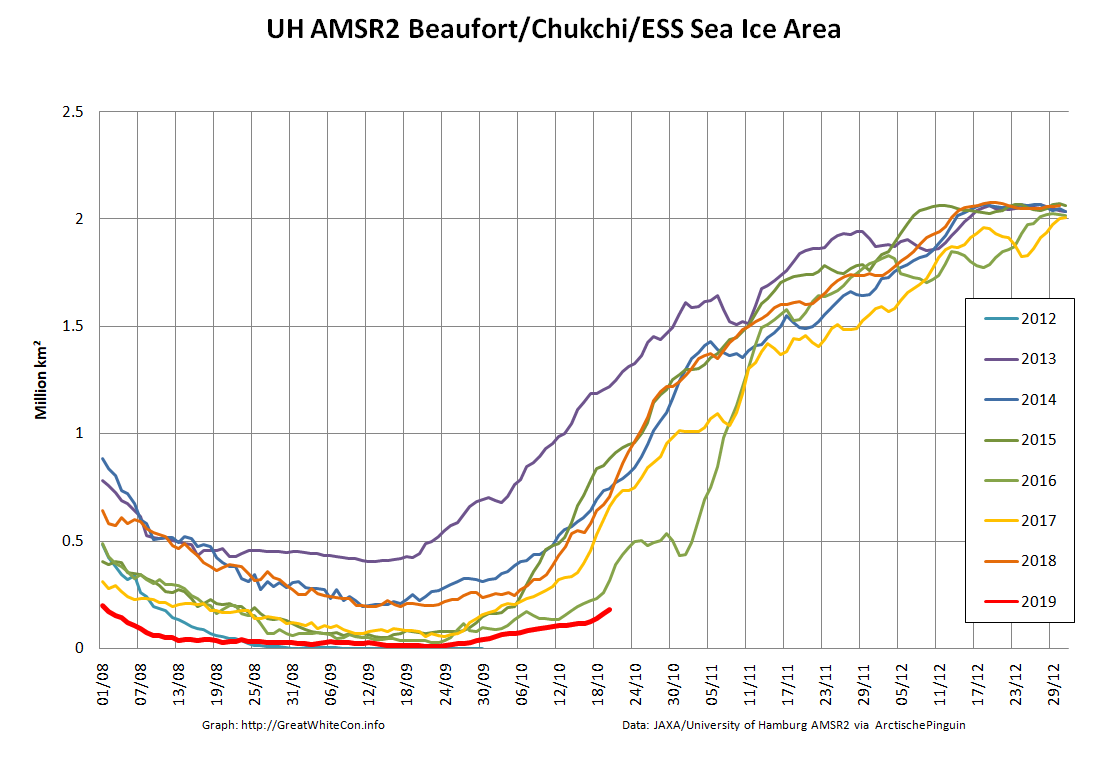
Then of course there’s our usual Arctic wide high resolution AMSR2 area and extent graphs:
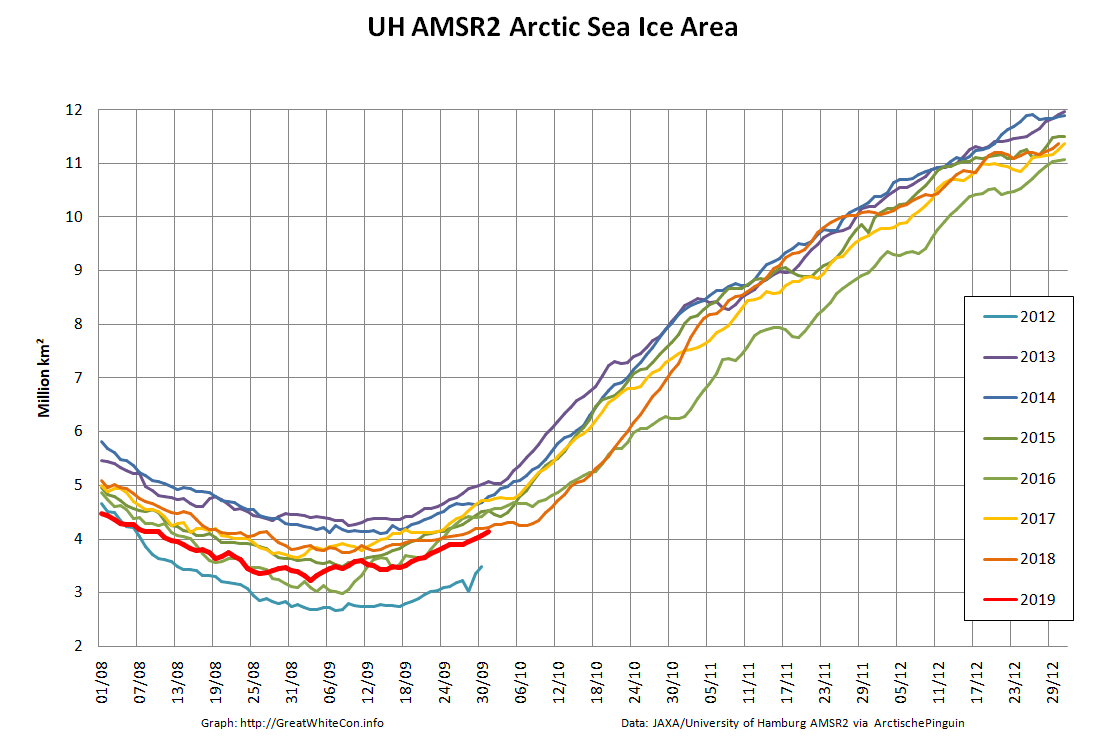
 They reveal both metrics currently still second lowest (in the brief AMSR2 record) after 2012. It looks as though that may well change soon, particularly area.
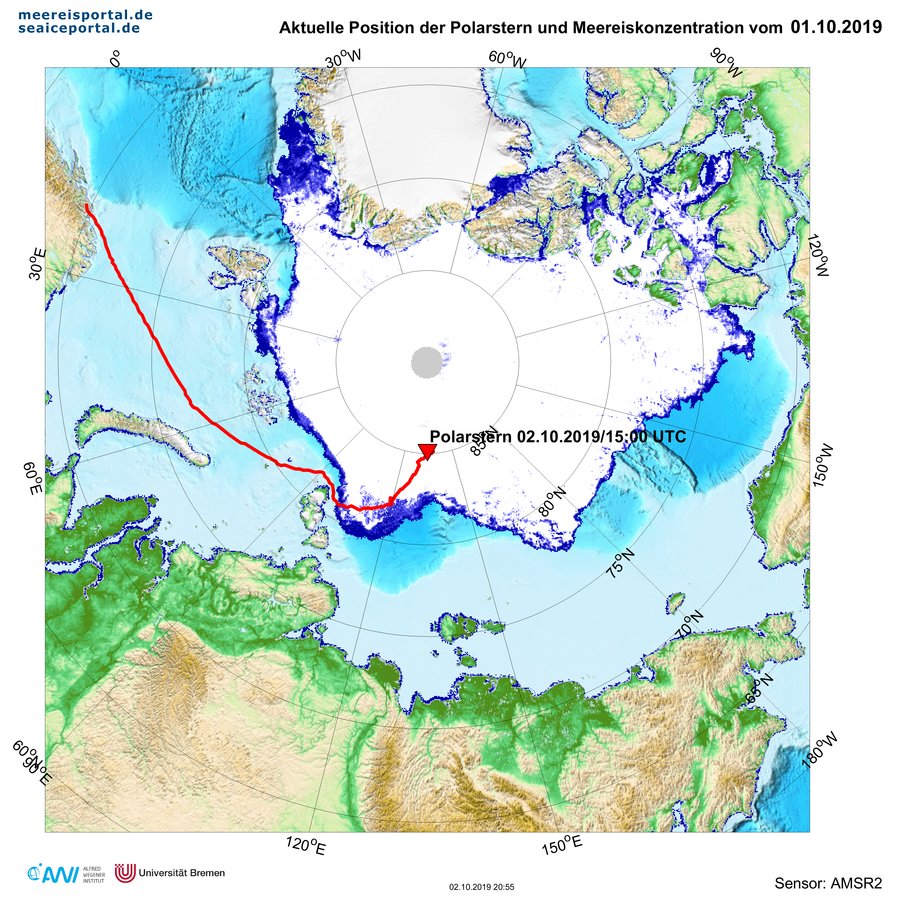
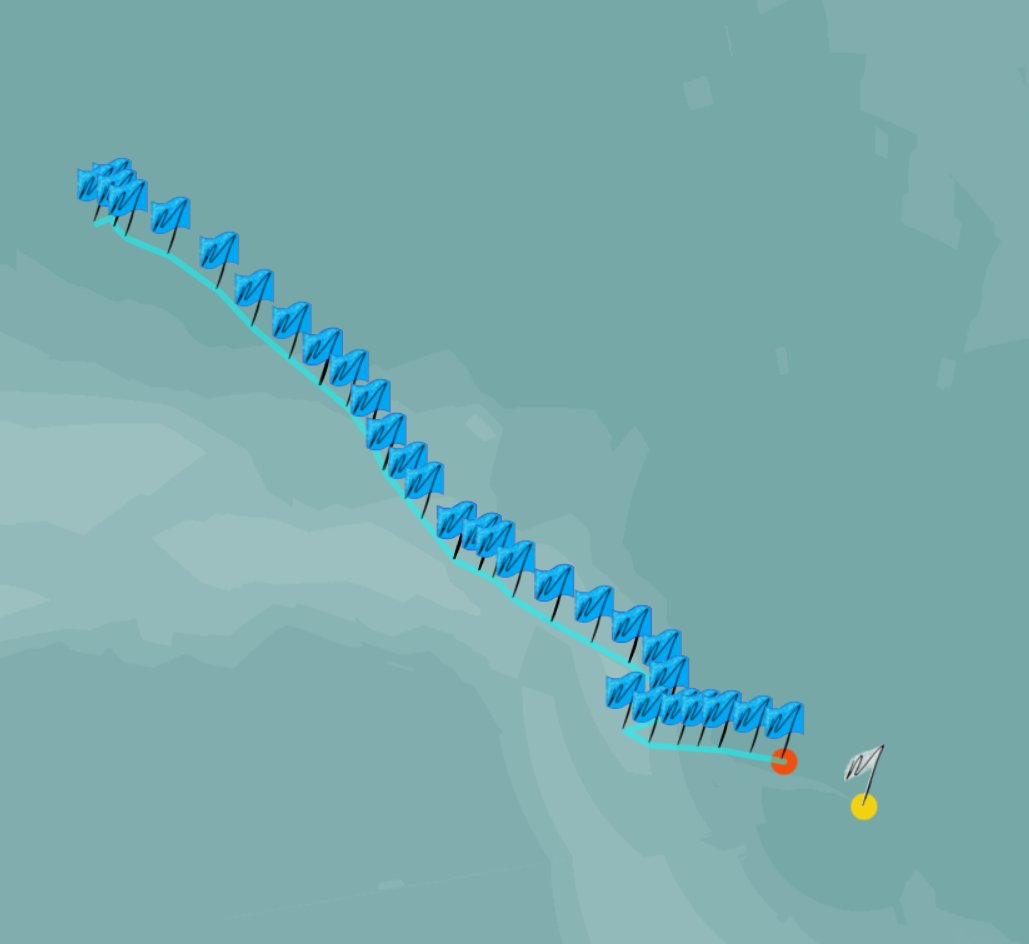
The MOSAiC Expedition has started in earnest, with Polarstern and Akademik Fedorov in amongst the sea ice at long last:
However:
The search for a suitable floe is still ongoing: Aboard Akademik #Fedorov survey flights take off whenever the often foggy #Arctic weather allows.#MOSAiCexpedition #Icedrift #Icefloe
Photo by: @AWI_de / Hans Honold pic.twitter.com/HmjaTsYNfP
— MOSAiC Expedition (@MOSAiCArctic) October 1, 2019
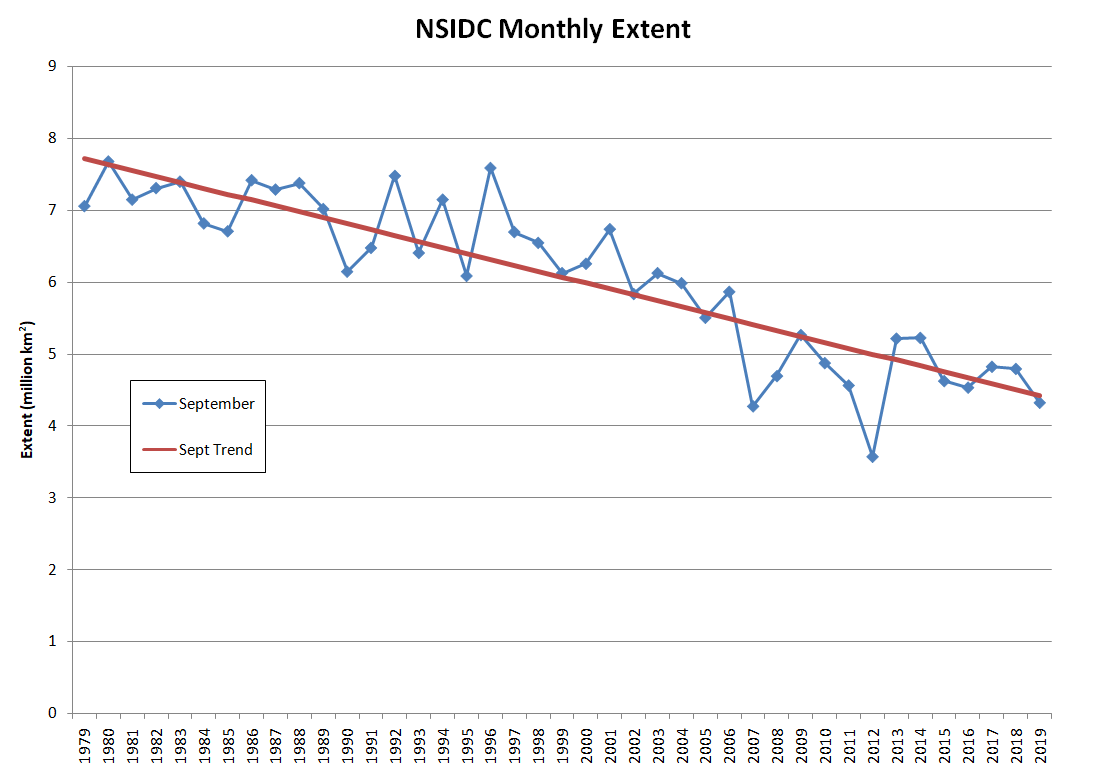
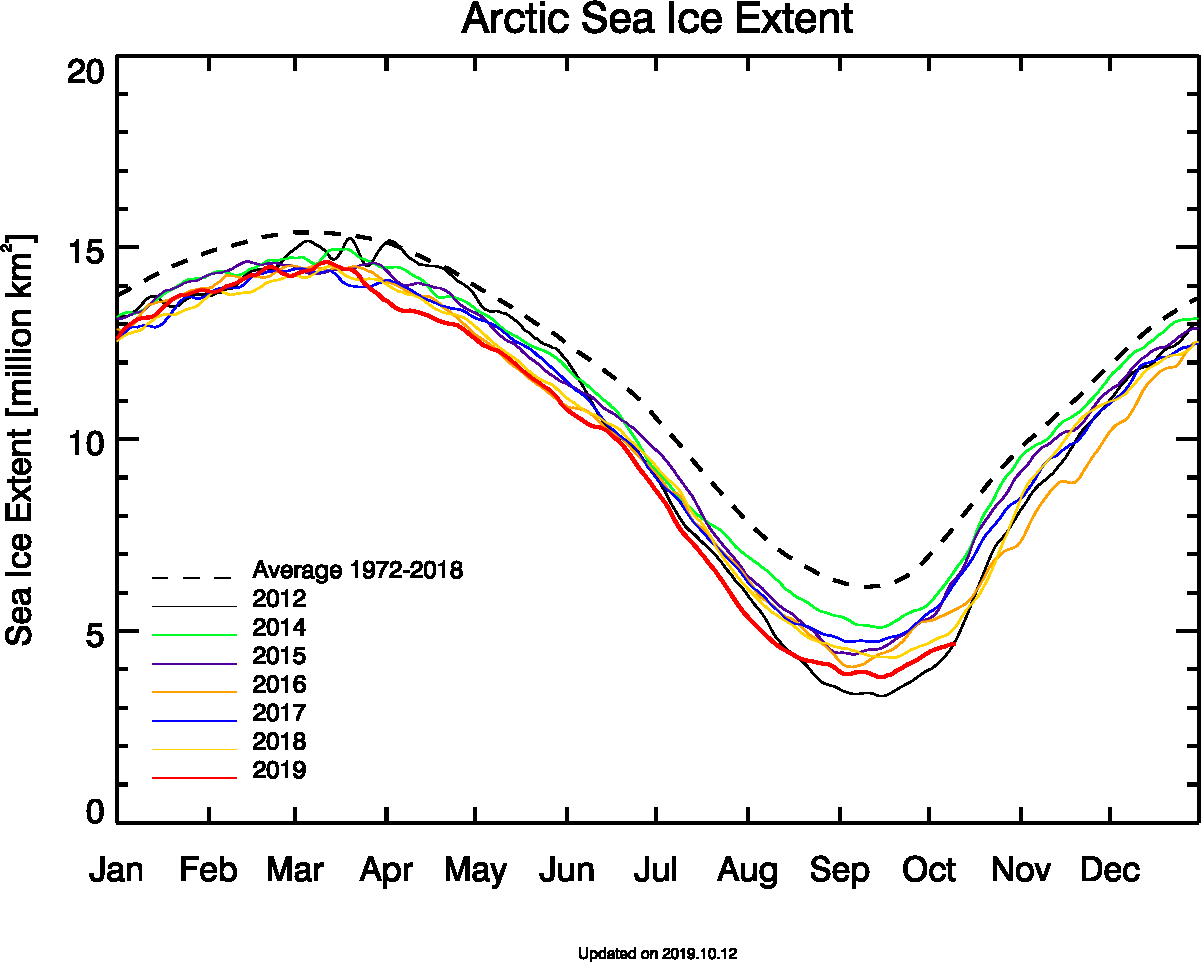
The near real time NSIDC monthly extent for September is 4.32 million km². Here’s the graph:
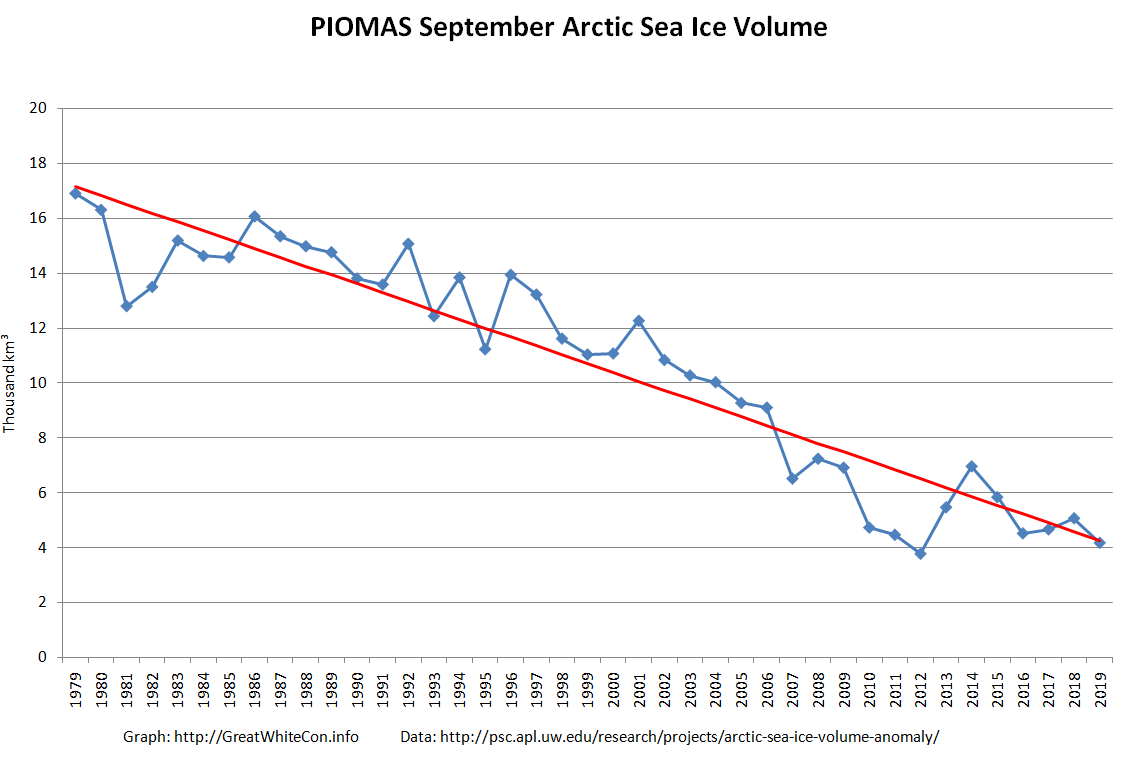
We’re eagerly awaiting the first ice mass balance buoy “near real time” data, but for now the 2019 PIOMAS minimum volume is expected to be revealed real soon now, so:
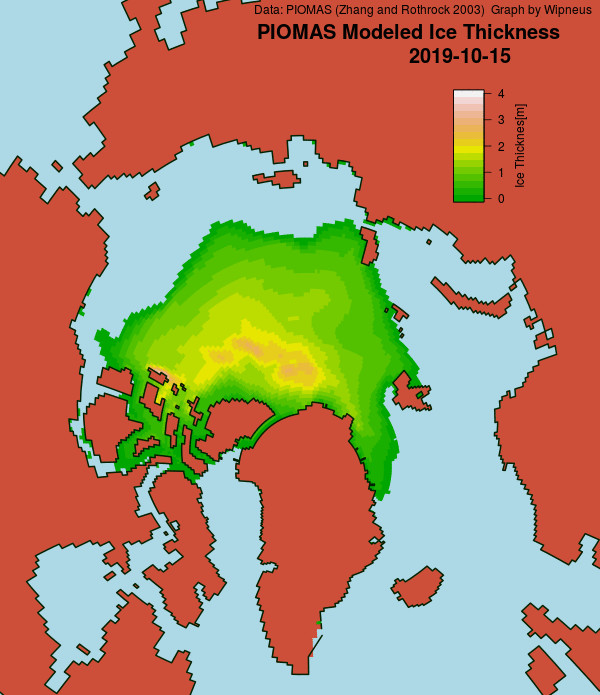
As previously perfectly predicted, the PIOMAS numbers have arrived over at the ASIF. Here’s the thickness map for the end of September:

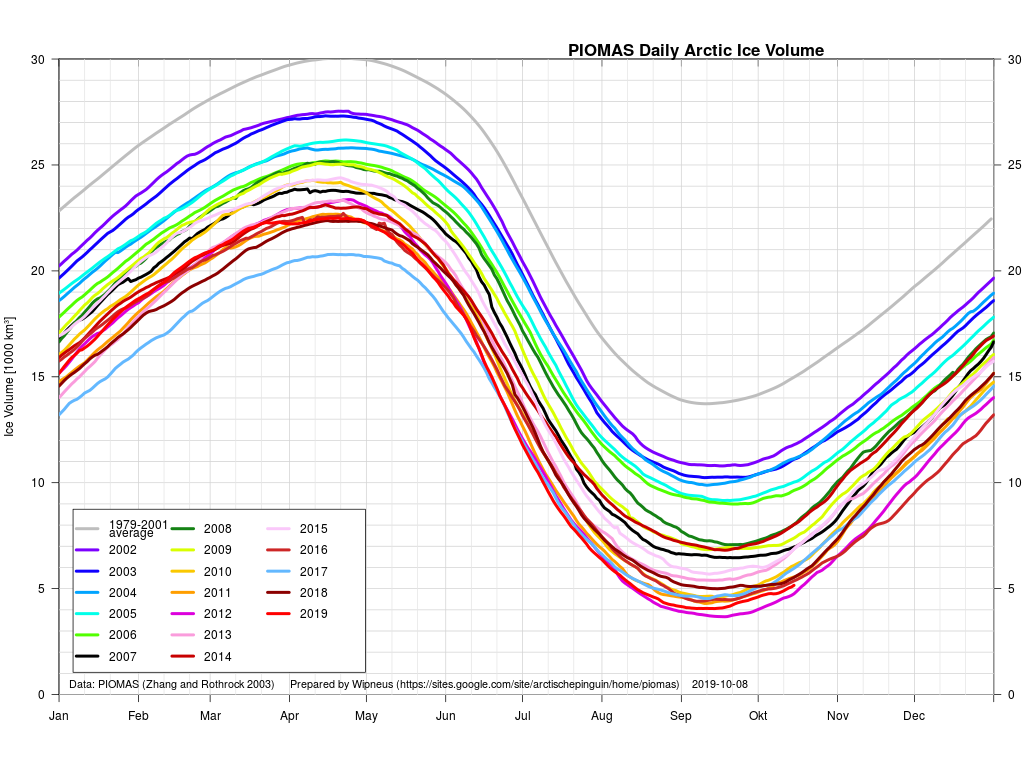
and the volume graph:
Since I’m involved is a heated “debate” about Arctic sea ice trends over at ex Prof. Judy’s, here’s an added bonus this month. The September volume trend:
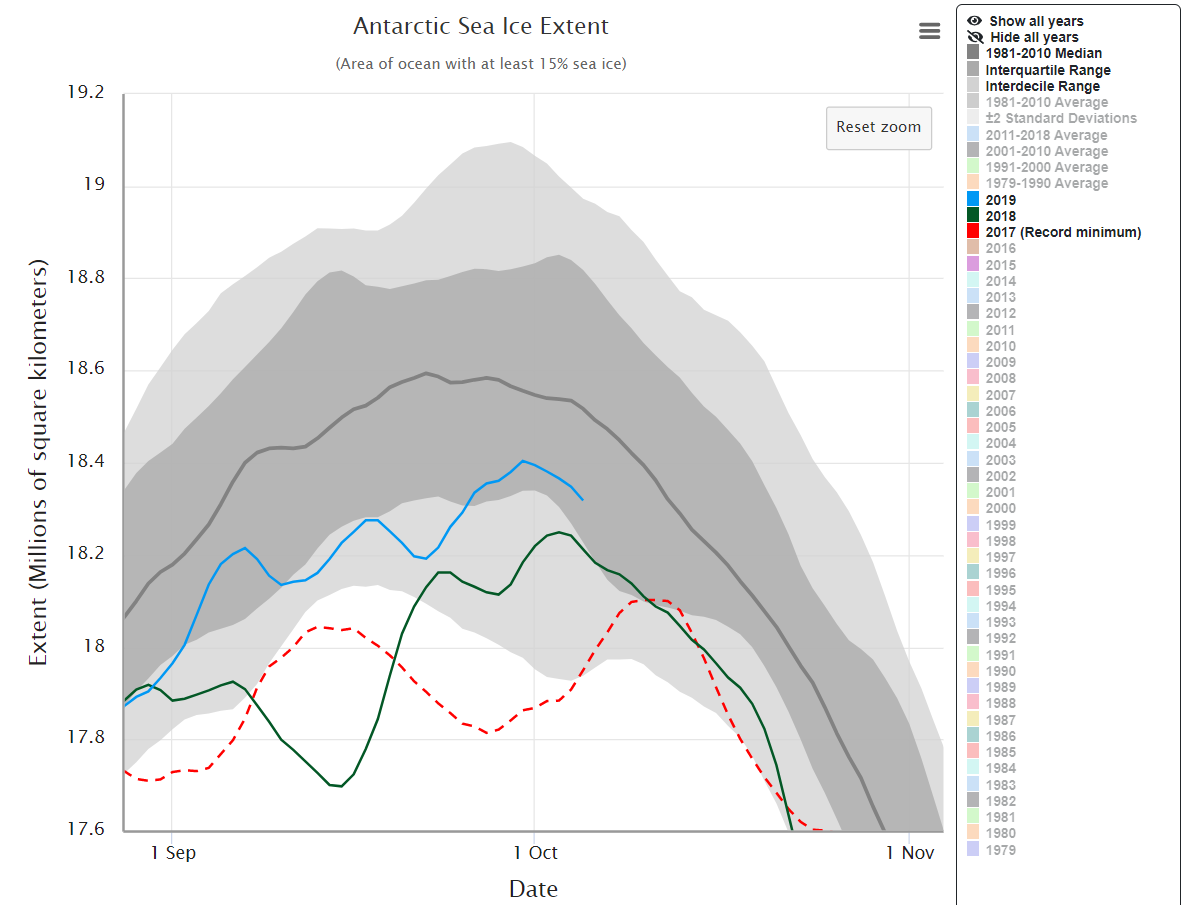
A marginally off topic excursion down under. The NSIDC 5 day average Antarctic sea extent looks to have peaked at 18.40 million km² on September 30th:
The first of the MOSAiC Expedition’s Ice Mass Balance buoys has been installed, presumably on the ice floe Polarstern is moored to. It reveals sea ice that is currently just over 1 meter thick with a sprinkling of snow on top: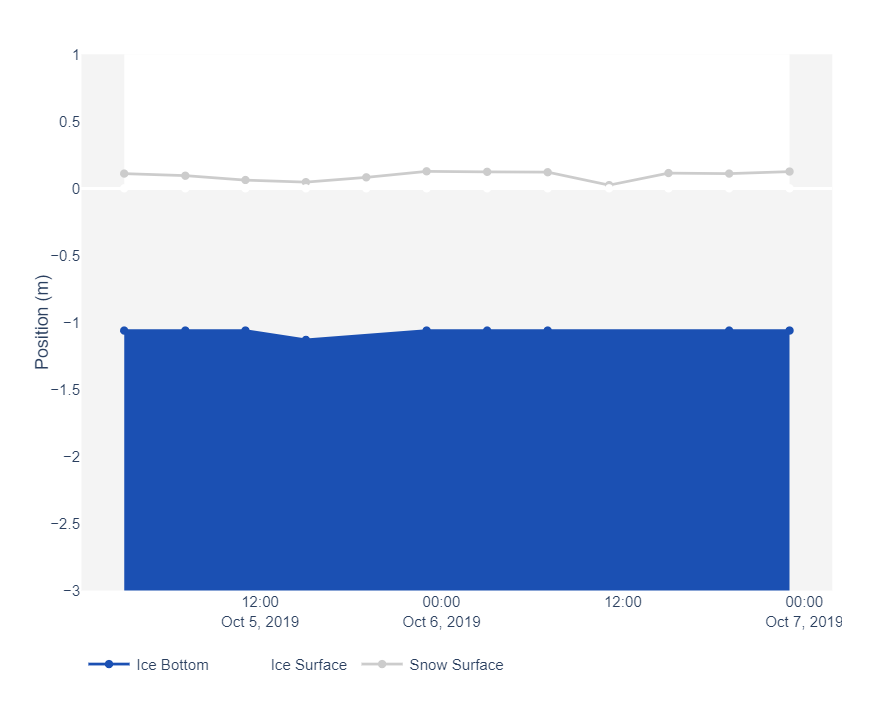
P.S MOSAiC IMB buoy #3 has gone live today too:
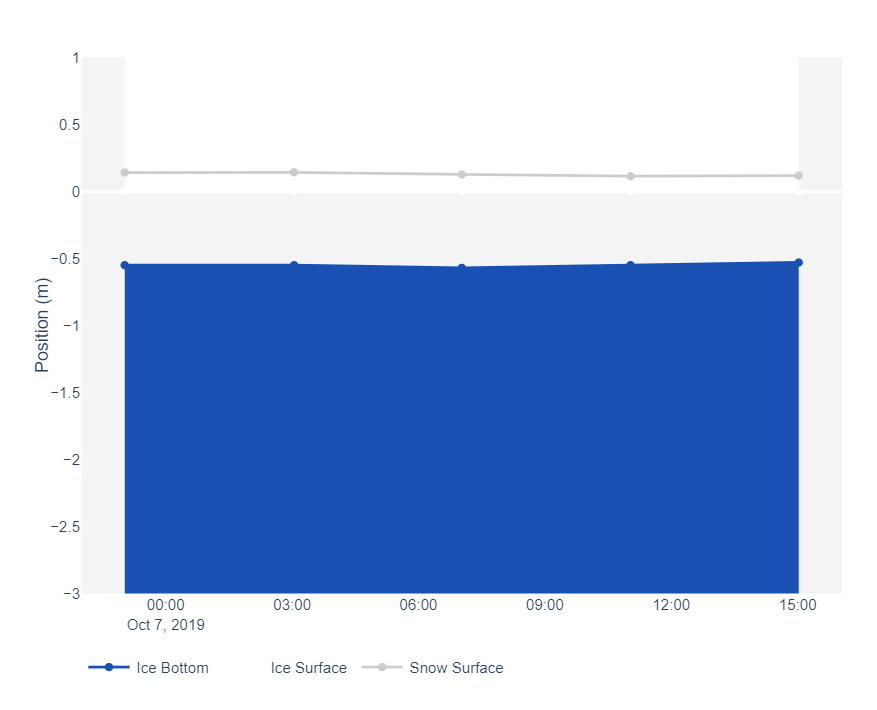
There’s currently only 0.5 meters of ice under this one.
Here’s the latest annual PIOMAS “ice cube” animation from Andy Lee Robinson:
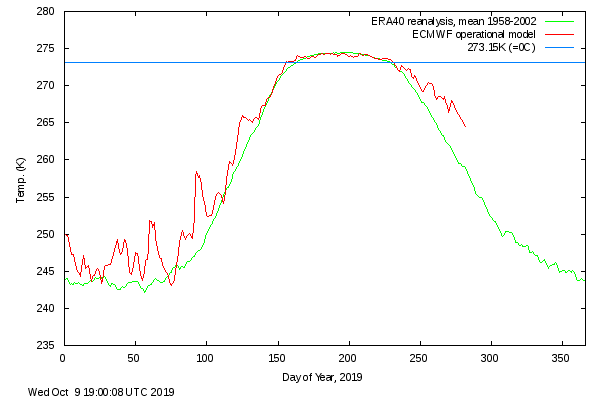
Here’s the latest DMI “high Arctic” temperature graph:
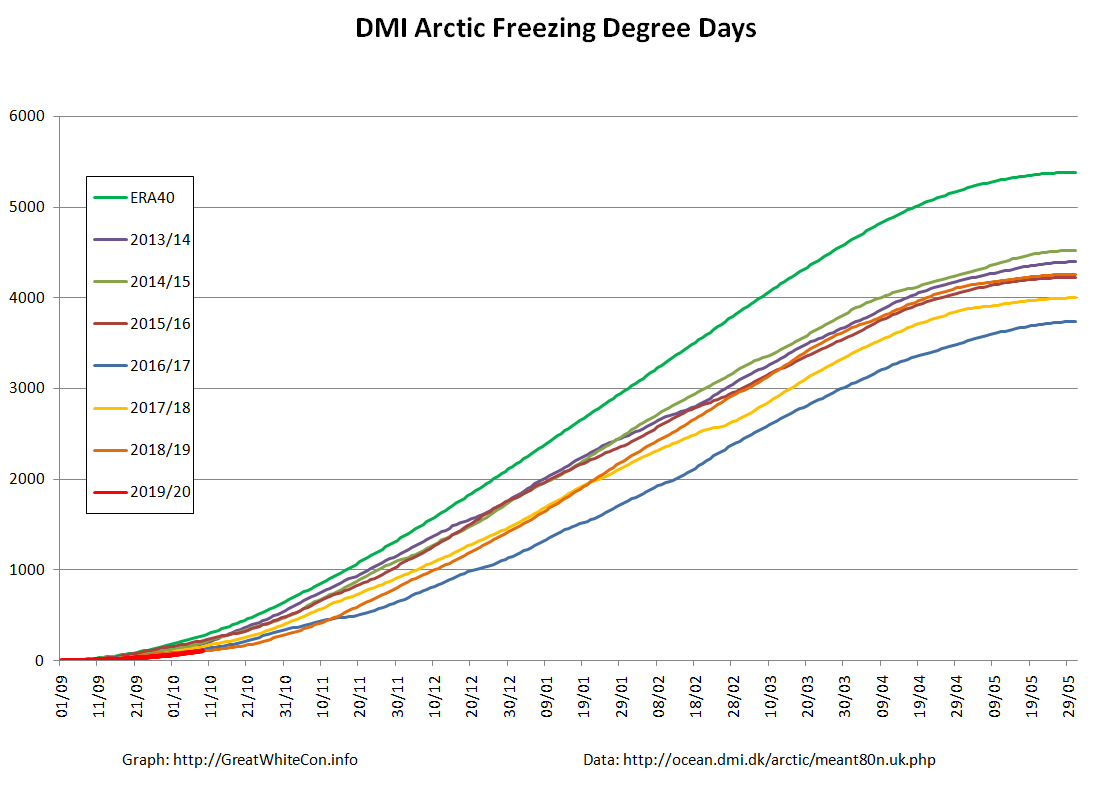
Needless to say that means the DMI Freezing Degrees Days graph is tracking the lowest readings in the DMI’s records:
MOSAiC IMB buoy #2 has now been installed and is beaming back data:

The sea ice at this location is decidedly on the thin side at present. A mere 20 cm or thereabouts!
The JAXA ViSHOP web site is down at the moment, so by way of a change here is the University of Bremen’s AMSR2 based extent graph instead:
2019 Arctic sea ice is extent is now once again “lowest for the date” (since AMSRx satellite records began).
The JAXA/ADS/ViSHOP web site is back online after being down over the weekend, presumably due to the effects of Typhoon Hagibis:
Sure enough the Japanese flavour of AMSR2 based extent is also now “lowest for the date”.
Plus a stunning image from Mike Horn and Borge Ousland as they attempt to “walk” to the North Pole then on towards Svalbard:
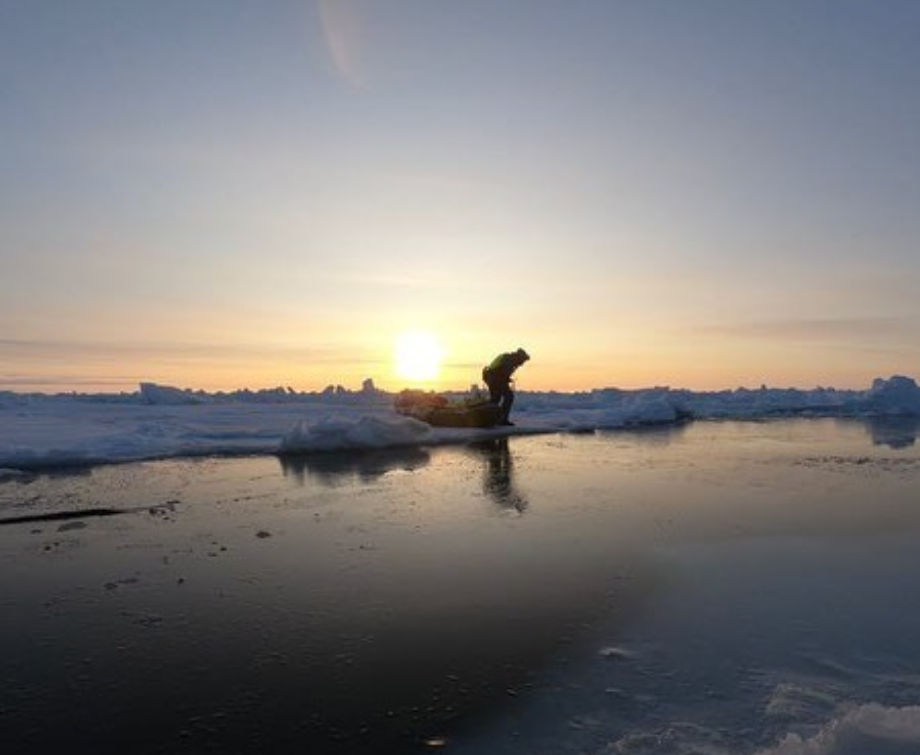
Mike and Borge’s current position was reported yesterday as: 89°35′51″N 140°30′32″E
The latest SMOS Arctic sea ice “thinness” map shows sea ice starting to form on the shores of the Laptev Sea:

The Centre for Polar Observation and Monitoring (CPOM) have just published the first CryoSat-2 Arctic sea ice thickness map of the 2019/20 freezing season:
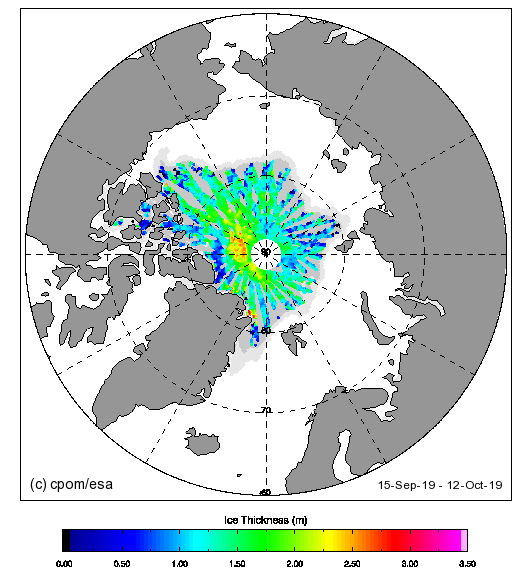
Note in particular the dark blue area north of the Canadian Arctic Archipelago.
Wipneus has just crunched the October mid month PIOMAS numbers. Here are the results. Not only the modelled Arctic sea ice thickness map:
but also the Arctic sea ice volume graph:
Over on Twitter Judah Cohen suggests that:
Maybe I will discuss more in the next blog but the #Arctic sea ice growth season on the North Pacific side of the Arctic is just nuts, like it is drunk! Looks unprecedented to me. This needs to be watched through the #winter. Already had 2 unprecedented winters in the Bering sea pic.twitter.com/sAVoZXgNAX
— Judah Cohen (@judah47) October 20, 2019
Here’s the evidence:
I have been trying to bring the implications of this to the attention of the denizens of Judith Curry’s “Climate Etc.” blog, thus far with remarkably little success! This is the gist of my argument:
See:
“Warming of the interior Arctic Ocean linked to sea ice losses at the basin margins” Mary-Louise Timmermans, John Toole, Richard Krishfield (2018)
“Summer solar heat absorption by the surface waters has increased fivefold over the same time period, chiefly because of reduced sea ice coverage.”
“The effects of an efficient local ice-albedo feedback are thus not confined to the surface ocean/sea ice heat budget but, in addition, lead to increased heat accumulation in the ocean interior that has consequences far beyond the summer season.”
“In the coming years, however, excess Beaufort Gyre halocline heat will give rise to enhanced upward heat fluxes year-round, creating compound effects on the system by slowing winter sea ice growth.”
Watch this space!
Thanks for this latest post, Jim. Always worth waiting for.
Thanks for your kind words David!
According to Janek Uin from Brookhaven National Laboratory:
Somebody over at Judith Curry’s “Climate Etc.” blog has been extolling the ancient virtues of PIPS. I wonder if they are aware that PIPS was succeeded by ACNFS which was then pensioned off by the US Navy in favour of GOFS:
Nope. I wasn’t aware Jim, but I am now. Plus I’ve found your site too.
Thanks will read more later
Okay previous comments seems to be gone. Or in moderation of some such. Apologies if I triggered something. So reading trial docs for acnfs. Will take me a while to catch up. Seems pips gave better results with regard to thickness. But worse with regard to ice edge. Need to drill further into that. But thanks for pointing me in the right direction. Its greatly appreciated. Lots to read. Will get back to you when done.
[It’s been a busy day BB! – Mod]
Numbers weren’t really out until October the 8th UK time, were they. The data wasn’t published until Frozen Earth lit a fire under Seattle’s backside:
I think you’ll find that the Arctic wide numbers calculated by Wipneus from the PIOMAS gridded thickness data are in remarkably close agreement with those ultimately published by the PSC.
The 2 numbers provided by Wipneus are (almost) just fine. I’m talking about the other 28. September is a 30–day month, at least it is up here.
Having all 30 days, the full month of September, we are for instance able to figure out when the sea ice volume minimum was. You know, minor things like that. If you want to take the wider perspective and just say the Arctic is colder than the Equator, be my guest. But for myself, I prefer to get the actual, real data, for better or worse.
FE – Wipneus calculates the Arctic wide volume for all the days of each month once the gridded thickness numbers are released. See the daily volume graph above, published on October 5th. Click the link to the ASIF to find all sorts of other PIOMAS based “facts about the Arctic”.
Further to our conversation over on Twitter, which you apparently don’t wish to pursue there, what’s your beef with Axel Schweiger?
True, he does that, but Wip also conceded himself that he couldn’t say for sure which day of the month would be the official minimum. If you look at how much time other people spend debating the extent maximum in the spring, which is far less important, I’m sure you’ll understand why 1 person on this planet wants to have the actual numbers. And also, U of W in Seattle do have the gridded thickness, because they produce them. So they could easily get the daily numbers out, they just don’t want sea ice collapse to hit the corporate news, ever.
FE – If you recall, over on Twitter you said this to my Arctic alter ego:
And?
And you’re accusing me of “liking lies”, and Axel Schweiger of being a “lying liar”.
Surely you must know the drill by now? Where’s your evidence for those scurrilous allegations?
This may come as lightning from a clear blue sky for you, but said scientist put out a tweet containing untrue statements, and you’ve since written a net total of 10–20 tweets and/or comments defending his actions. I’m merely suggesting that our views differ about the value of propagating untrue statements (I know you anglosphere guys don’t take kindly to the L–word), and I’ve already suggested that we just agree to disagree about this. Meaning you won’t have to change your position on the greatness of spreading untrue stuff on the Internet.
Personally, I just find it erodes trust etc, but that’s just me.
Two tweets in actual fact. Asking a question rather than “defending his actions”. So at the risk of repeating myself:
Which alleged “tweet containing untrue statements” are you referring to?
Jim, I understand this is and has been very hard for you, so suffice it to say that somewhere on the Internet, not saying it was on Twitter, said scientist presented some claim, and another place on the Internet, not saying it was immediately below said claim, another human entity falsified said claim. A third person didn’t appreciate said falsification, even though the scientist thanked the other human entity for presenting the falsification of his claim.
This is how science works: You present a thesis, it gets verified or falsified. In our case it was falsified. It’s not the end of the world.
It’s only hard for me in so far as I still don’t understand WTF you are talking about.
That’s because thus far you have provided me with only vague allegations instead of links to evidence.
Thanks for the data.
My pleasure Fernando.
“Wipneus has just crunched the October mid month PIOMAS numbers.”
Jim, where would one look if one wanted to see the October 1–14 volume data from PIOMAS?
Follow my link over to the Arctic Sea Ice Forum, where this link would be revealed:
https://sites.google.com/site/arctischepinguin/home/piomas/data/PIOMAS-regional.txt.gz
Add up the regions to get an Arctic wide total. Then compare and contrast Wipneus’ calculations with the “official” numbers when they are ultimately released:
“Whilst we await the PIOMAS volume numbers which generally arrive around the 5th of each month”
I think they’re going for the 8th this month. What’s their latest report on record again?
Make that the 9th. PIOMAS seems to have forgotten how to spell the word ‘service’.
If I can get paid money for being THAT laid–back, I want to be a ‘Climate Scientist’ as well! Sheesh …..
November 10th is a Sunday. Maybe he can publish the numbers on his day off?
The changes to the Arctic clearly are no fun anymore for Polar Science Center bigwig Axel Schweiger, as we can see from the fact he never updated the text on his little page about sea ice volume on Planet Earth, and also never cared to tweet about the VERY late stealth release of the October Arctic sea ice volume numbers. I dunno, maybe he thought the mainstream media and its consumers would stop thinking ice had a 3rd thickness dimension if only he released numbers VERY late and very quietly? This is a scientist who is VERY ashamed of his important work within climate science. Is he just following orders, or has he had a change of heart wrt the value of science?