We generally write our periodic reports on the state of Arctic sea ice around the time the PIOMAS volume numbers are published. It seems as though we’ll have a long wait for that to happen at the moment though. According to The Economist today:
America’s government shutdown has become the longest in history. Hundreds of thousands of federal workers remain either stuck at home or forced to work without pay. To reopen the government President Donald Trump is demanding $5.7bn for his border wall. Nancy Pelosi, who presides over the most polarised House of Representatives in recent memory, does not want to give it to him.
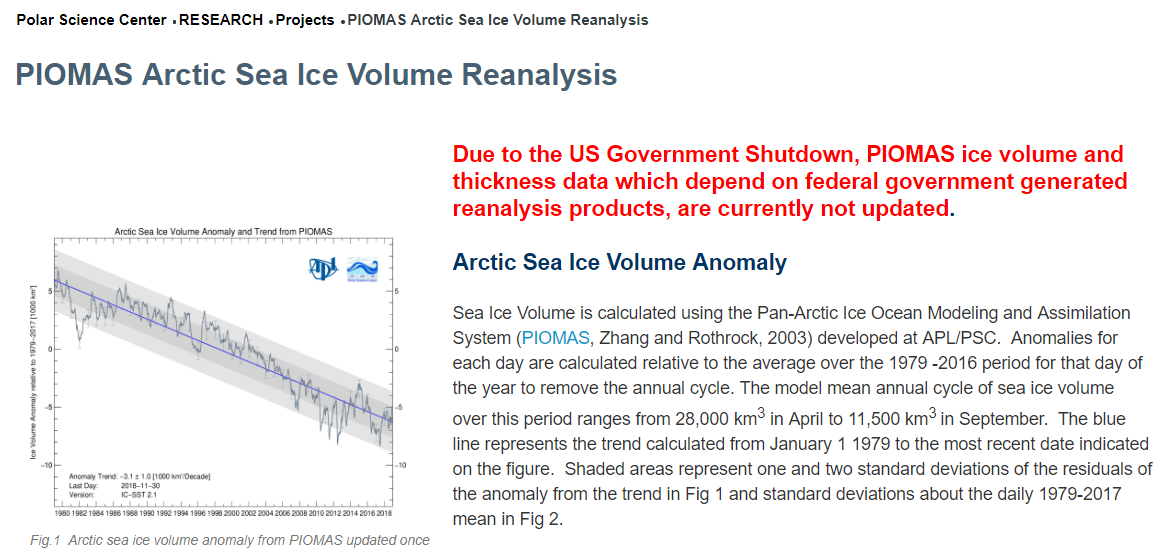
and according to the Polar Science Center at the University of Washington:
Due to the US Government Shutdown, PIOMAS ice volume and thickness data which depend on federal government generated reanalysis products, are currently not updated.
Instead of PIOMAS, let’s start instead with the January 2019 edition of the National Snow and Ice Data Center’s Arctic Sea Ice News:
As 2018 came to a close, Arctic sea ice extent was tracking at its third lowest level in the satellite record, while sea ice in the Antarctic remained at historic lows. Slightly faster growth in the first few days of the new year, mostly in the Pacific sea ice areas, has the daily sea ice extent at fifth lowest as of this post.
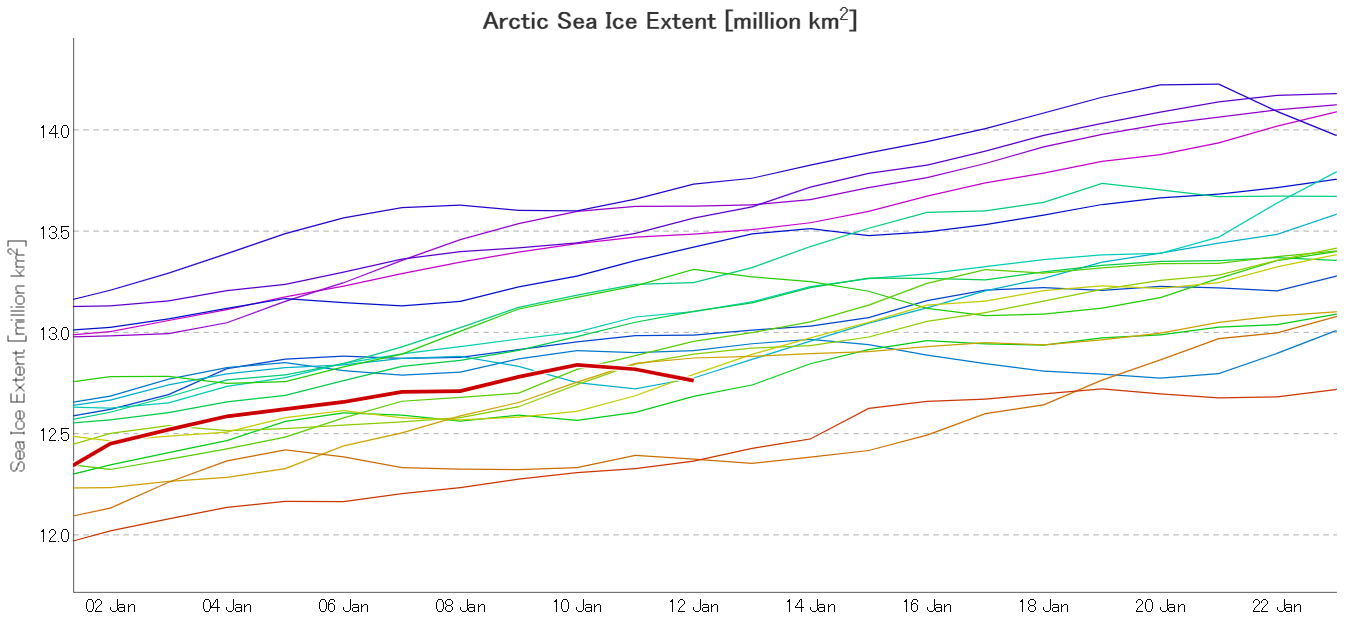
Now let’s take a look at our favourite high resolution AMSR2 area and extent metrics:
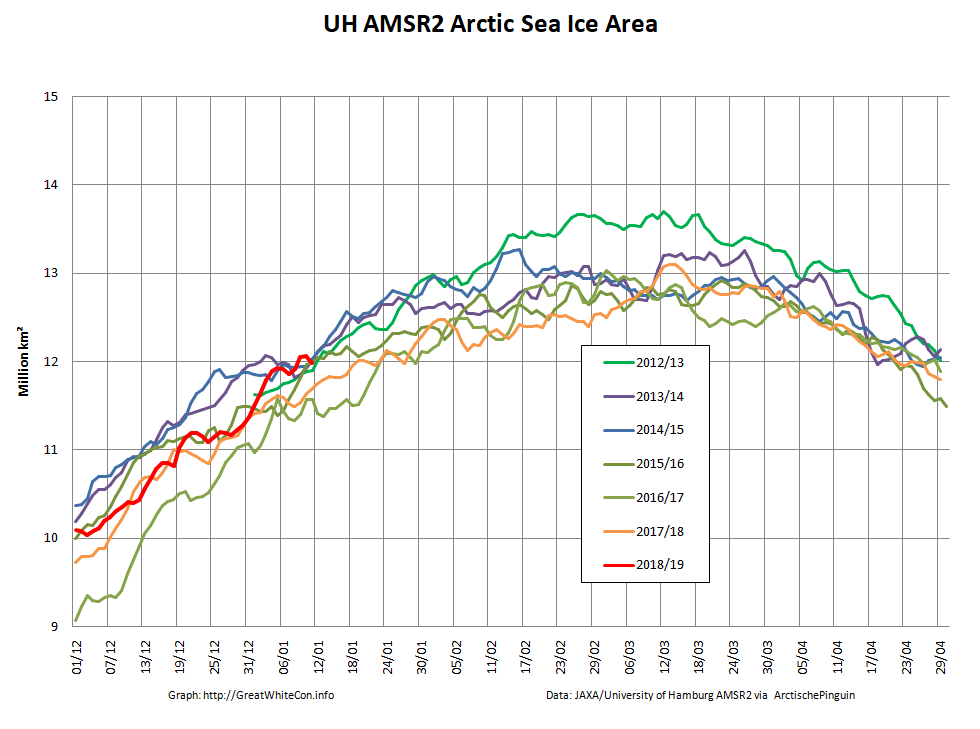
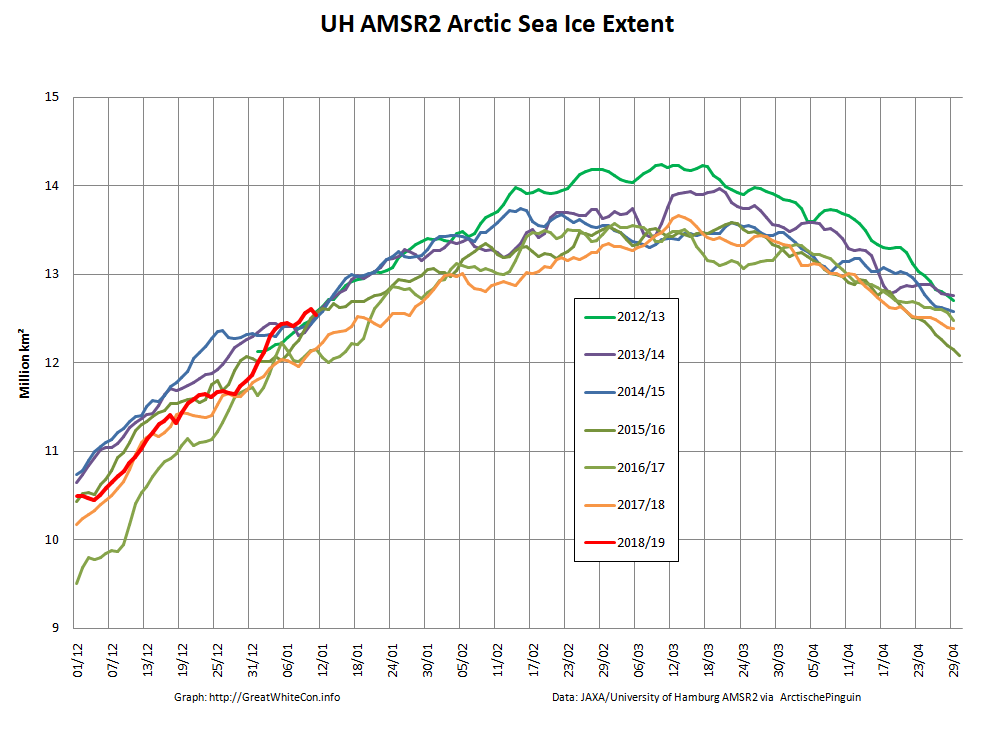
You can see that towards the end of December Arctic sea ice extent was verging on lowest for the date, since when it has risen quickly to reach highest for the date in the brief AMSR2 records a few days ago.
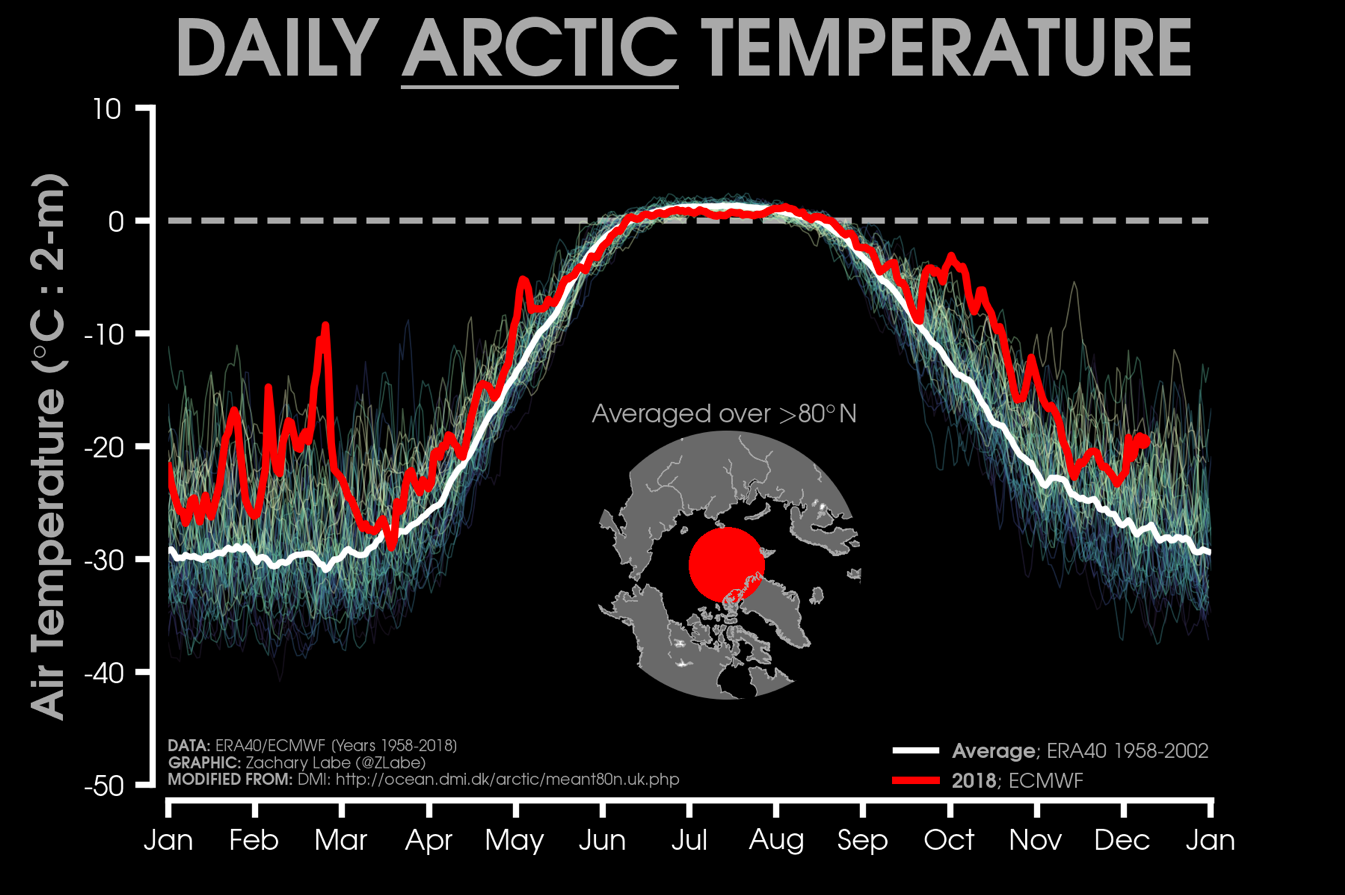
The NSIDC also mention the US Government shutdown:
Unfortunately, as a result of the partial government shutdown, we are unable to access the National Oceanic and Atmospheric Administration (NOAA) pages to retrieve information on atmospheric air temperatures and sea level pressure patterns. Instead, we turn to daily (2 meters above the surface) mean air temperatures north of 80 degrees North from the European Centre for Medium-Range Weather Forecasts (ECMWF) operational model. This analysis shows that air temperatures remained above the 1958 to 2002 average for all of December.
That brings us on to our Arctic freezing degree days graph, based on DMI data:
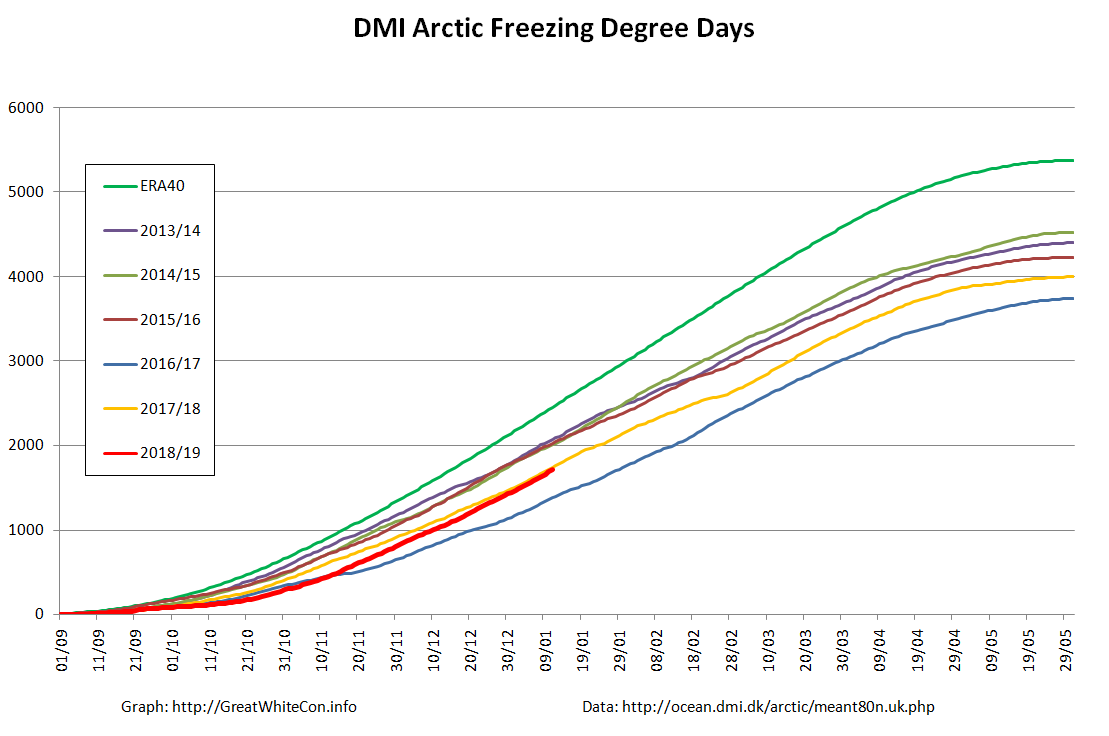
After a very slow start to the freezing season the FDD numbers are now vying for second place with last year, behind the astonishingly warm winter of 2016/17. In the absence of the PIOMAS volume numbers we can at least take a look at sea ice thickness. Here’s CryoSat-2:

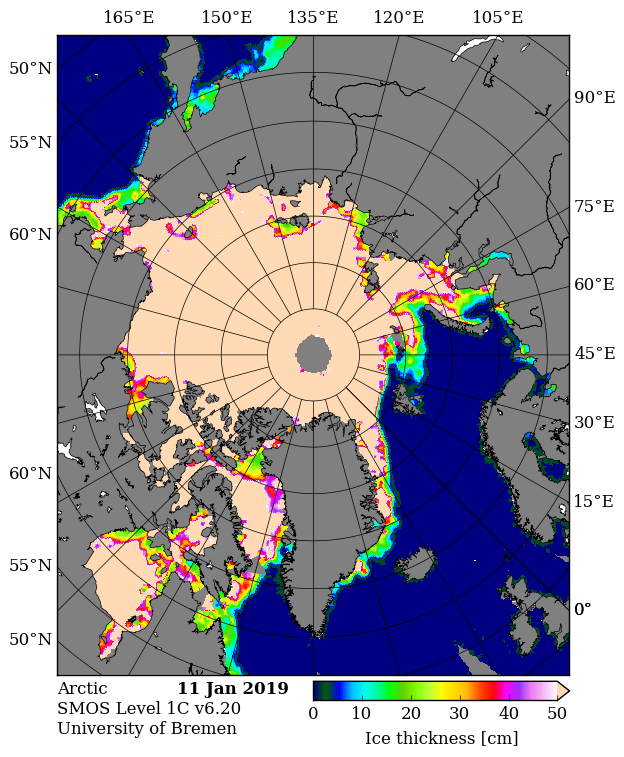
followed by SMOS:
and since a change is as good as a rest here’s the latest map from the Russian Arctic and Antarctic Research Institute for good measure:

All those sources seem to be agreed that large areas of both the Barents and Kara Seas are currently covered by young thin ice. Finally, for the moment at least, let’s take a look at some extracts from the NSIDC’s review of 2018:
January 2018 began the year with record low sea ice extents for the Arctic as a whole.
The seasonal maximum, reached on March 17, 2018, was the second lowest in the satellite record. While low extent persisted through April and May, sea ice loss during early summer was unremarkable despite above average 925 hPa air temperatures over the Arctic Ocean and Eurasia.
Air temperatures over the Arctic Ocean in July were below average, followed by above average temperatures in August. In fact, on average, August temperatures were higher than July temperatures in 2018. This is highly unusual in the Arctic and something not seen in at least 40 years.
The September 2018 seasonal minimum extent ended up slightly above the long-term linear trend line, tying with 2008 for the sixth lowest in the satellite record. After the minimum, the ocean was slow to freeze up, and October sea ice extent ended up as the third lowest. However, ice growth was very rapid in November, such that November 2018 extent approached the interquartile range of the 1981 to 2010 median. Nevertheless, large amounts of open water remained in the Barents and Chukchi Seas. By the end of December, ice conditions in the Chukchi Sea were back to average, while extent remained unusually low in the Barents Sea.
Coverage of old ice (greater than 4 years old) over the Arctic continued to decline. Such old ice covers only 5 percent of the area it used to in 1980s.
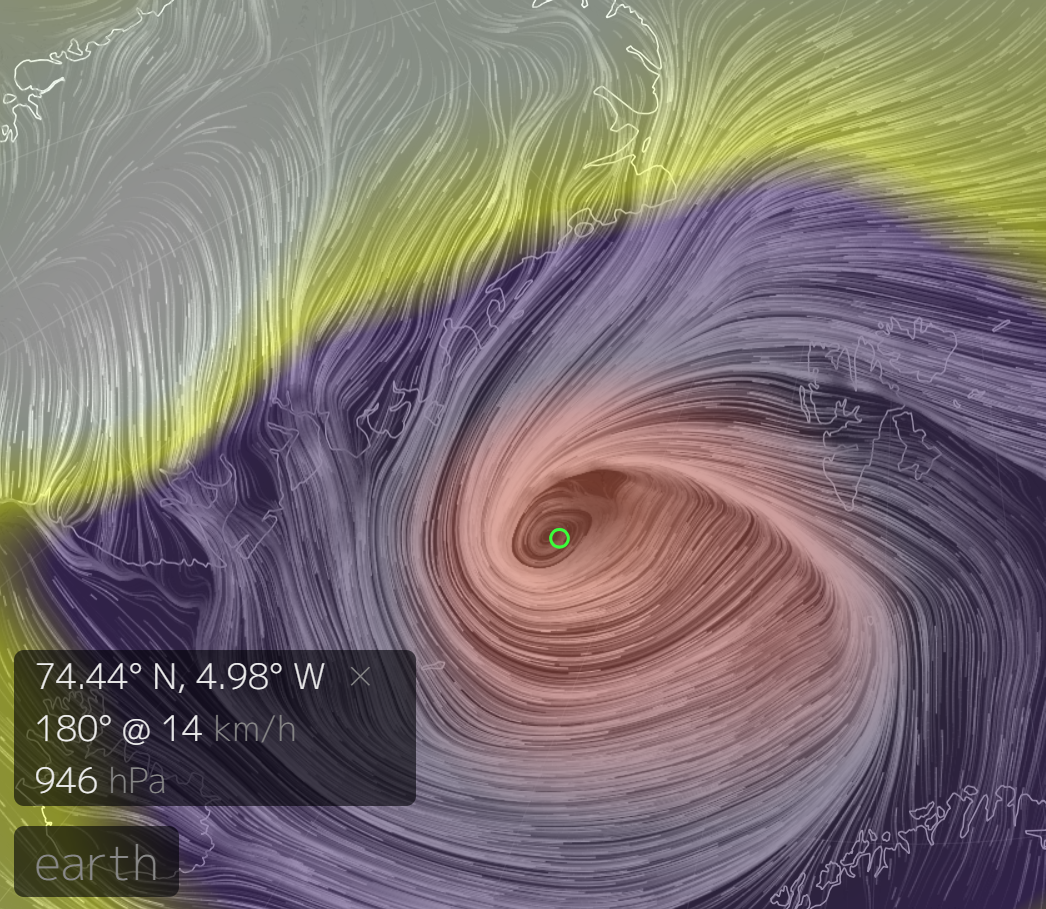
Arctic sea ice area and extent have both been falling over the last few days, possibly as a result of the recent cyclone which created strong northerly winds in the Fram Strait. This is from Earth at 09:00 UTC on January 10th, showing a MSLP of 946 hPa:
Here’s what used to be referred to as JAXA extent:
Meanwhile up in the stratosphere at 10 hPa the polar vortex has gone into reverse:

Or to be more precise:
So I was being overly colloquial?!
Continuing your line of argument, the northern hemisphere winter vortices are now plural and no longer "polar"? They are "Siberian" and "Canadian"?
— Snow White (@GreatWhiteCon) January 13, 2019
So the facts are that as of now, sea ice is significantly low in only one sea (the one facing the Gulf Stream, and the Bering Sea is fully recovered from the northern Pacific “hot spot”, so widely touted a few years ago. I suspect that every one will now turn to the Antarctic, which is in a down phase after record high extents a few years ago. Looks cyclical to me, but’s that’s Climate Change for you – less predictable than many expected …
The Bering Sea is hardly “fully recovered”:
Since you mention the Antarctic, sea ice extent down under is currently lowest for the date in the satellite record:
In fact 2018 being among the 2010s can be hardly considered cyclical. You would need an extent recovery three times the size of UK to be back in the 80s. That in Winter. Much more in Summer. Cyclical? Read the numbers!
Hmmmm….cyclical?
Arctic SIE is the 4th lowest on record for the date.
https://forum.arctic-sea-ice.net/index.php/topic,2533.msg186305.html#msg186305
Any idea why the DMI thickness shown here is (always) much thicker than the cryostat??
http://polarportal.dk/en/sea-ice-and-icebergs/sea-ice-thickness-and-volume/#c23629
One’s a “model” and the other is a “measurement”?
By way of another interpretation of the thickness numbers here’s a new “prototype” combined CryoSat-2/SMOS Arctic sea ice thickness product from the Finnish Meteorological Institute , including gridded data:
On March 6th 2019 is the Arctic ice cover increasing faster than 2018? Is the ice cover loss in the Antarctic more or less than any Arctic gain? Is break off area still included as total Antarctic cover?
Hi Earl,
Please forgive my ignorance, but what do you mean by “break off area”?