A storm is brewing in the Arctic. A big one! The crew of the yacht Northabout are currently sailing along the western shore of the Laptev Sea and reported earlier today that:
The sea is calm. Tomorrow a gale 8. But this moment is perfect.
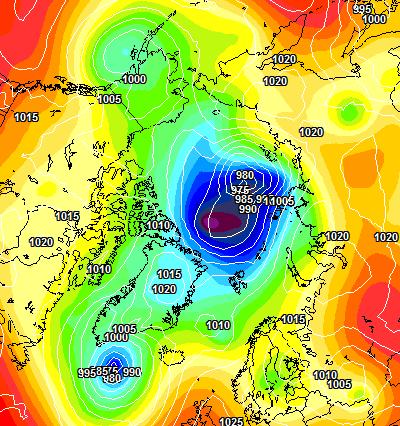
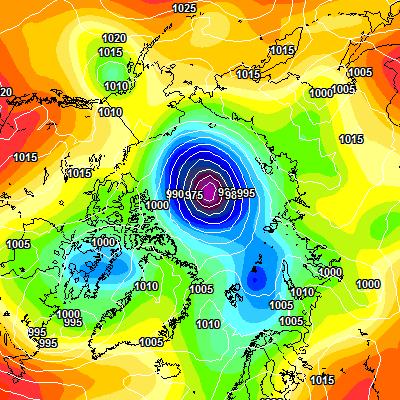
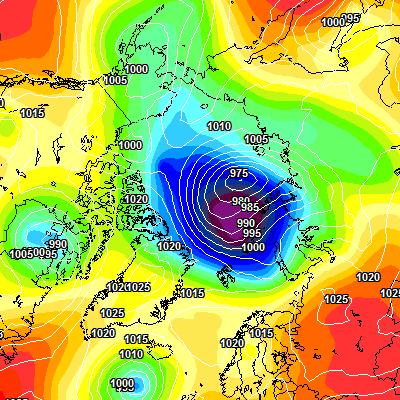
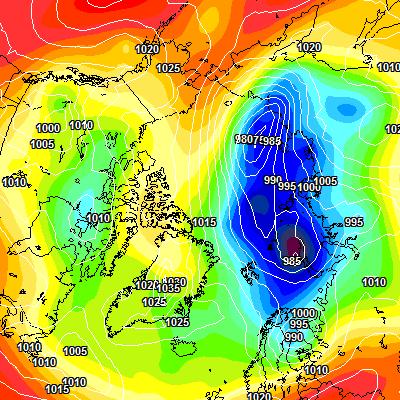
That perfect moment will not last long. Here is the current ECMWF forecast for midnight tomorrow:
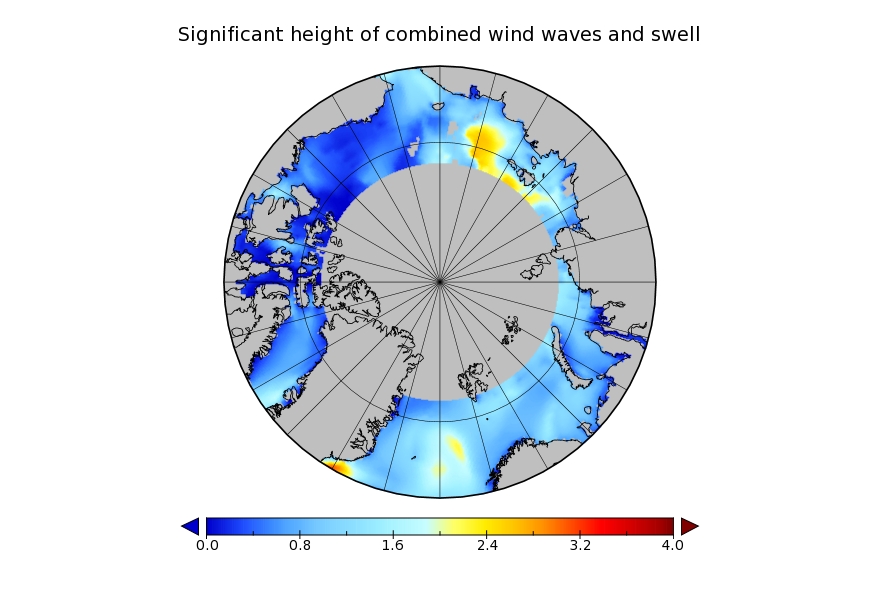
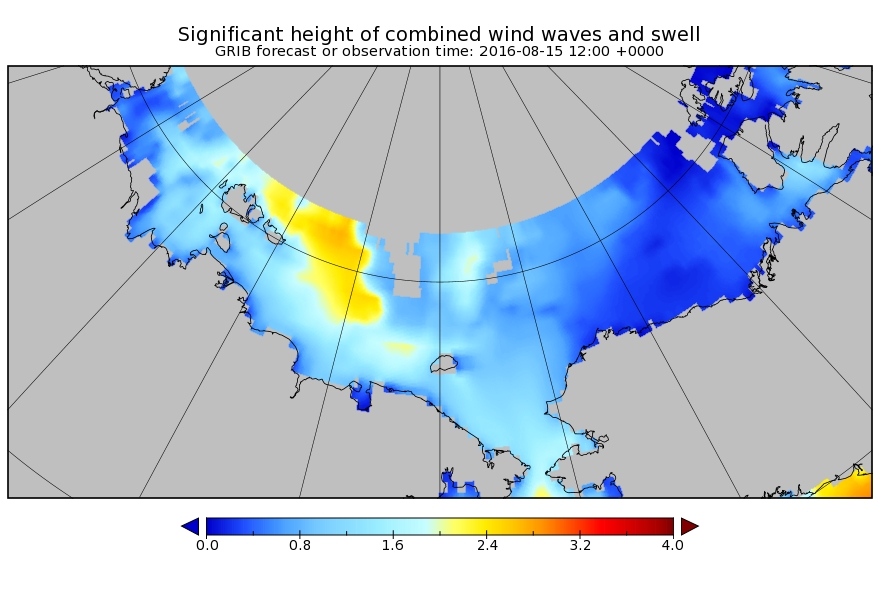
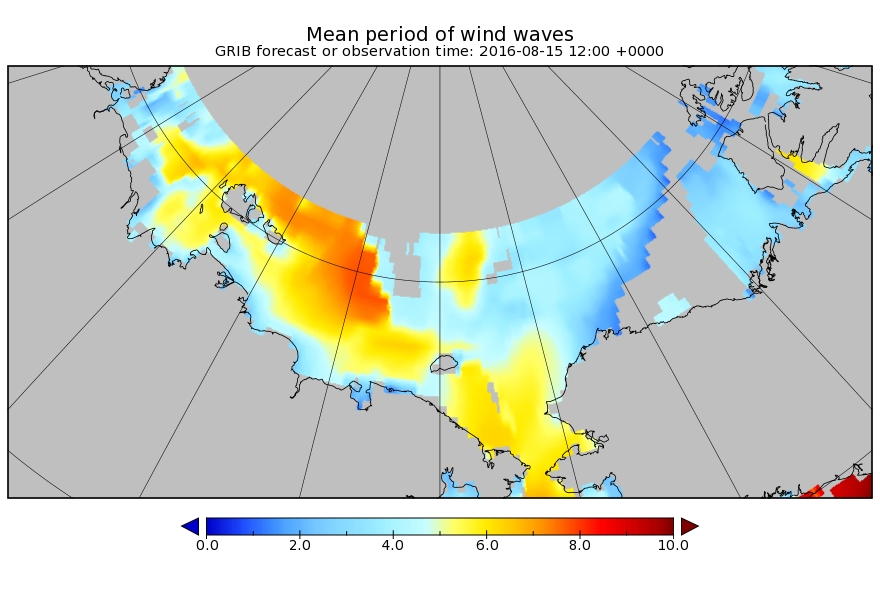
and here is the current Arctic surf forecast for 06:00 UTC on Monday:
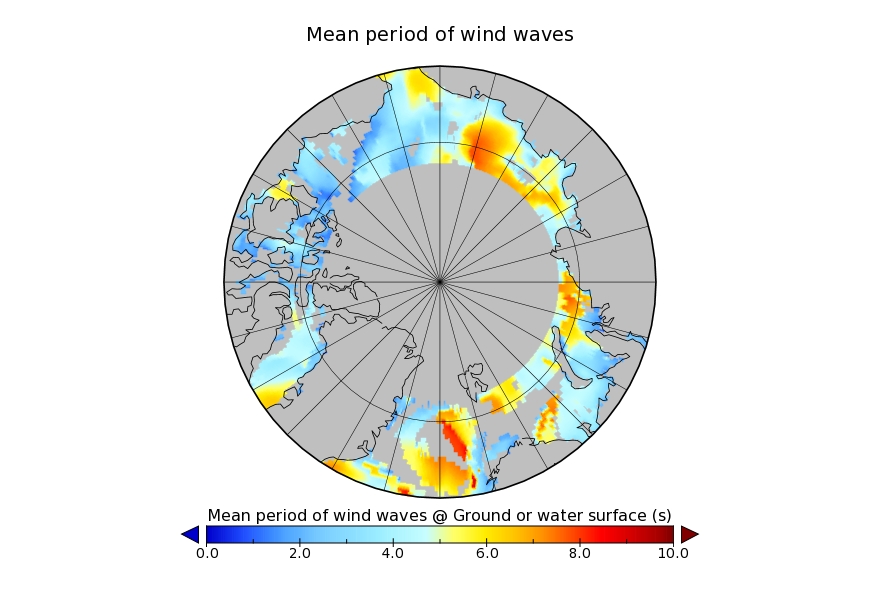
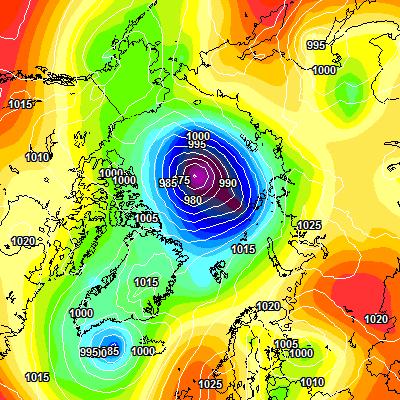
A 975 hPa low pressure system will be creating 3 meter waves with a period of around 8 seconds heading across the East Siberian Sea in the direction of the ice edge. By midnight on Monday the cyclone is forecast to have deepened to a central pressure below 970 hPa:
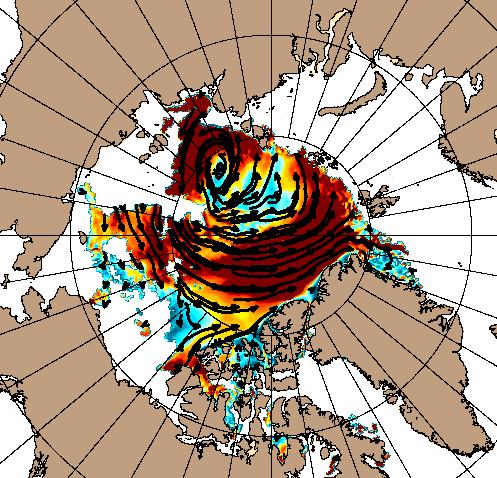
All of this is rather reminiscent of the “Great Arctic Cyclone” in the summer of 2012, which looked like this on August 7th:
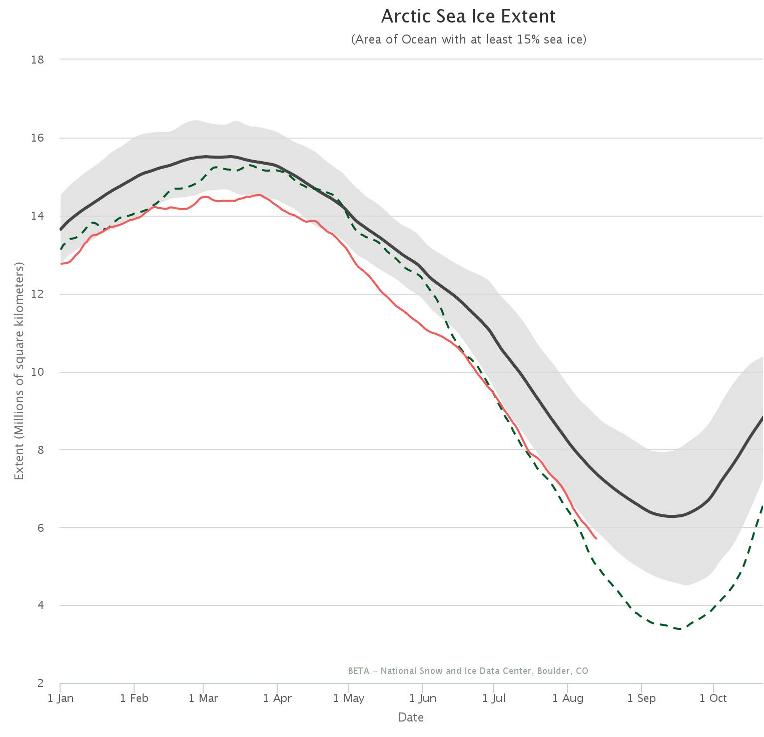
and which ultimately led to the lowest Arctic sea ice extent in the satellite record. Using the National Snow and Ice Data Center’s numbers that was 3.41 million square kilometers on September 16th 2012. Here’s the NSIDC’s current graph comparing 2012 with this year:
I wonder what the minimum for 2016 will be, and on what date?
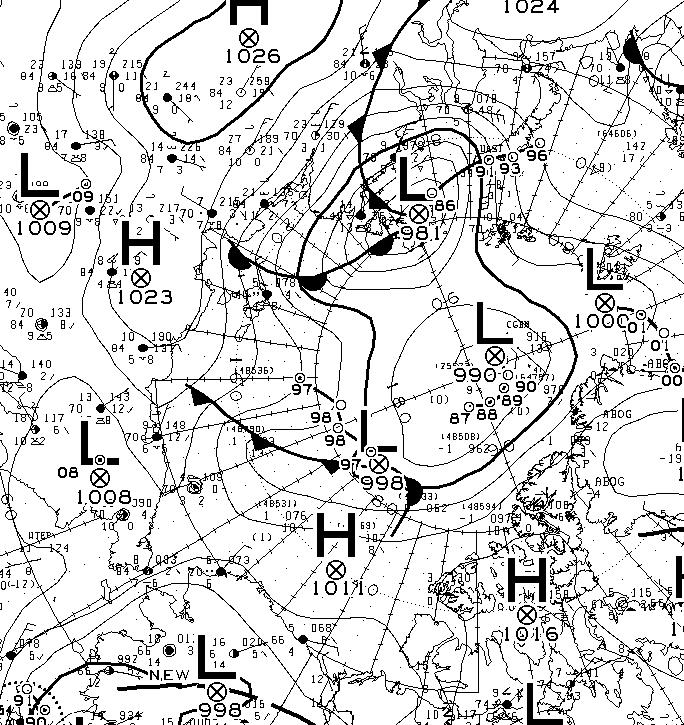
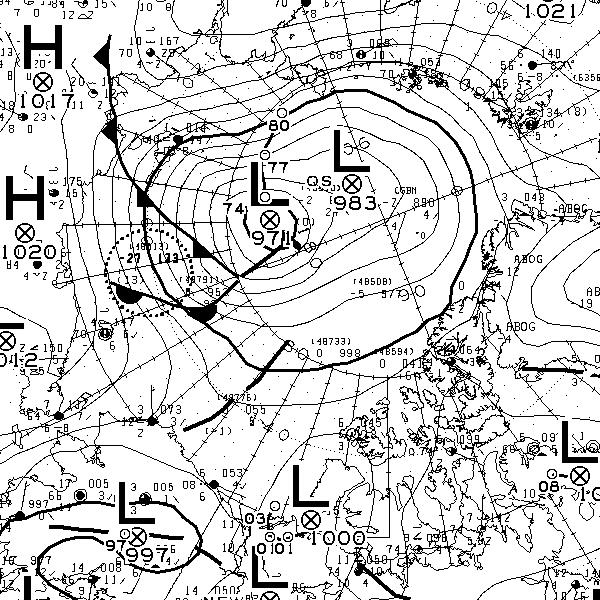
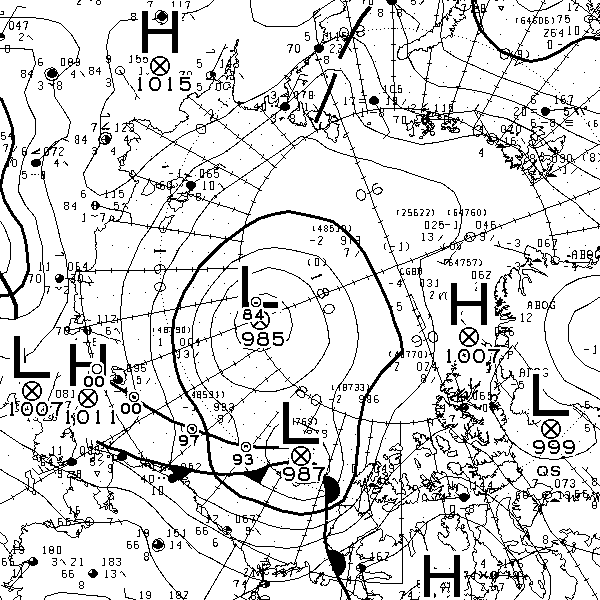
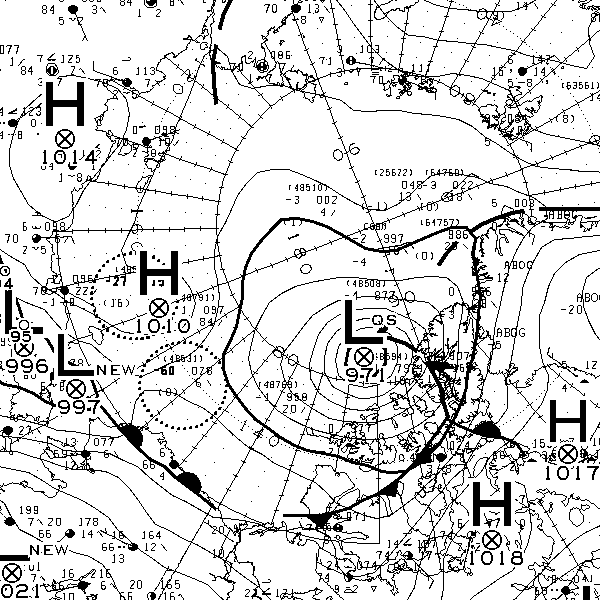
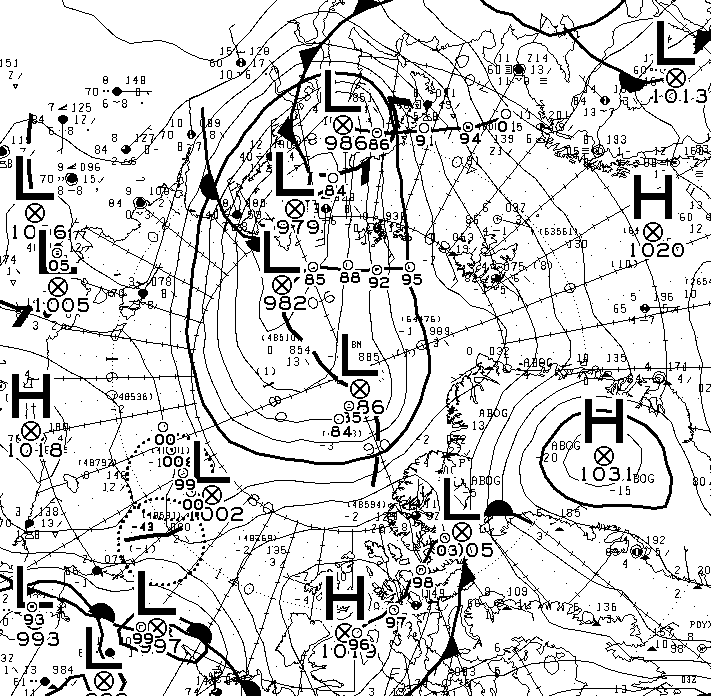
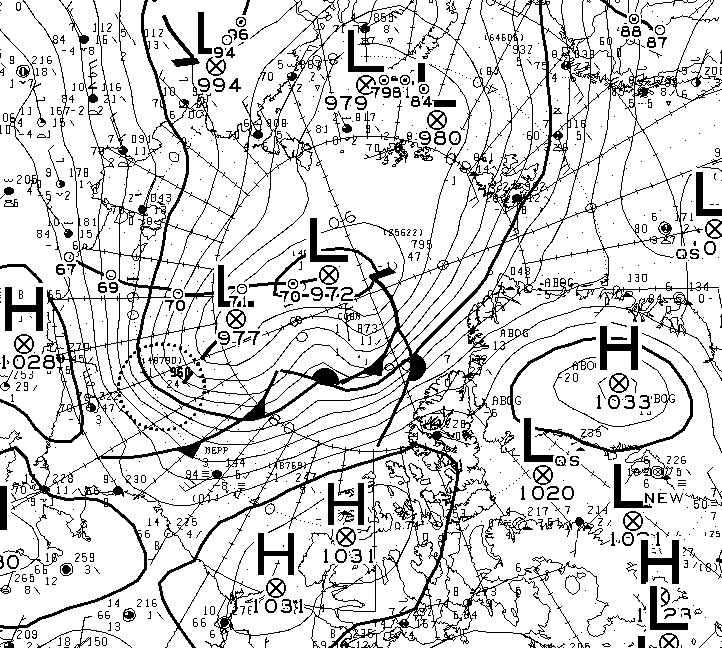
The cyclone is currently centred near Severnaya Zemlya, and the central pressure is down to 981 hPa according to Environment Canada:
Northabout is sheltering from the storm.
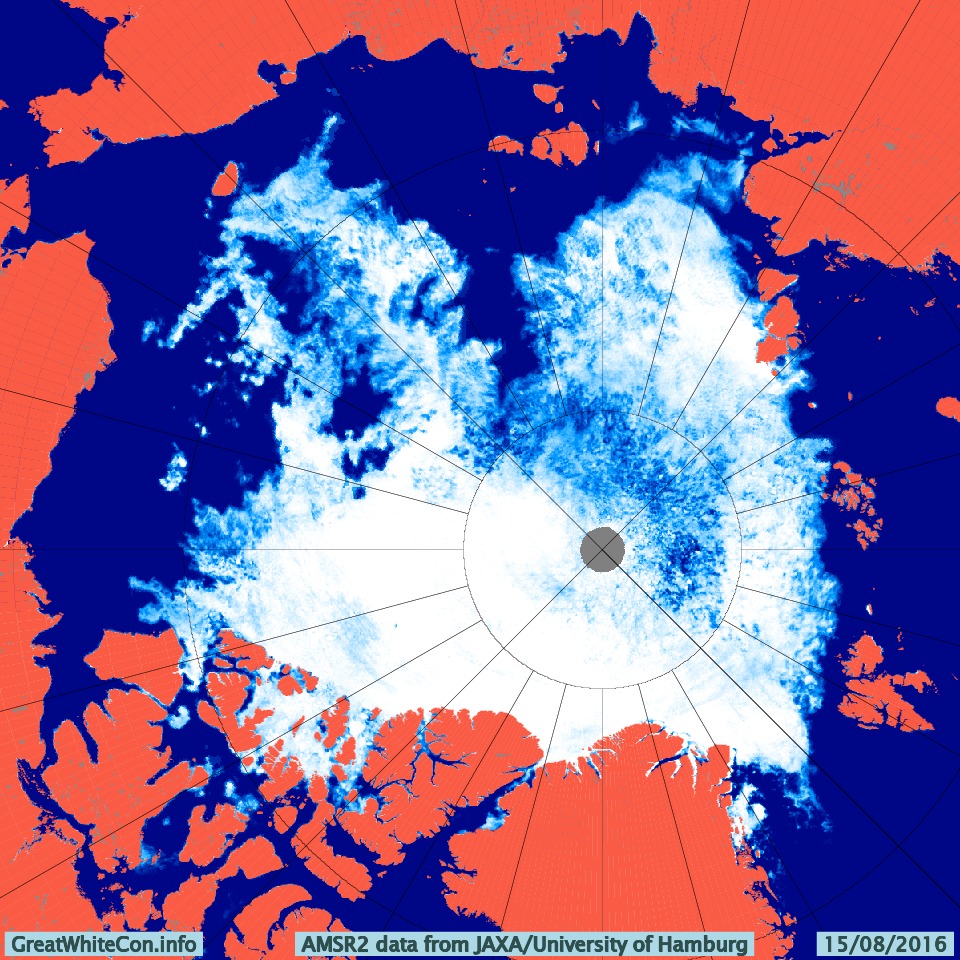
Here’s how the Great Arctic Cyclone of 2016 looks from on high this morning:
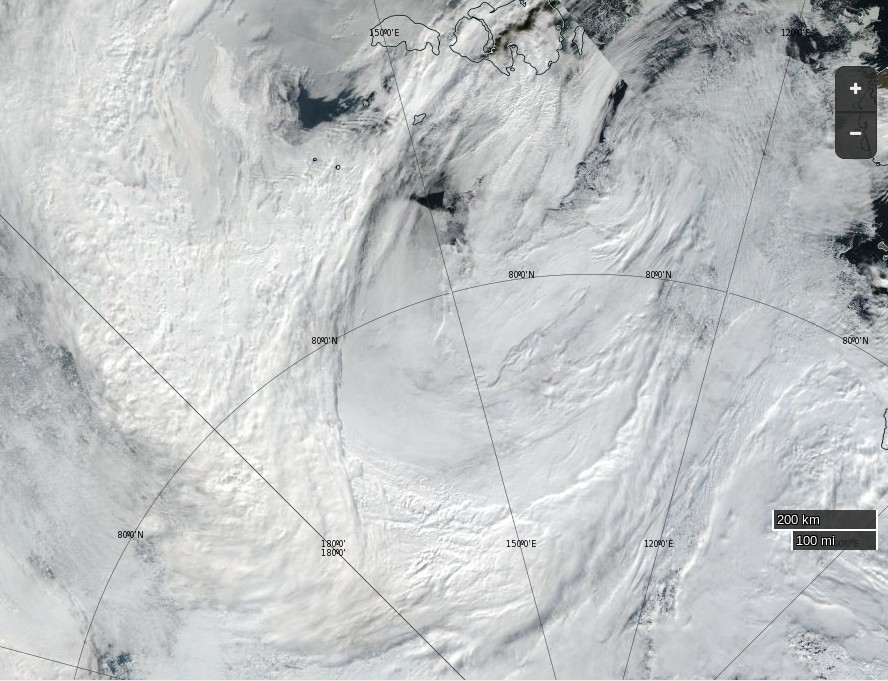
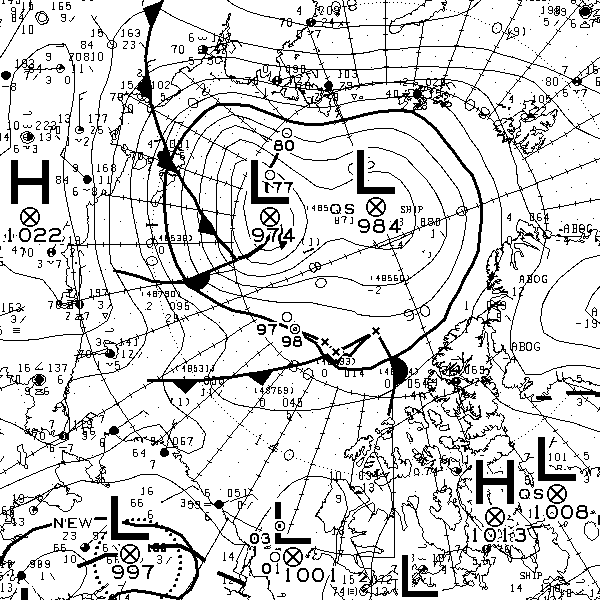
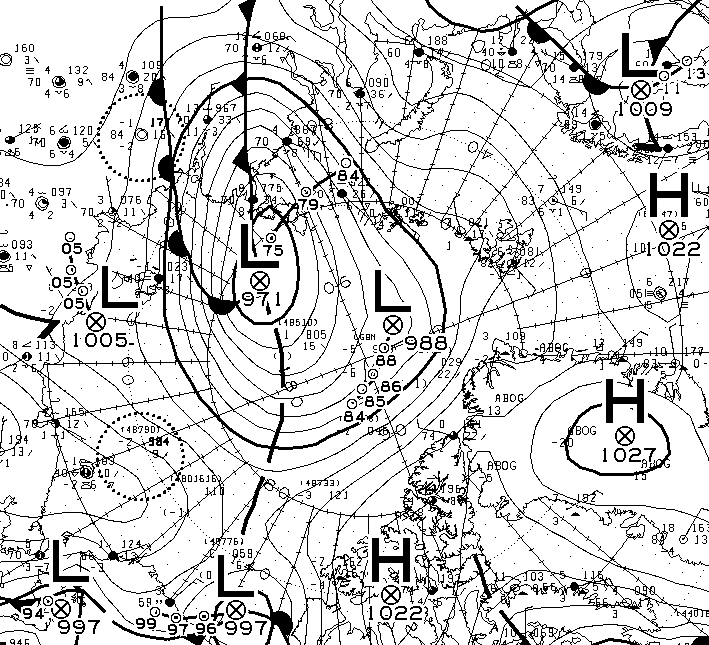
The latest synopsis from Environment Canada shows that the central pressure of the cyclone is now down to 974 hPa:
The WaveWatch III forecast for noon today UTC confirms the forecast of two days ago:
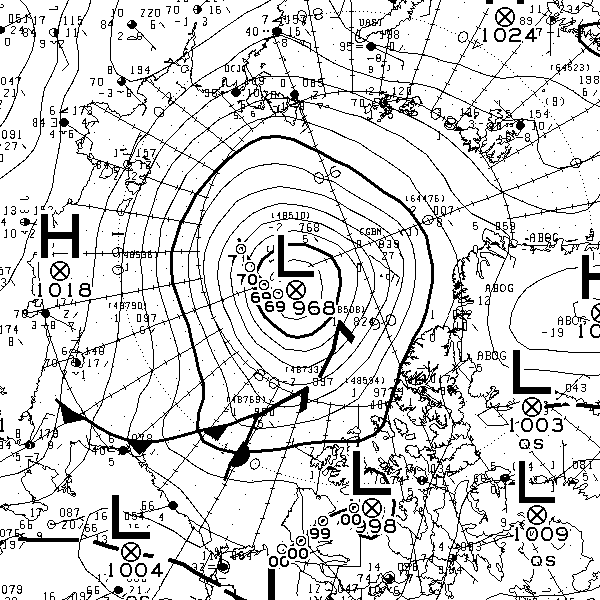
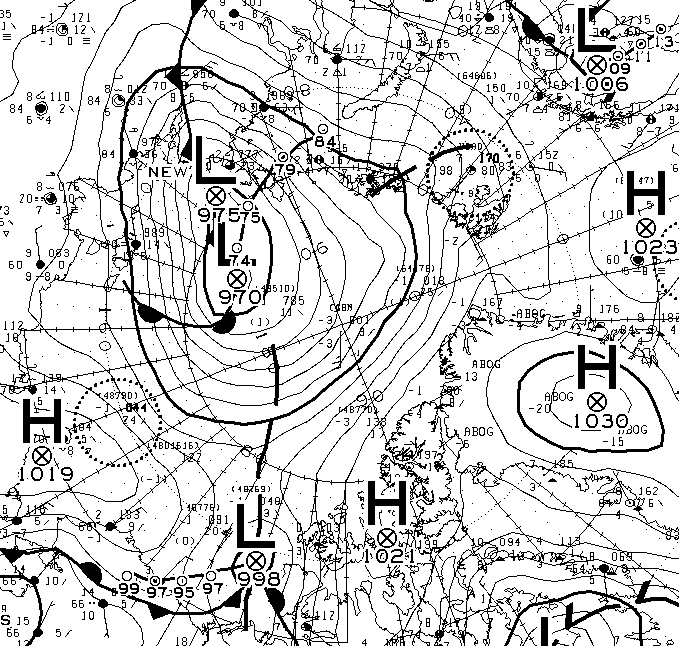
P.S. The Canadian 0600Z synopsis has the cyclone’s SLP down to 971 hPa:
This morning the cyclone’s SLP is down to 969 hPa:
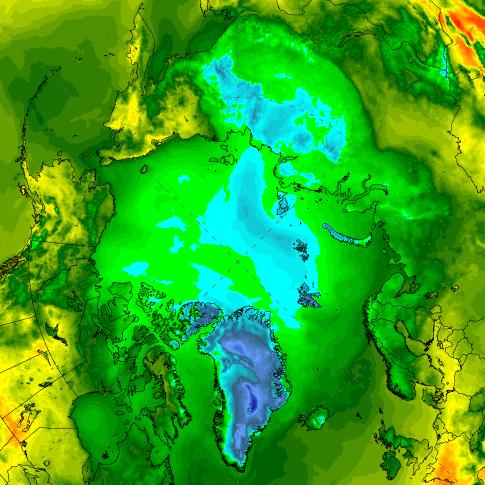
and the clouds over the Central Arctic are parting:
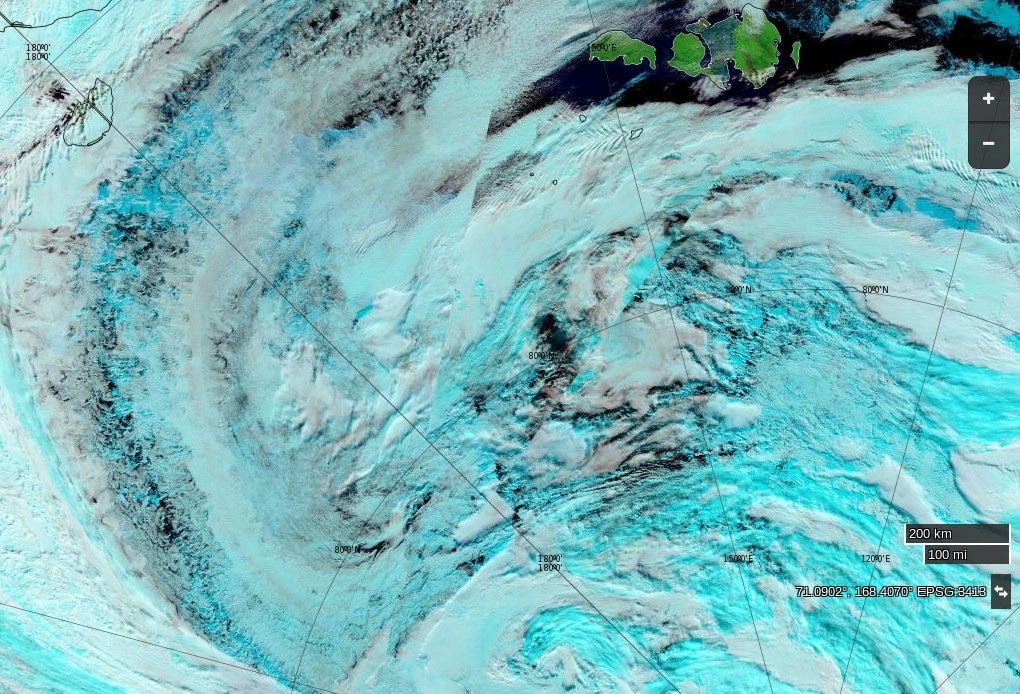
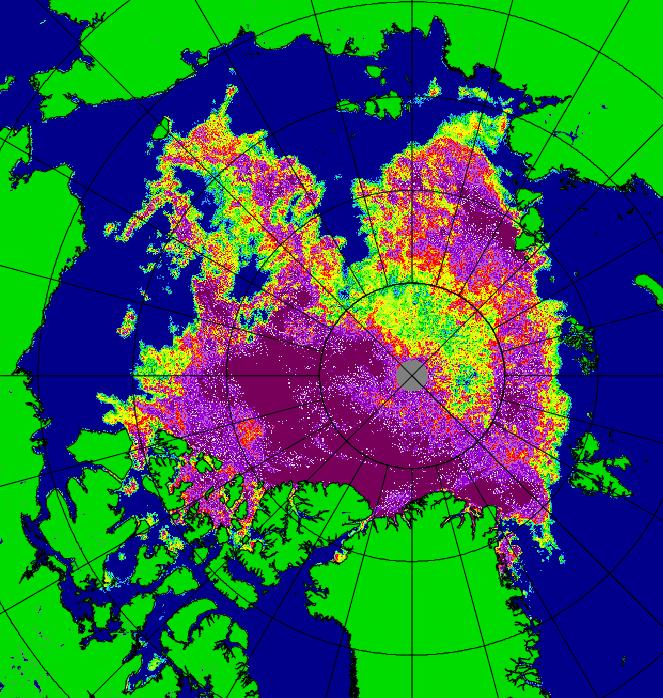
Our favourite method of seeing through the clouds using the AMSR2 maps from the University of Hamburg doesn’t seem to working at the moment, so here’s one from the University of Bremen instead:
P.S. The University of Hamburg high resolution AMSR2 maps are up and running again:
According to Environment Canada the cyclone central pressure bottomed out at 968 hPa yesterday:
However, over on Twitter there is this:
Sea level pressure from buoy near center of #ArcticStorm. (Chart generated by R. James). @AlaskaWx pic.twitter.com/NO7RRvdFG2
— Brian Brettschneider (@Climatologist49) August 16, 2016
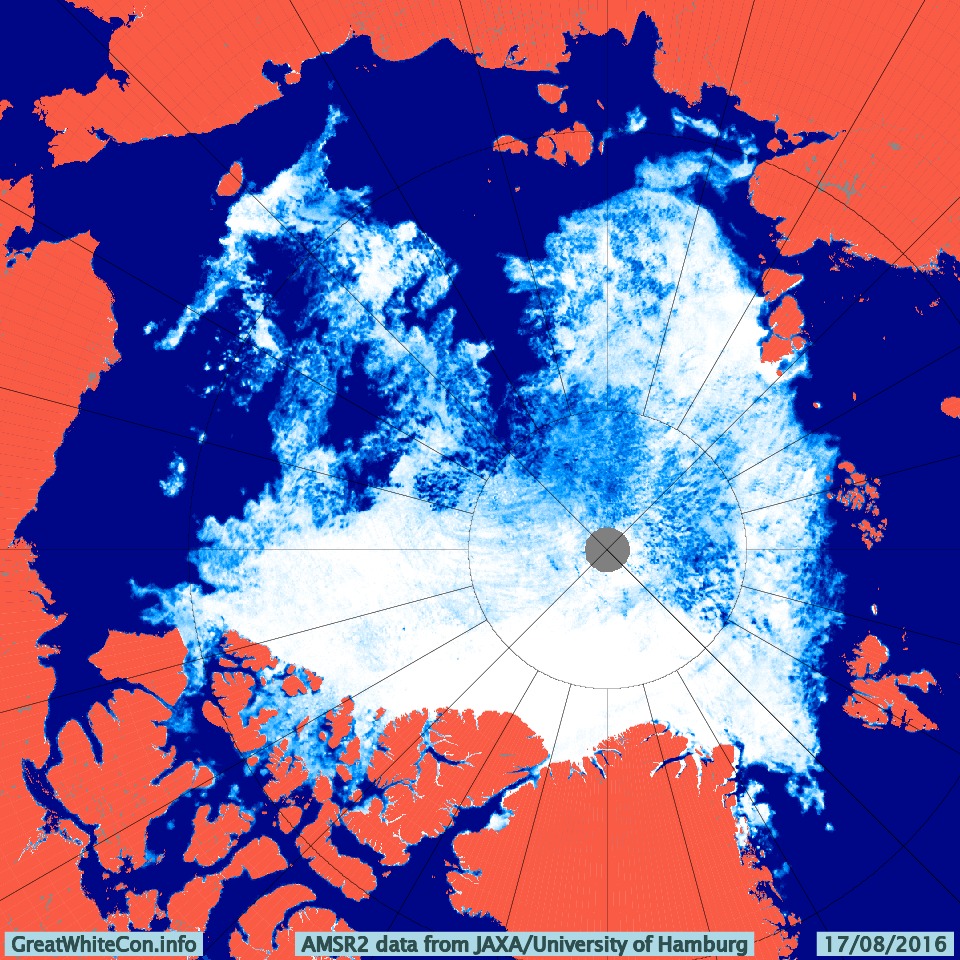
The cyclone central pressure is now up to 983 hPa, and some indications of the effect it has had on the sea ice in the Arctic are being revealed:
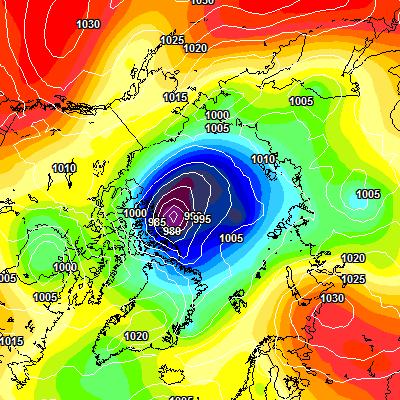
According to Environment Canada the cyclone’s central pressure rose to 985 hPa earlier today:
However the 987 hPa low near the Canadian Arctic Archipelago is currently forecast to deepen below 980 hPa over the next 24 hours. Here’s the ECMWF forecast for first thing tomorrow morning:
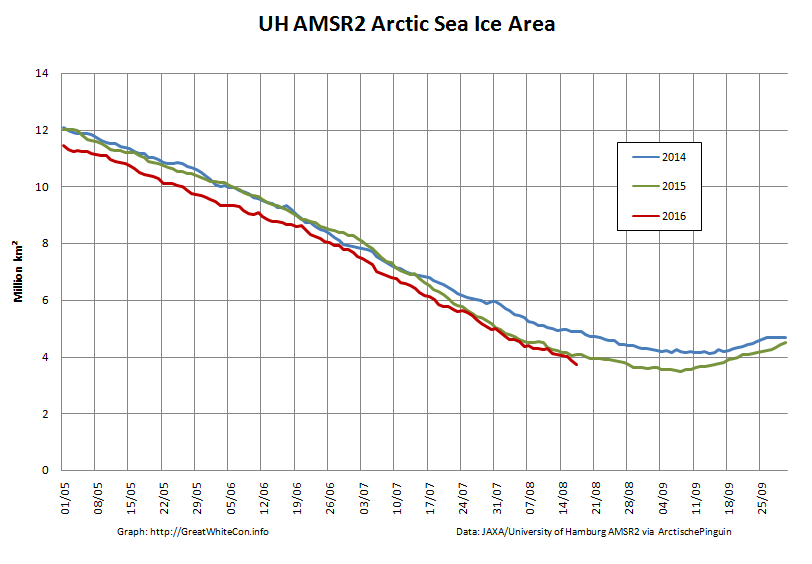
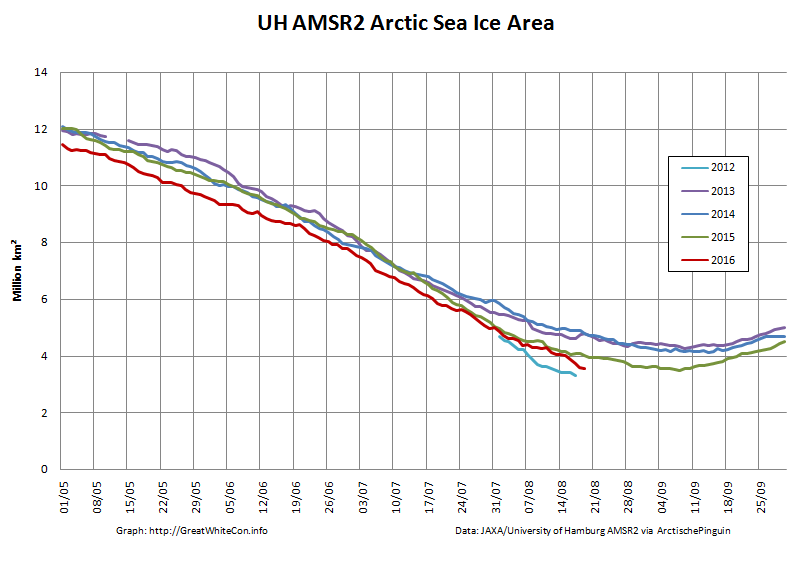
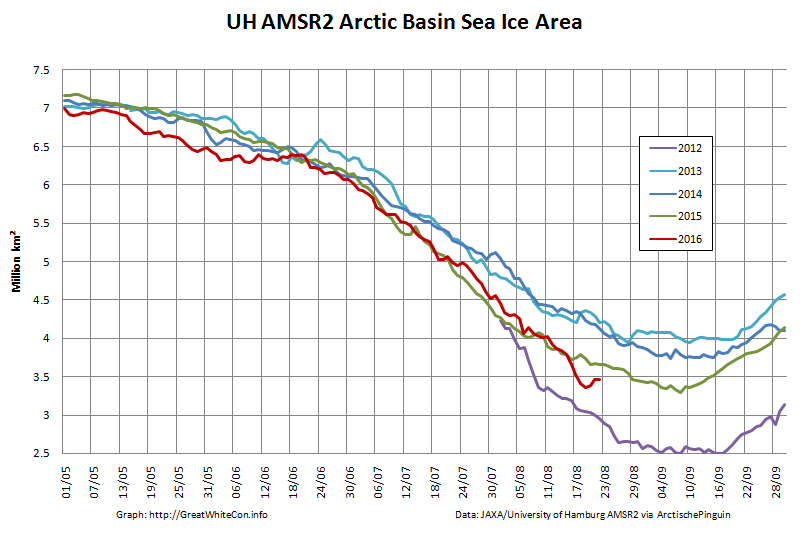
The high resolution AMSR2 Arctic sea ice area has reduced by another 133.5 thousand square kilometers since yesterday. A similar drop tomorrow will take us below the 2015 minimum.
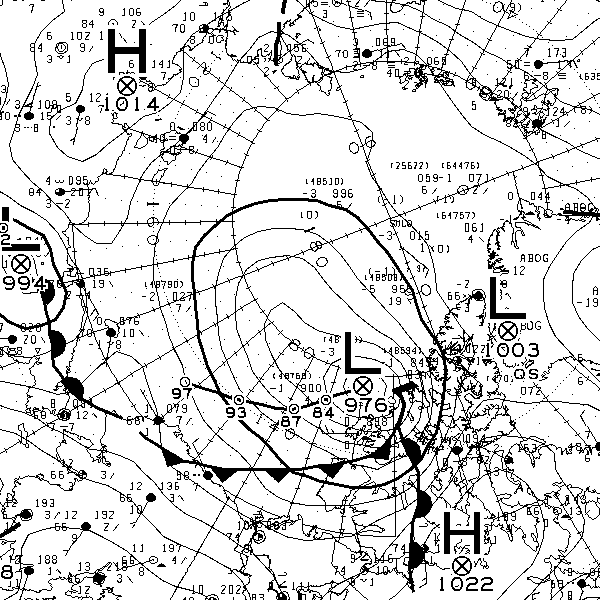
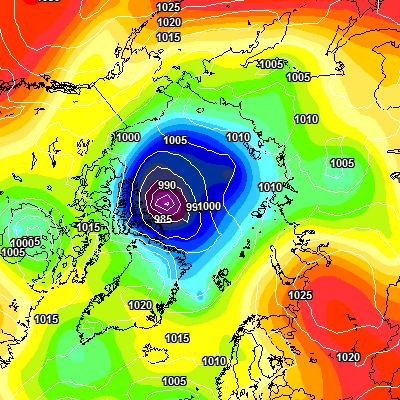
The MSLP of the rejuvenated cyclone had dropped to 976 hPa by 12:00 UTC today:
The ECMWF forecast for lunchtime tomorrow is for something similar:
The current incarnation of the cyclone bottomed out at 971 hPa near the Canadian Arctic Archipelago:
The 72 hour forecast from ECMWF for the next phase of GAC 2016 is beginning to enter the realms of plausibility. Here’s what it reveals:
“Wipneus” reports on the Arctic Sea Ice Forum that:
BREAKING NEWS: Uni Hamburg is releasing AMSR2 sea ice concentration data from 2012. August 1-13 until now.
so here are the latest high resolution AMSR2 metrics, now with added 2012!
The effect on area of the Great Arctic Cyclones of 2012 and 2016 is evident, but 2016 extent looks to have a lot of catching up to do.
Phase 3 of GAC 2016 started with 4 lows in a row this morning:
which have now resolved into a cyclone with 971 hPa MSLP:
Note also the high pressure area over Greenland, and Reggie’s developing dipole. I wonder what tomorrow will bring?
MSLP is down to 970 hPa this morning, and the CAB Low / Greenland High dipole is still evident:
Hence the GFS forecast of a “blowtorch” on the Pacific side of the Arctic by the weekend:
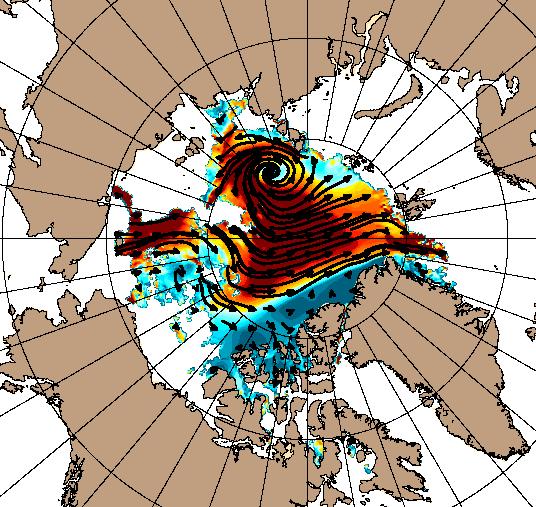
and the US Navy’s ACNFS ice drift forecast for today:
The University of Hamburg have been processing more AMSR2 data from 2012. You can argue until the cows come home about which is the best metric to peruse at this time of year, but try this one for size:
That’s the high resolution AMSR2 sea ice area for the Arctic Basin, comprising the CAB plus Beaufort, Chukchi, East Siberian and Laptev Seas.
There’s a bit of a gap in the clouds over the Central Arctic today:
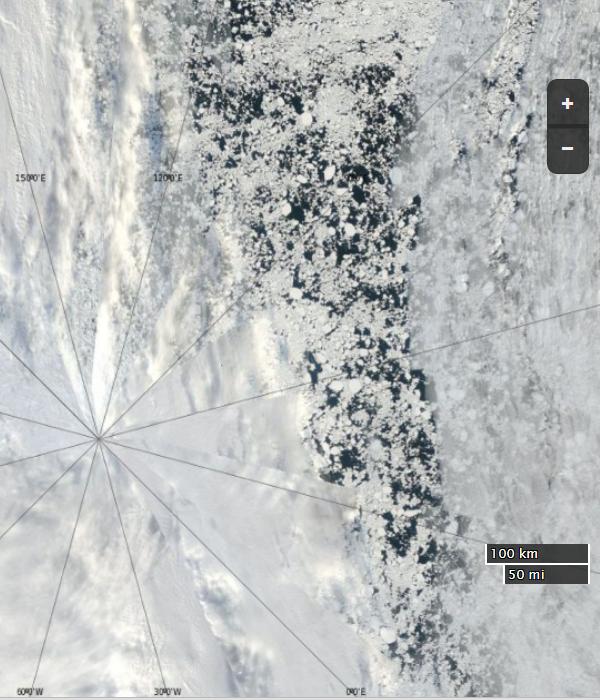
This is merely the calm before the next storm. Here is the current ECMWF forecast for Saturday lunchtime (UTC):
Low pressure on the Siberian side of the Arctic and high pressure on the Canadian side producing an impressive dipole with lots of sea ice “drift” towards the Atlantic:
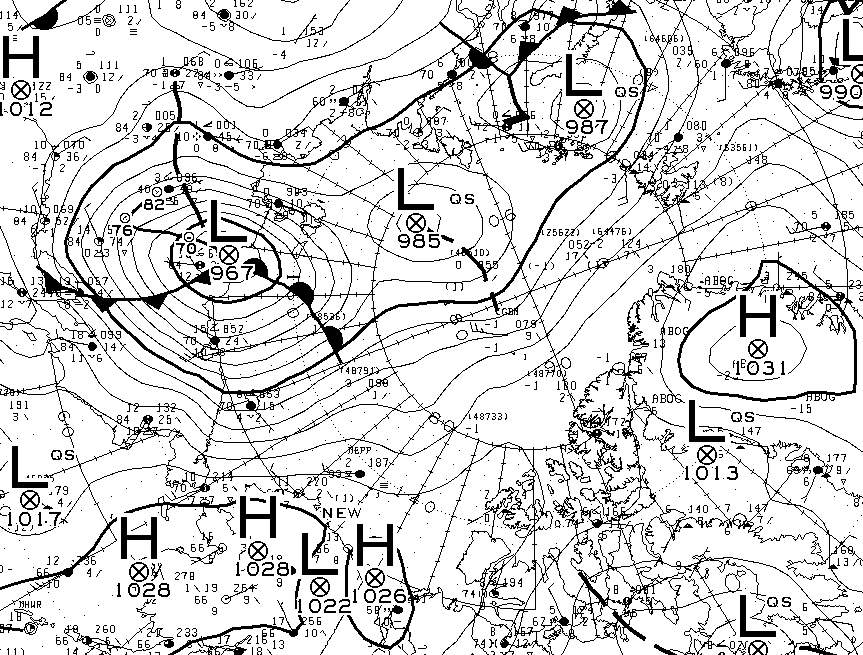
Saturday morning has arrived, and so has the predicted storm. As the centre of the cyclone crossed the coast of the East Siberian Sea its central pressure had fallen to 967 hPa, whilst the high pressure over Alaska had risen to 1028 hPa:
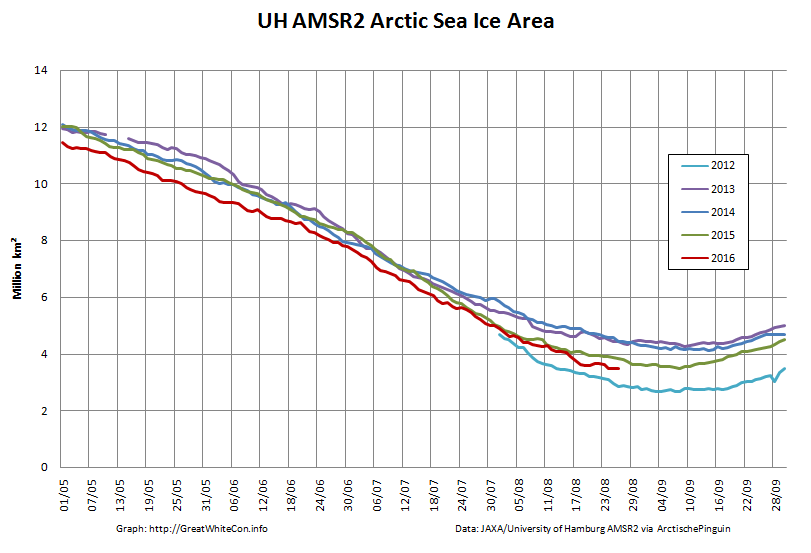
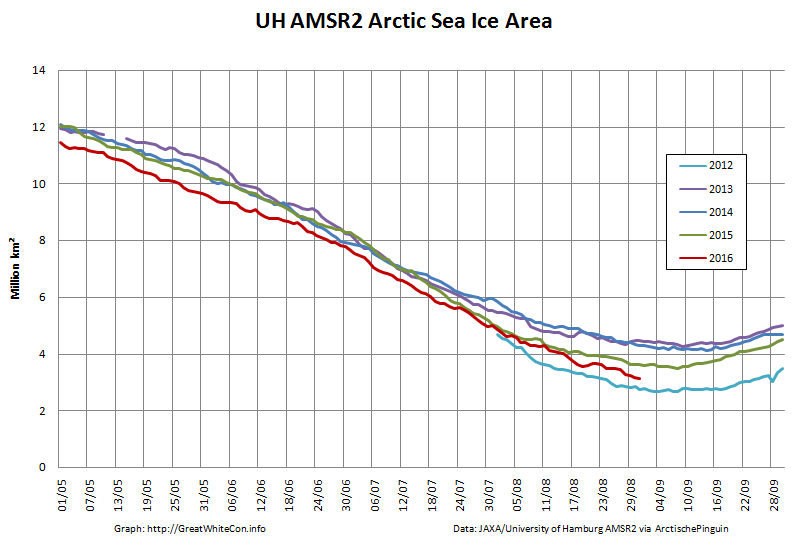
The effect of the earlier bursts of high wind is apparent in the high resolution AMSR2 sea ice area graph:
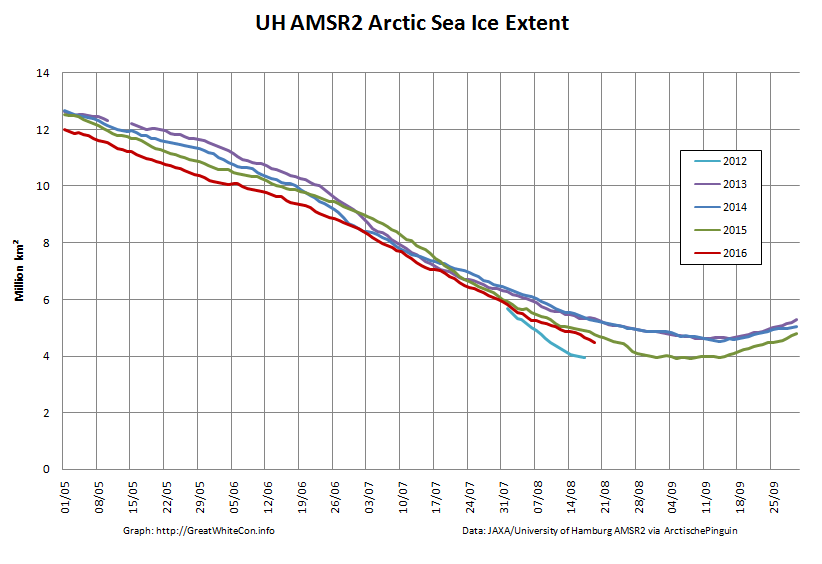
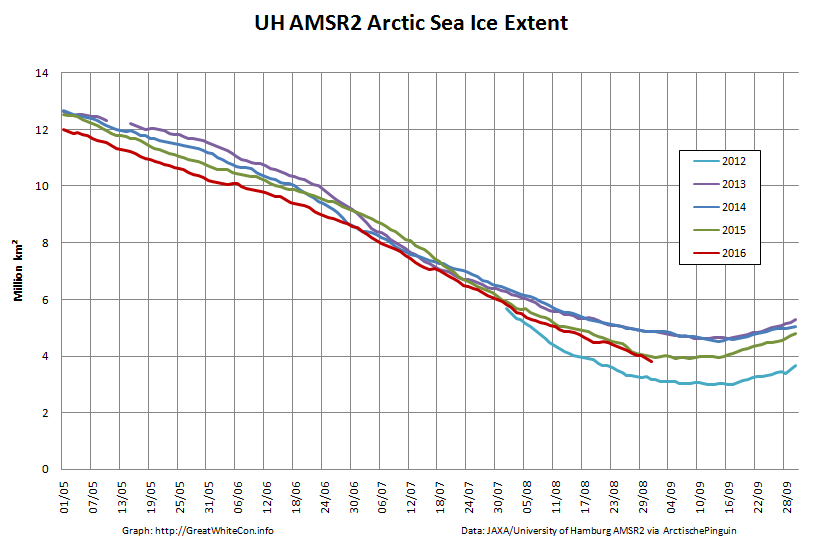
However they are not as apparent in the corresponding extent graph:
As the centre of the cyclone heads for the North Pole the isobars are tightening across the last refuge of multi-year sea ice north of the Canadian Arctic Archipelago and Greenland:
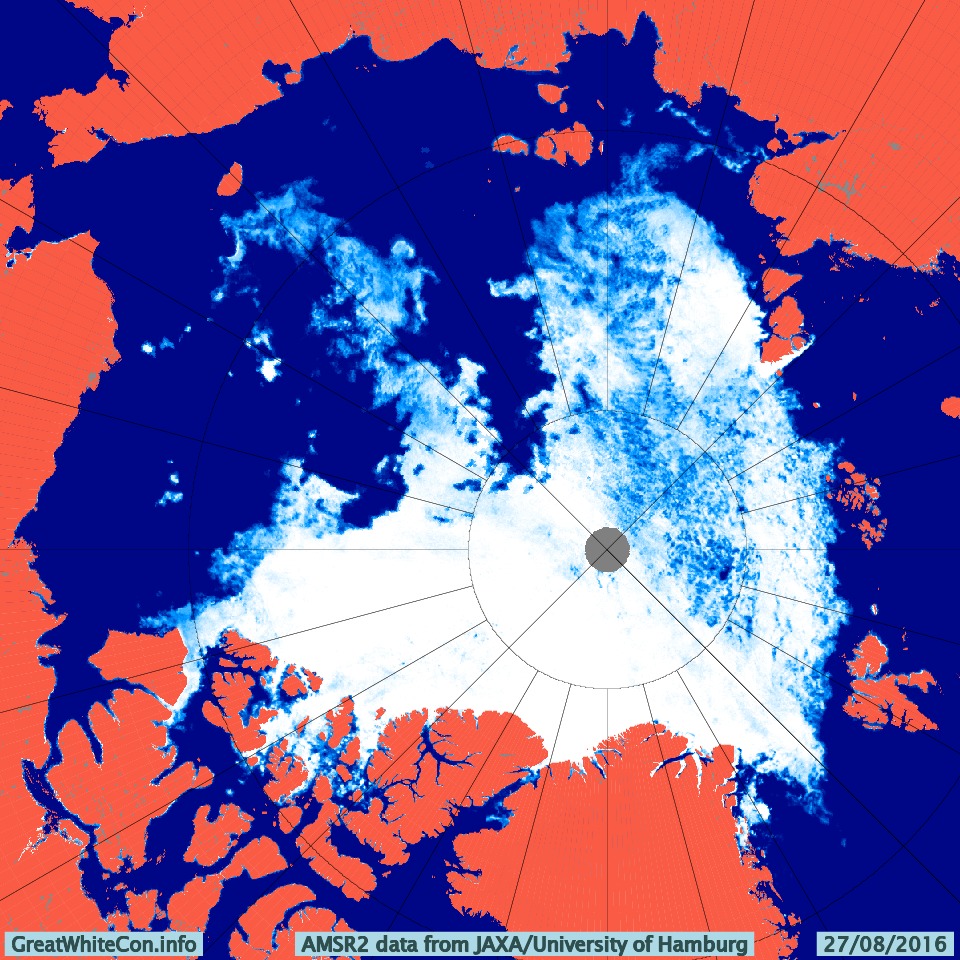
The area north of the East Siberian Sea that was predicted to bear the brunt of the wind and waves overnight is still covered in cloud. However the latest AMSR2 update from the University of Hamburg suggests that open water now stretches as far as 86 degrees north:
The skies over the northern Chukchi Sea have cleared to reveal this:
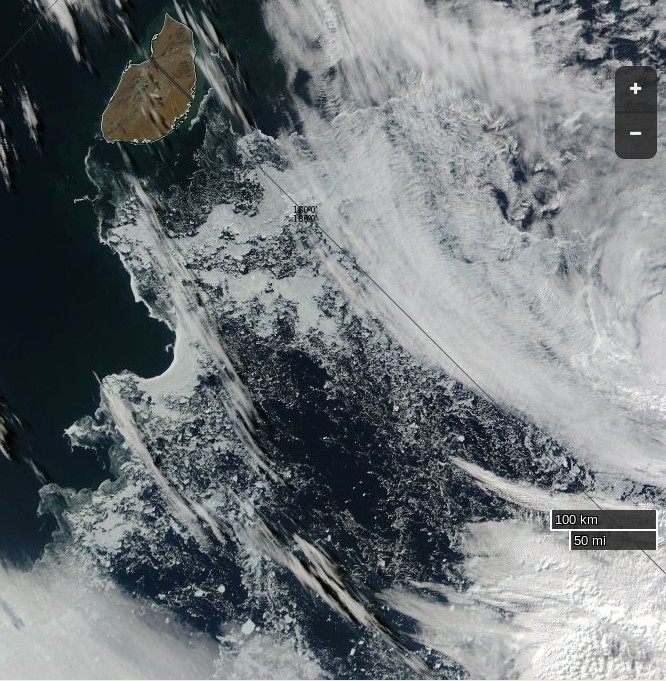
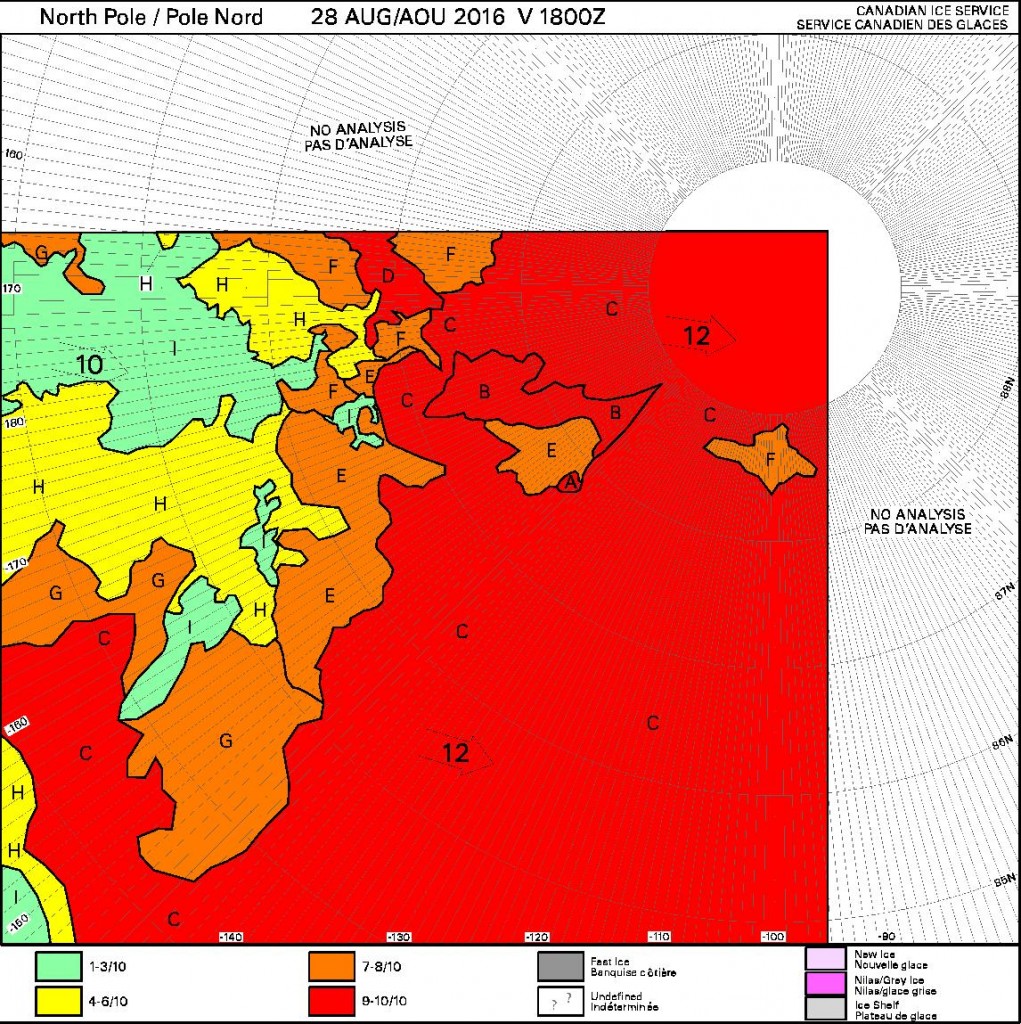
Some of the effects of the recent high winds can be judged by this Canadian Ice Service chart of ice concentration near the North Pole:
Arctic sea ice area continues to fall quickly for the time of year:
The recent dipole has finally caused some compaction of the scattered sea ice. Hence the high resolution AMSR2 extent is following suit and is now below last year’s minimum:



Thanks for the real-time update; following this closely. Curious whether the combination of wind, waves, and subsurface melt will be sufficient to cause a large ice detachment from the main pack.
File this under stranger than fiction…college flunk out Anthony Watts crawled out of hiding this morning and went postal on my alter ego Saul because yours truly asked for permission to share our exchanged emails with Peter Sinclair.
In spite of, or more likely because of my numerous warnings, he has become a #GAC16 denier. I am afraid that will cost him a 42 day timeout… he is the one and only member of my twitter mute list.
The 12Z are worse than the overnights
On the topic of “stranger than fiction”, the old conspiracy theory bollocks continues to amaze …
http://www.bbc.co.uk/news/world-australia-37091391
Jim, I notice from your arctic sea ice AREA graph that there’s been a huge loss of around 400 sq km over just 3 days. 2016 is now challenging 2012 for the record low.
Quite so Bill.
See the latest update above.
I overestimated the loss of ice. Having found Wipneus’ data I see it’s actually 320,000 sq km in 3 days. Nevertheless, remarkable for the time of year.
Another 133.5 sq km has disappeared since yesterday.
Quite remarkable!
Jim, in my personal version of reality the storm will be with us for quite a bit longer…time will tell
Quite so Reggie.
See the latest update above.
Dipole next week?
Briefly at least, if the forecast is accurate!
O ye of little faith…
happy are those who see and believe
reggie 9:26
We may be close to witnessing the spinning (spooling ?) up of a BT over Greenland…
may be on the persistent side and hang around
Should that BT last longer than a few days a certain (almost) eponymously named ice shelf will be damaged
Right, I’m probably going to slap my forehead, but, in the above context, what does “BT” stand for?
@ William Anura
your twitter has answer
#ftf
Reggie’s world famous “BlowTorch”!
Ah, so it’s not British Telecom or Bovey Tracey.
Not being a twitter user, I missed out on the “blowtorch” reference.
I think I’ll forego the forehead slapping for once.
Will continuing cyclonic activity impact volume measurement? Eckman pumping and wave action through open water and ice rubble should result in lower volume although I’m not sure satellite altimetry will be able to differentiate in rough sea conditions. Wider error bars for August?
At this time of the year we only have “volume modelling” rather than “volume measurement”. That will have to wait for CryoSat 2 and SMOS “thickness measurement” to restart in the Autumn.
No doubt somebody will correct me if I’m wrong, but as far as I am aware the PIOMAS model does not directly concern itself with wave/ice interaction, although it does assimilate sea ice concentration in order to try and get a better handle on thickness.
The NSIDC have published the latest edition of their Arctic Sea Ice News. The effects of waves on sea ice during the Great Arctic Cyclone are discussed at length: