In the spirit of providing some spurious “balance” to the contentious Arctic sea ice “debate” our quote for today comes fairly fresh from the Arctic Sea Ice Forum:
idk how people are confusing the gaping fissures that span from Siberia to Canada with melt ponds but it seems like half the people here have blinders on to what is ongoing.
I know HYCOM gets a lot of flak but instead of projecting out, let’s look at the last five days.
[Superfluous image redacted]
The ice has clearly broken completely in two now, and the recent ~970mb low did a major whomping to the ice in the “cleavage” between what’s stuck against Siberia and the main CAB.

Intriguingly this was in response to an informed comment on June 23rd to the effect that:
As we have seen recently, these large area drops in the middle of the pack do not mean the ice is gone, just that its top is wet/ponded. In a couple of days some of these drops might be reversed. Of course the ice has suffered in the meantime, but still it’s risky to simply extrapolate these numbers.
Even more intriguingly our headline for today is remarkably like the inverse of a phrase in a Mail on Sunday article that led us to create this site in the first place!
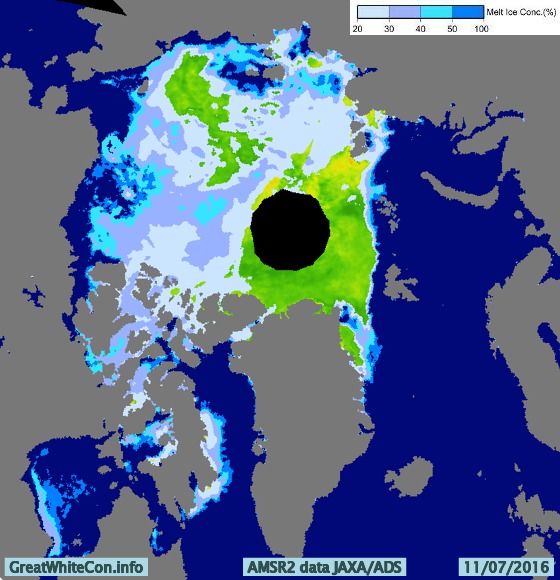
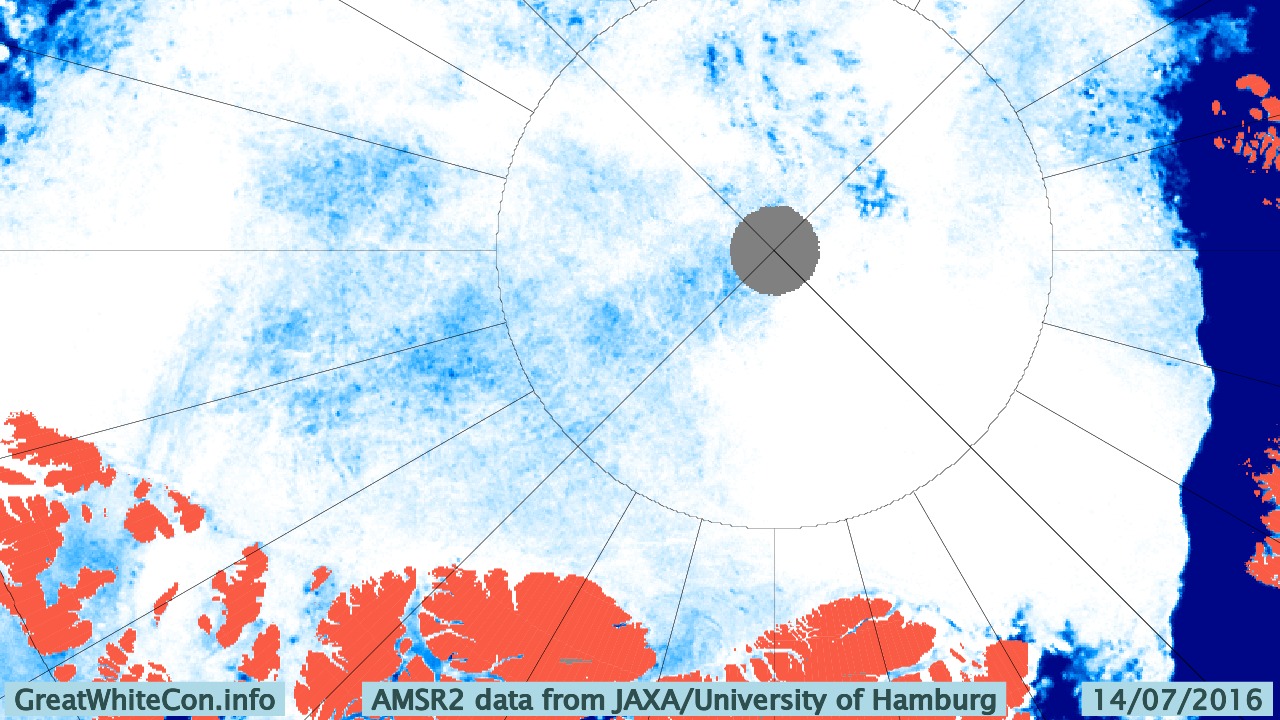
Nearly three weeks have passed since those “gaping fissures that span from Siberia to Canada” were announced, and you may well (like me) be wondering how they have been coming along? In partial answer to that question here is our very latest video based on the University of Hamburg’s AMSR2 concentration visualisations:
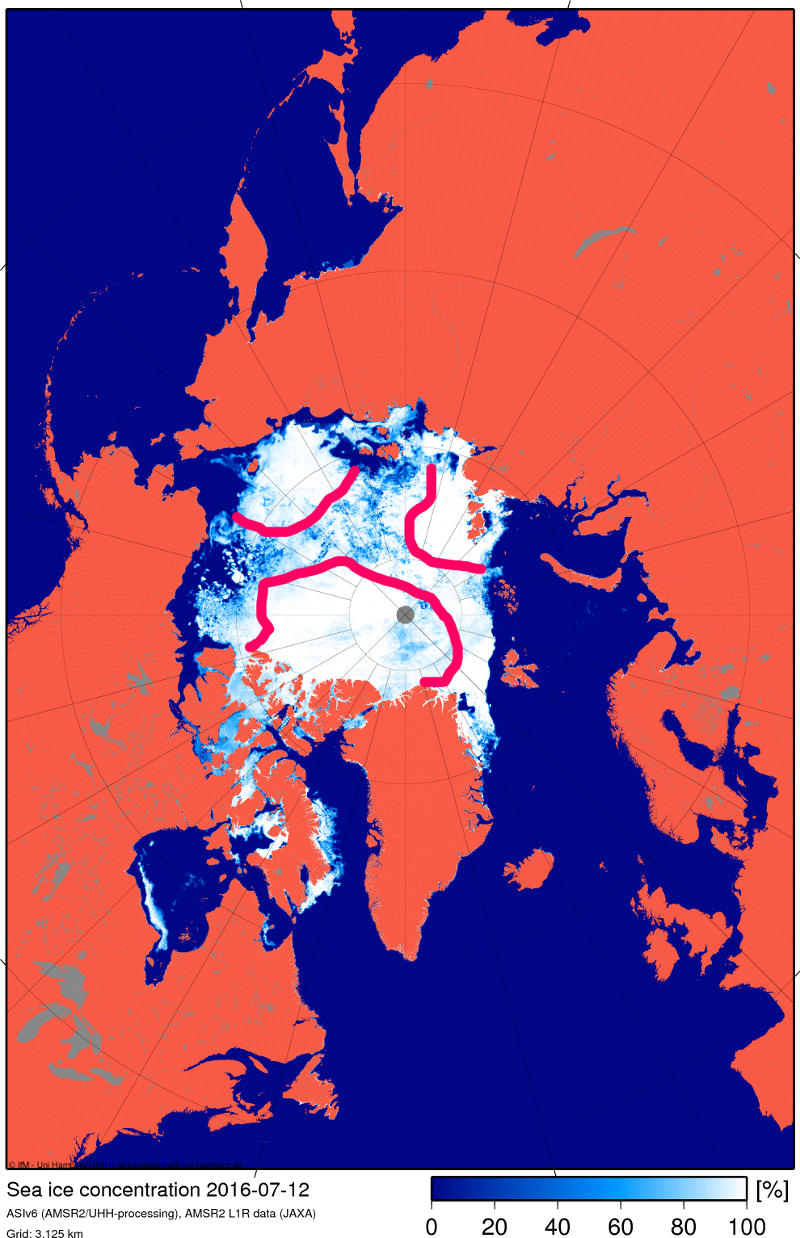
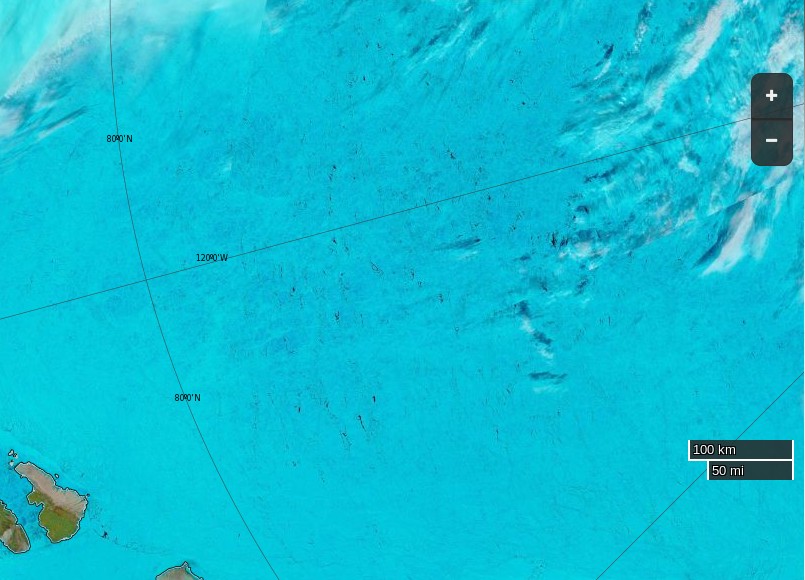
In my own humble opinion this doesn’t really count as a “gaping fissure” but MODIS imagery does now show a fair bit of open water between Siberia and the North Pole:

A “gaping fissure” between the Pole and Canada (and/or Greenland) is however conspicuous only by its absence:
I do think that I can spot some melt ponds in the area at the moment though. How about you?
The one CRREL/ERDC ice mass balance buoy still reporting reveals that both surface and bottom melting have started at around 83 degrees north:
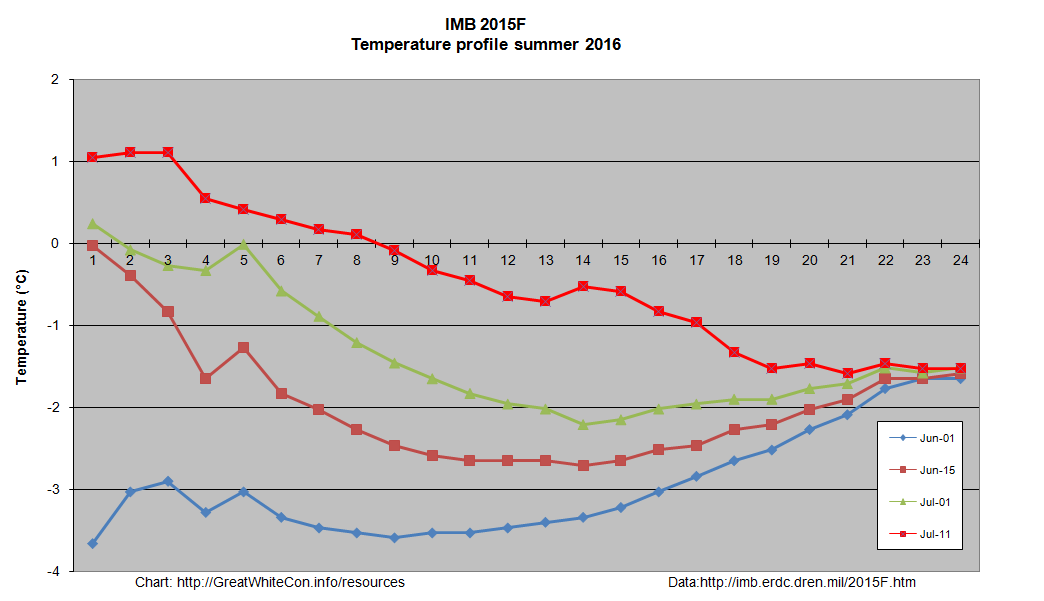
The 2016 multi-year ice melting season has evidently now begun, and the floe upon which buoy 2015F is sitting still has ~1.9 metres of melting to go. It’s not beyond the bounds of possibilty that a “gaping fissure” from the Atlantic to the Pacific will ultimately emerge this year. However based on the evidence thus far I’ll be extremely surprised if there is one “from Siberia to Canada”, unless of course you count the Chukchi & Beaufort Seas. That route is already open to intrepid Arctic seafarers, as can be seen at the bottom of the animation above and on the current JAXA/ADS Arctic sea ice surface melt map:
It seems I was mistaken. According to my flack jacketed informant over at the ASIF:
I have taken lots of flack I will stand by my prediction that we are heading for sub-1M KM2 come September (or early October).
Structurally [the ice] has actually now broken into three pieces, one is attached to the islands N of Siberia/NE of Svalbard, one is near Wrangel/ESS, and the “bulk” is pushed against the CAA/Greenland.
The lower concentrations in CAB are clearly open water and not melt ponds.
I felt compelled to explain to (presumably) him that:
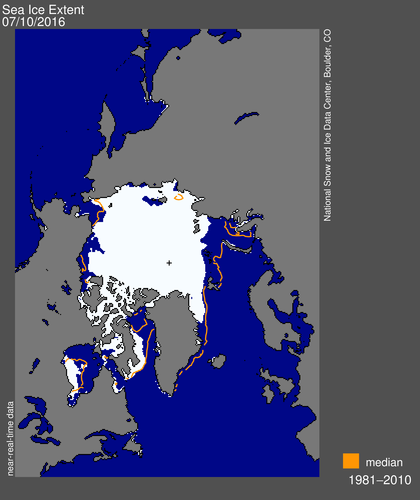
Here’s the NSIDC’s view of those “gaping fissures” of yours:
“Flak jacket” assures me that:
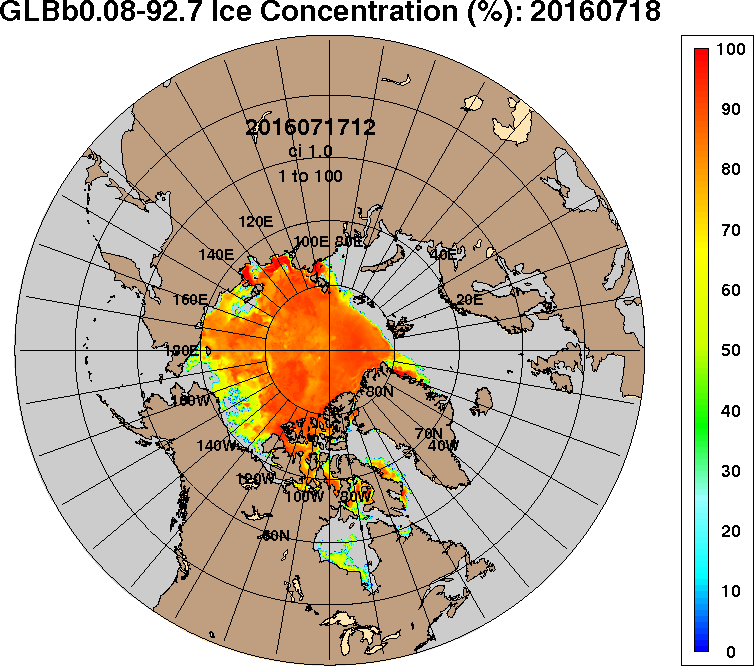
Despite some faults I think both ARC and GLB are onto the truth. Satellite grabs over the past few days show failure on all three fronts (ATL, PAC, and the Russian side especially), but the Russian side doesn’t present as a solid front (nor does the Beaufort melt), and the leads keep getting absorbed into the slush of the main pack (which is why the ‘slush’ keeps expanding, and why most of the CAB has now evolved into this state). The only solid regions of ice are those bordering the steaming ATL waters as well as some remnants north of the CAA (no coincidence the latter was chosen as ‘evidence’).
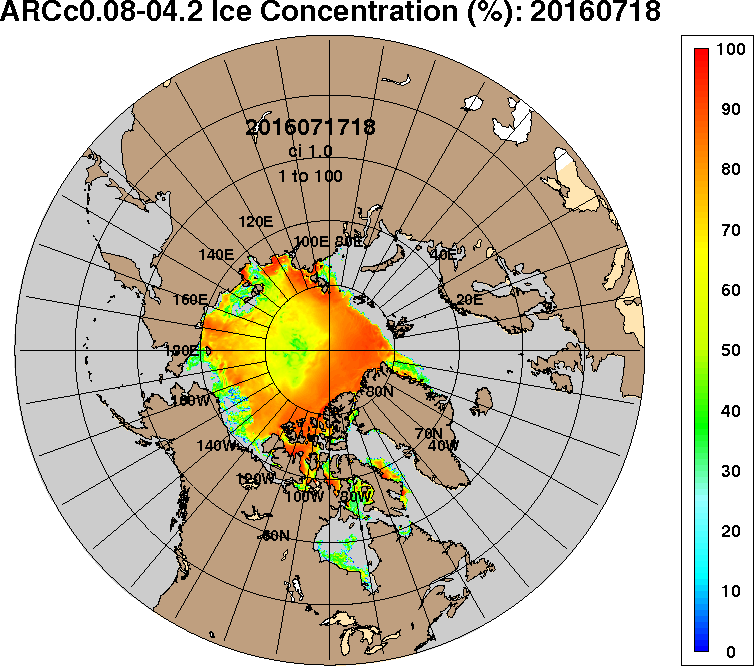
“ARC” refers to the US Navy’s Arctic Cap Nowcast/Forecast System. Here’s the ACNFS sea ice thickness “nowcast” from July 13th:

Here’s the July 13th model run sea ice thickness forecast for July 14th:

and here’s an annotated version of the Navy’s sea ice concentration forecast:
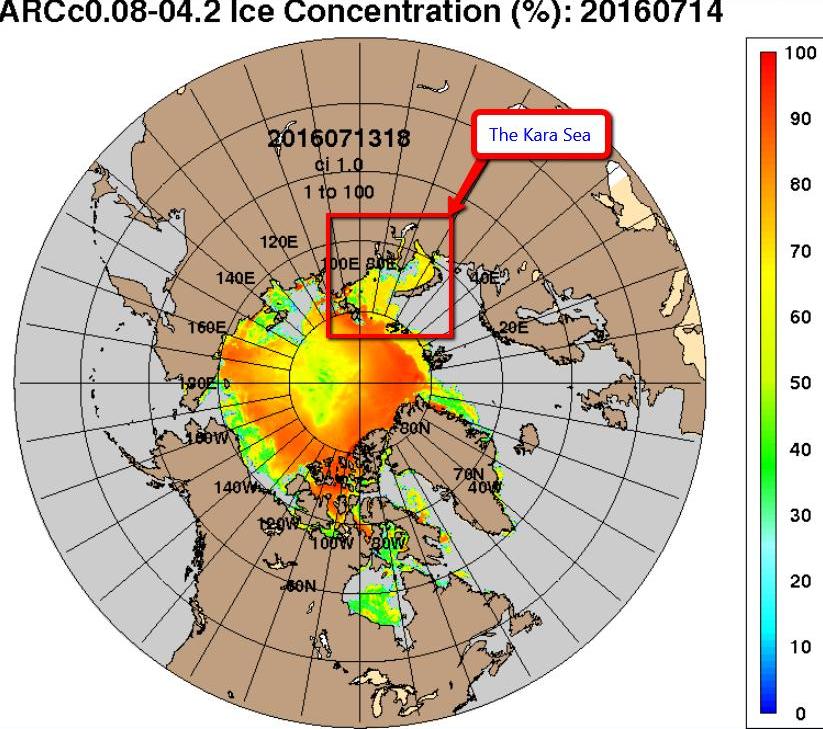
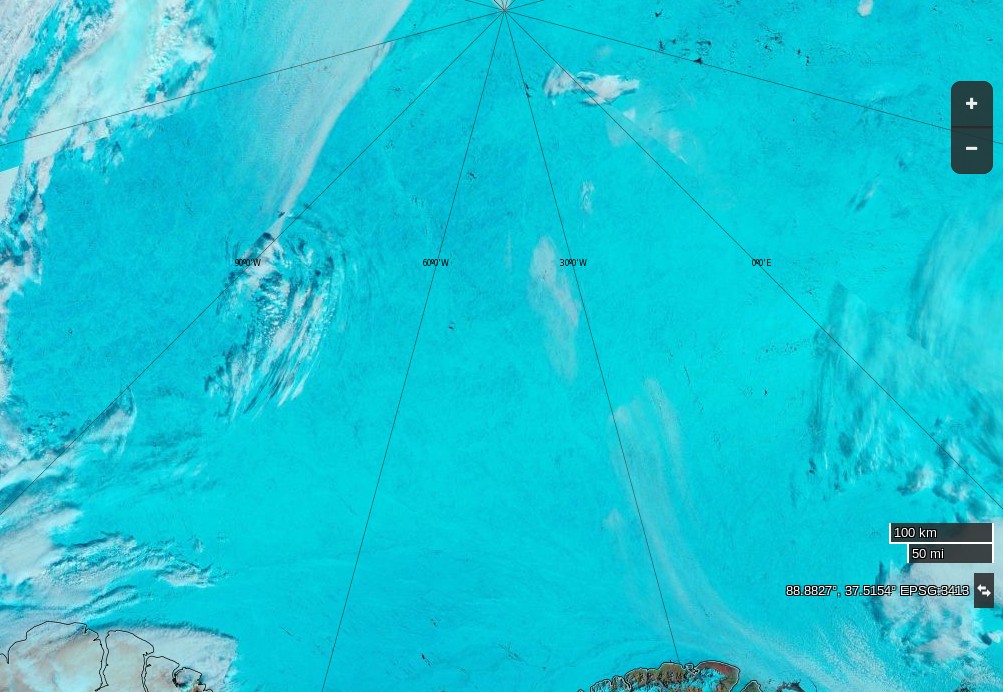
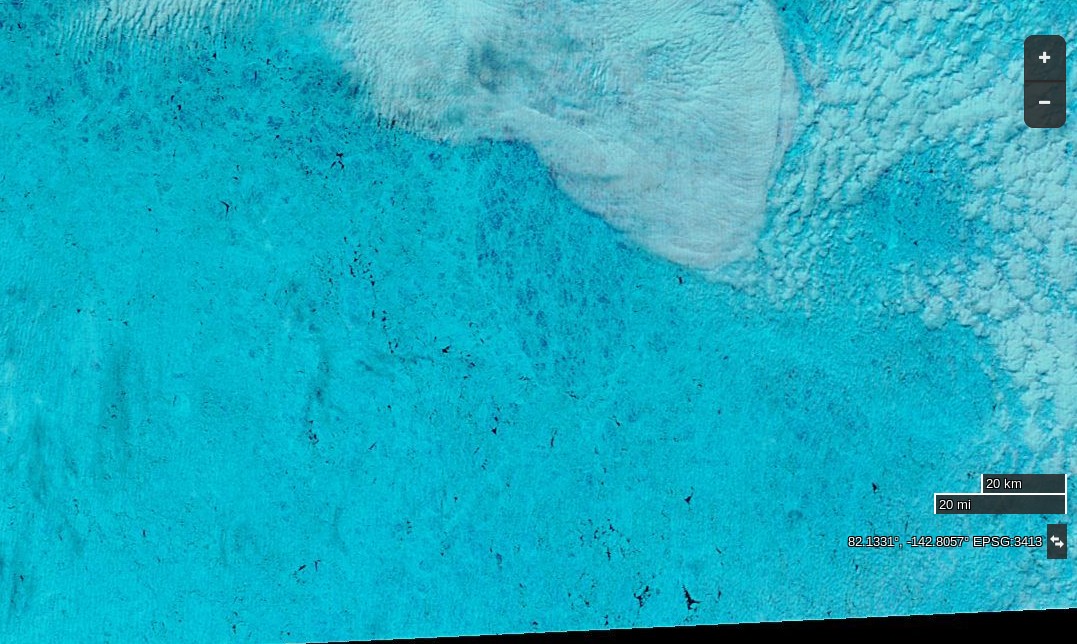
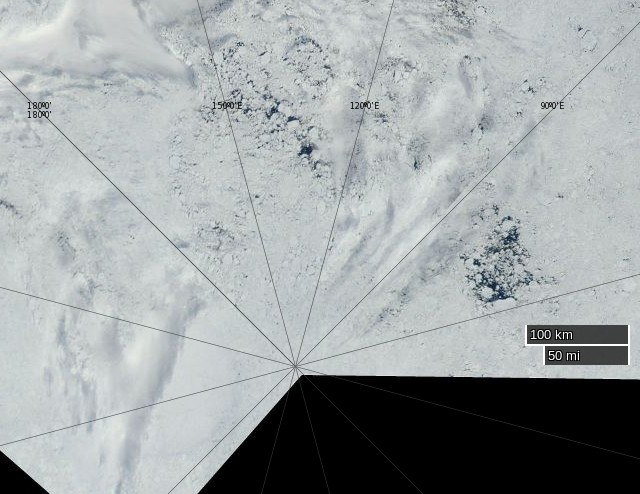
Yesterday the Kara Sea didn’t suddenly become covered in sea ice, and today the area of the Central Arctic Basin around 82 N, 135 W looks like this to the MODIS instrument on board the Terra Satellite:
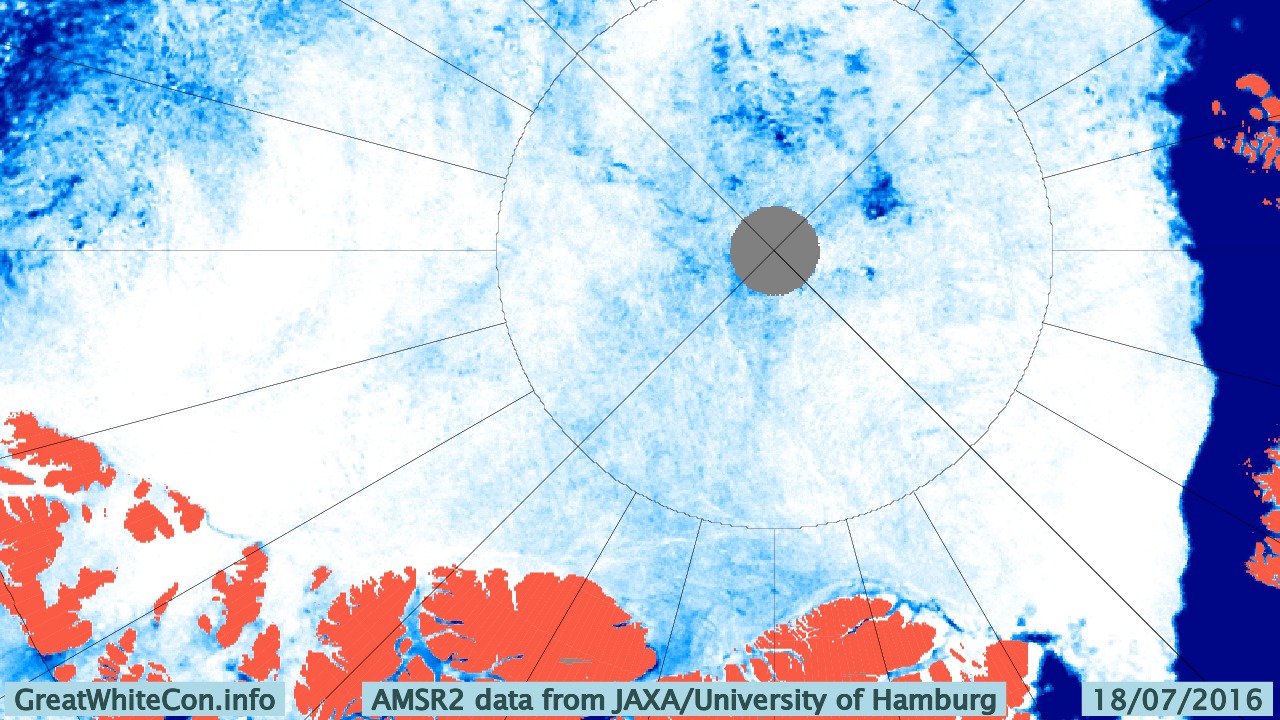
and like this to the University of Hamburg’s ARTIST sea ice concentration algorithm:
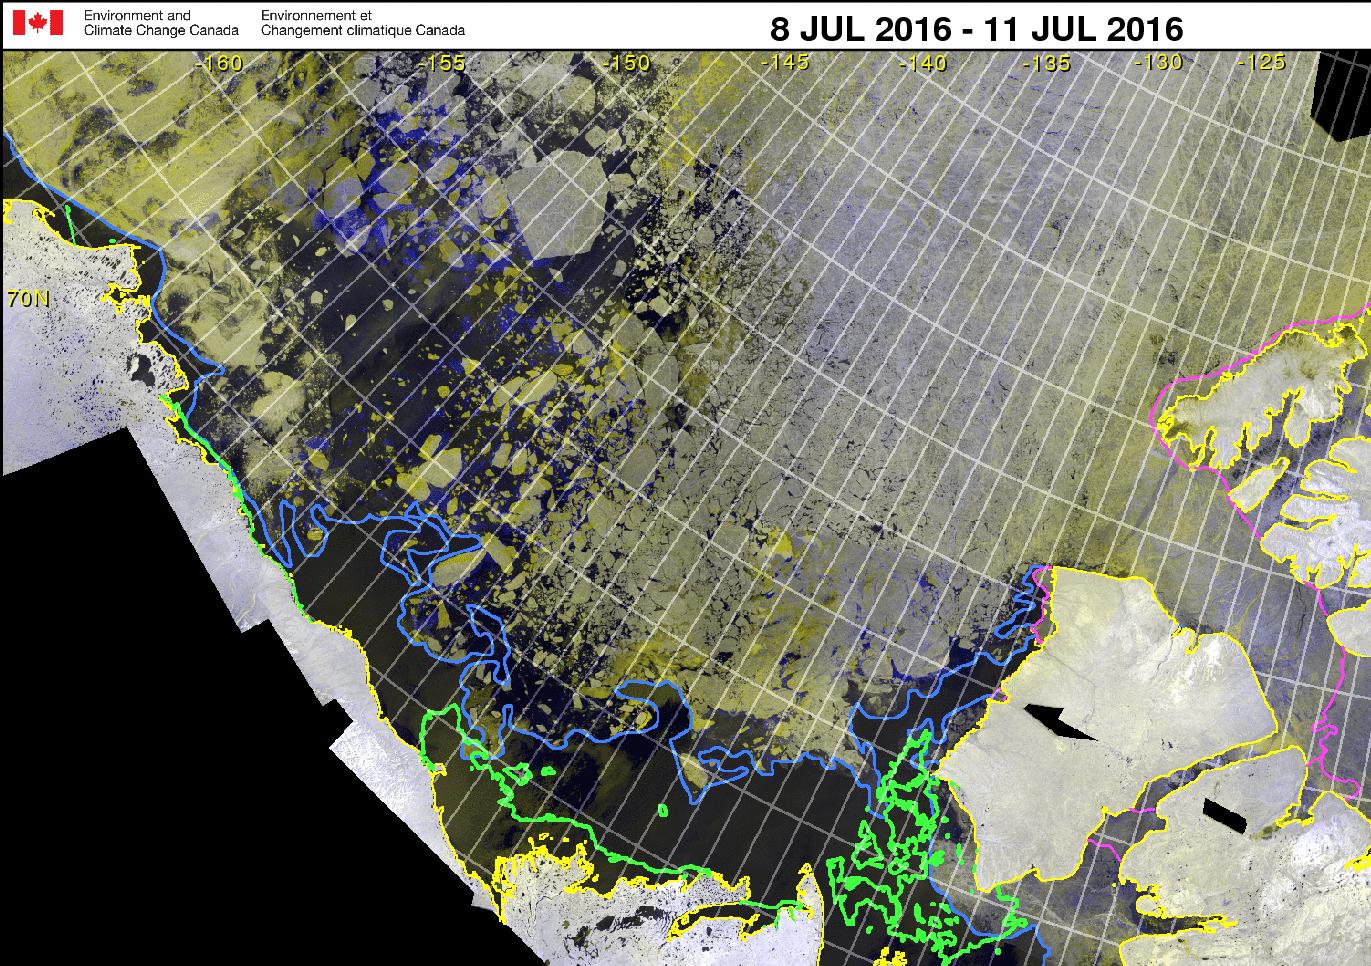
whilst here’s the latest Canadian Ice Service RadarSat mosaic for the Western Arctic:
Ice mass balance buoy 2015F reports this morning:
Current Buoy Data (07/15/2016):
Pos: 82.89 N, 137.34 W
Air Temp: -0.76 C
Air Pres: 1011.16 mb
Ice thickness : 185 cm
The Arctic Sea Ice Forum management have banished “Flack Jacket” to the sin bin for a month.
I’m fed up with the personal insults because a model that has a history of errors is showing something spectacular that no other data source does. Come back in a month if you still feel like it.
Meanwhile in answer to my enquiry on the HYCOM support forum Alan Wallcraft tells me:
We now use the National Ice Center’s IMS sea ice extent product in our assimiltion, see http://www.natice.noaa.gov/ims/. This is manually produced every day, and generally avoids the artifacts and deficiencies of satellite sea ice concentrations. However yesterdays IMS fields were not good, and that is where the spurious sea ice came from. Today’s IMS field is good, and we may rerun the 2016/07/13-18Z nowcast/forecast to clear this up.
After a brief “pause” ACNFS is back in action, and here is its latest Arctic sea ice concentration “nowcast”:

Yesterday the skies were clear once again over the corner of the Arctic where buoy 2015F is located:
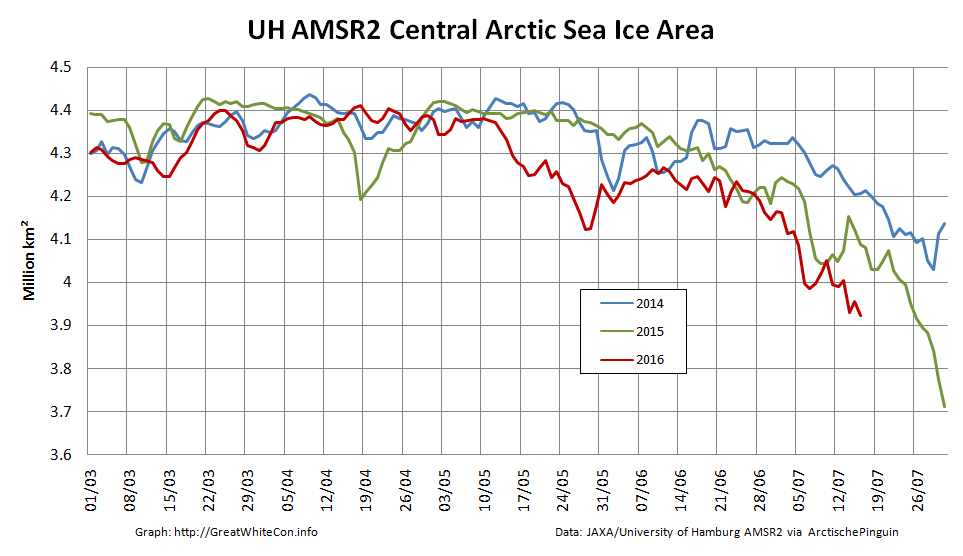
Here’s how the sea ice area in the Central Arctic Basin has been faring recently:
Here’s an early image of the North Pole from the Aqua satellite this morning, recorded for posterity in case it changes later:
and as the recent Arctic storm heads towards the Canadian Arctic Archipelago here’s the latest Hamburg AMSR2 concentration map:
I now also have an answer to my “supplementary question” on the HYCOM support forum:
I attach the ACNFS plot you referenced and the corresponding plot from our next global real-time system (GOFS 3.1), which will likely replace our current global analysis (and ACNFS) once NAVGEM 1.4 is operational (it is running here with NAVGEM 1.3, like ACNFS). They assimilate the same observations, but ACNFS only does so near the ice edge while GOFS 3.1 assimilates sea ice concentration everywhere (but with higher error bounds in the ice interior). The reason for ACNFS only assimilating near the edge is in part due to that being the most important area for navigation but also because SSMI satelite ice concentrations tend to “over saturate” in the summer. We switched GOFS 3.1 to “believe” the observations because they are generally better in recent years.
The two are quite different in the interior of the sea ice and GOFS 3.1 is certainly better there. We did not see the low concentrations near the North Pole in ACNFS this time last year, so something has happened to make the free running model produce low concentrations this summer. We are looking into it.
071800_927_arcticicen.001″ width=”754″ height=”666″ class=”aligncenter size-full wp-image-4361″ />